Monitor Model Production Indicators
The online model indicator monitoring refers to the real-time online analysis of model performance parameters during model production. After the model version is deployed and starts running, you can monitor the following model production indicators to understand the operating performance of the model:
System service indicators
Service access information
Underlying system information
Model performance indicators
Evaluation indicators
Comparison with true values
Comparison with business indicators
The production indicators of a model directly affects the judgment of its lifecycle phases, and can also serve as an important basis for getting models online, adjusting model service weights, and decommissioning models.
The model indicator monitoring consumes InfluxDB’s storage resources and indicator-smooth computing resources. Once a model version is deployed and online, the indicator monitoring function is disabled by default. For relatively simple models, you can choose not to enable the indicator monitoring function for maximizing the optimization of resources.
View Model Production Indicators
You can view the production indicators of the model versions in Production status by following these steps:
In the model list, click a model name to open the Model Version Management page.
Go to the Online Instance tab, turn on the monitoring function in the deployment instance list.

Click the monitor icon
 to view the system service monitoring data, including the total number of service calls, average call frequency, call success rate, and service response delay.
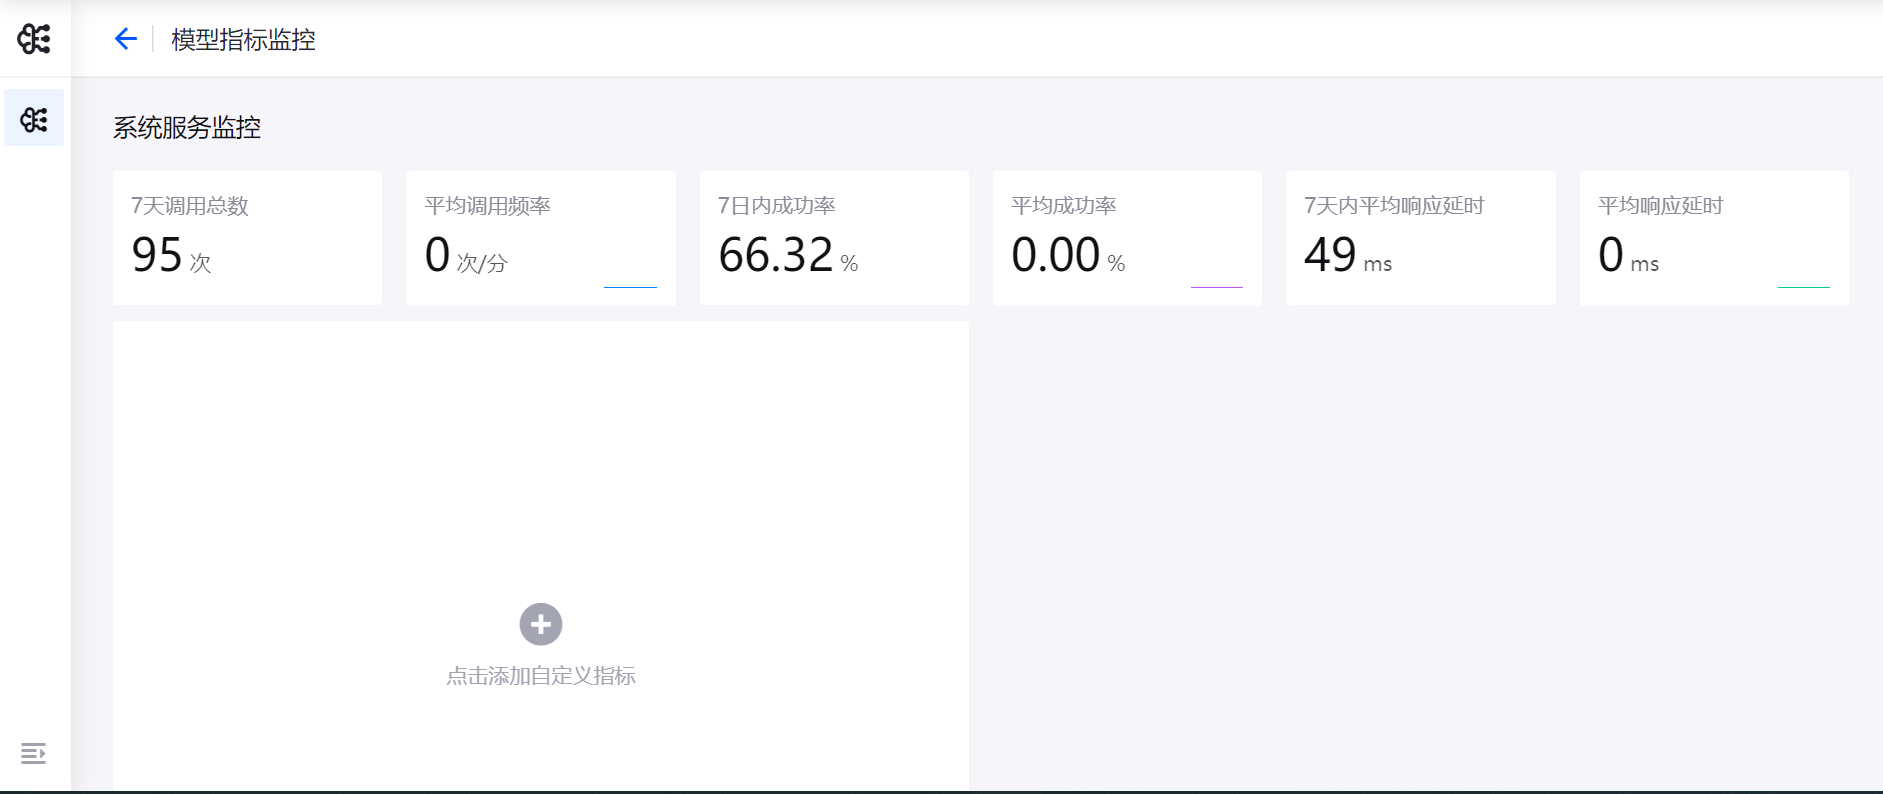
Click Add Custom Indicator to add more custom indicator monitoring items.
Feedback Value and Predicted Value
In the Predictor card of the Model Deployment canvas, you can obtain the URL for pushing the feedback value, and then push the response parameters through the URL according to business needs.
When the Feedback interface is successfully called, the predictorand observer indicator sources will be generated. You can view the curve comparison between the feedback value and the predictor value through the indicator monitoring page.
In the Model Deployment canvas, click Indicator Monitoring, and then click Add Custom Indicator.
Enter the indicator name in the pop-up window, and select Feedback Value and Predictor Value in the Indicator Type dropdown menu.
Specify variable names for
predictorandobserverindicator sources.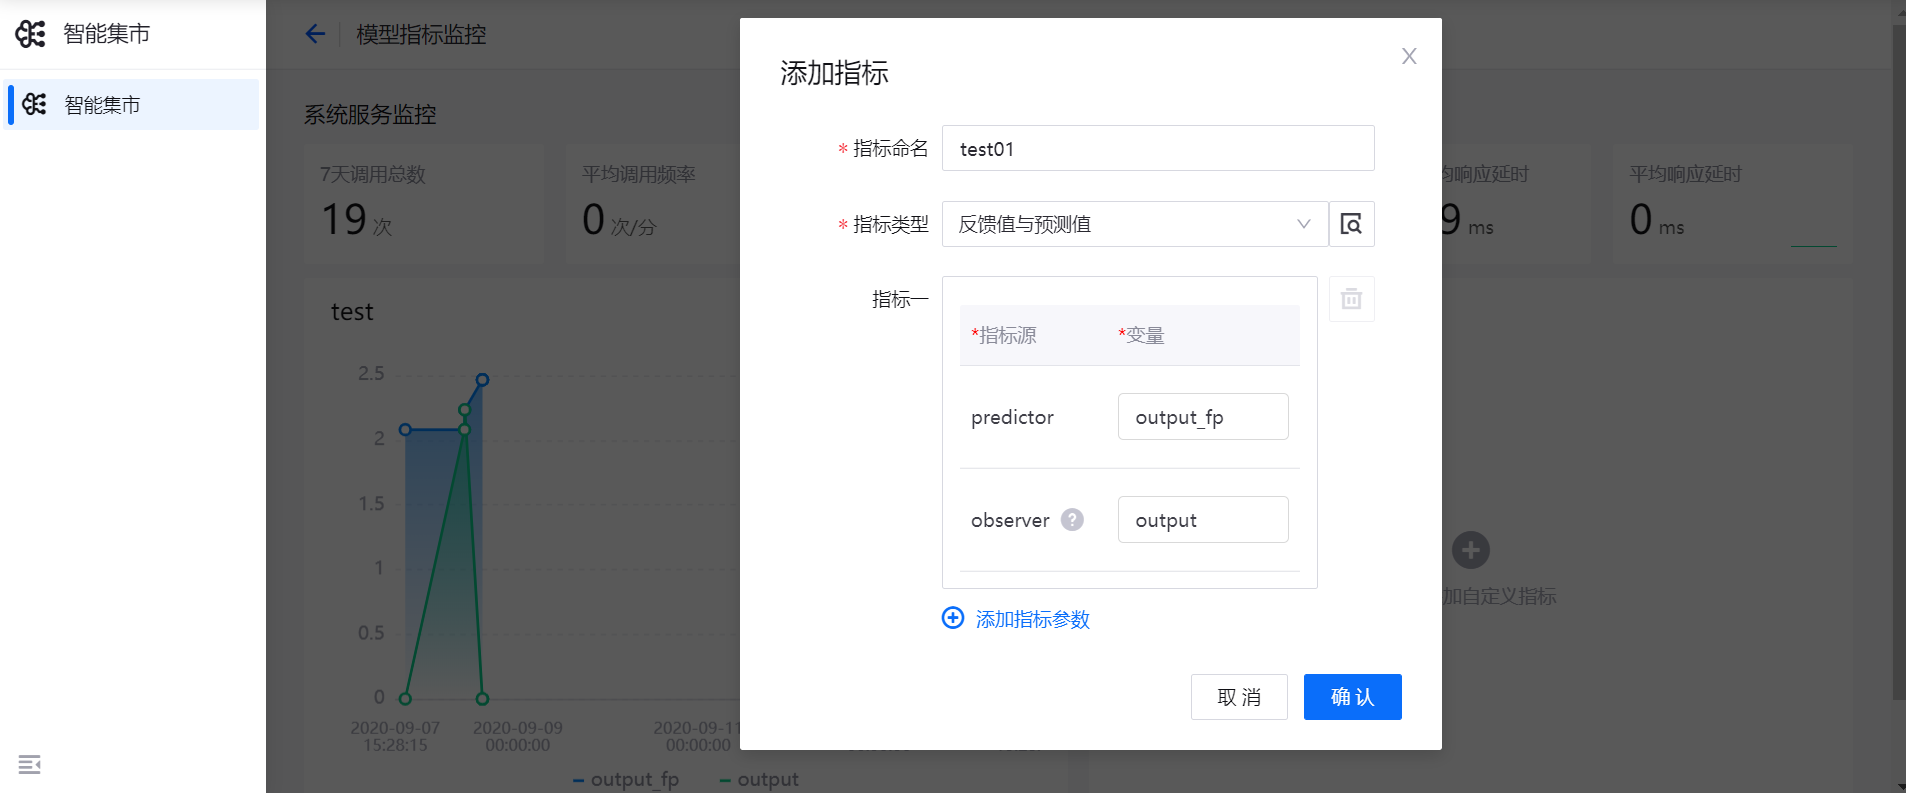
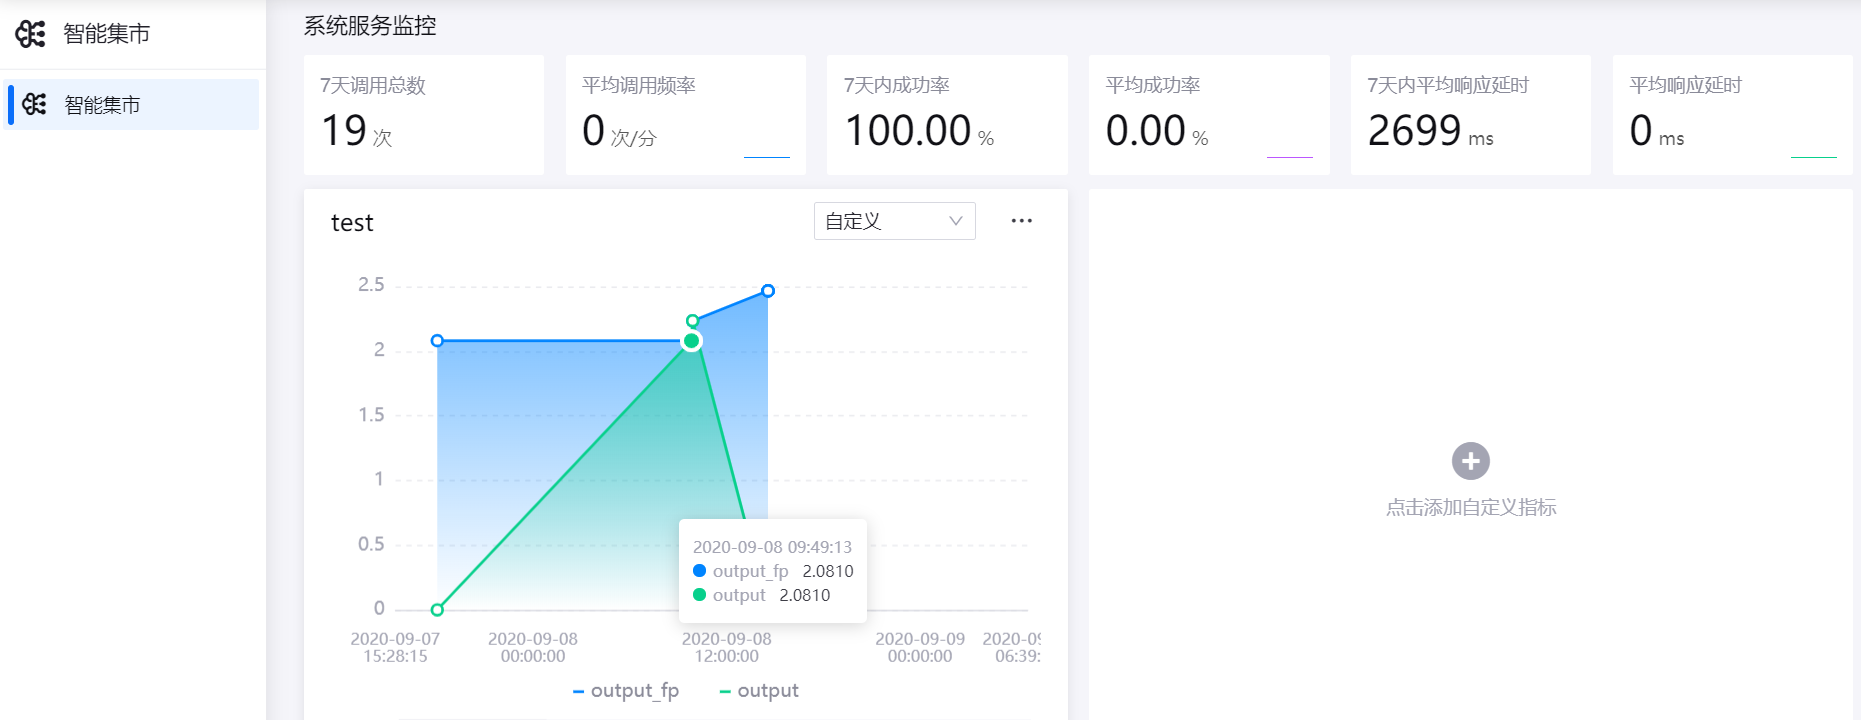
Click OK, add the feedback value and predictor value indicators, and view the curve comparison between the feedback value and the predictor value (where the X-axis stands for the time dimension, and the Y-axis stands for the value of the indicator).
Reward Value
The model Reward refers to the introduction of the business Feedback value of the model and the calculation with the Predictor value to determine the result of the current prediction and give appropriate rewards, providing reference for the next model prediction. You can view the line chart of the Reward value through the indicator monitoring page.
In the Model Indicator Monitoring page, click Add Customized Indicator.
Enter the indicator name in the pop-up window, and select Reward Value in the Indicator Type dropdown menu.
The system will automatically match the
feedbackindicator source and therewardvariable of the model version.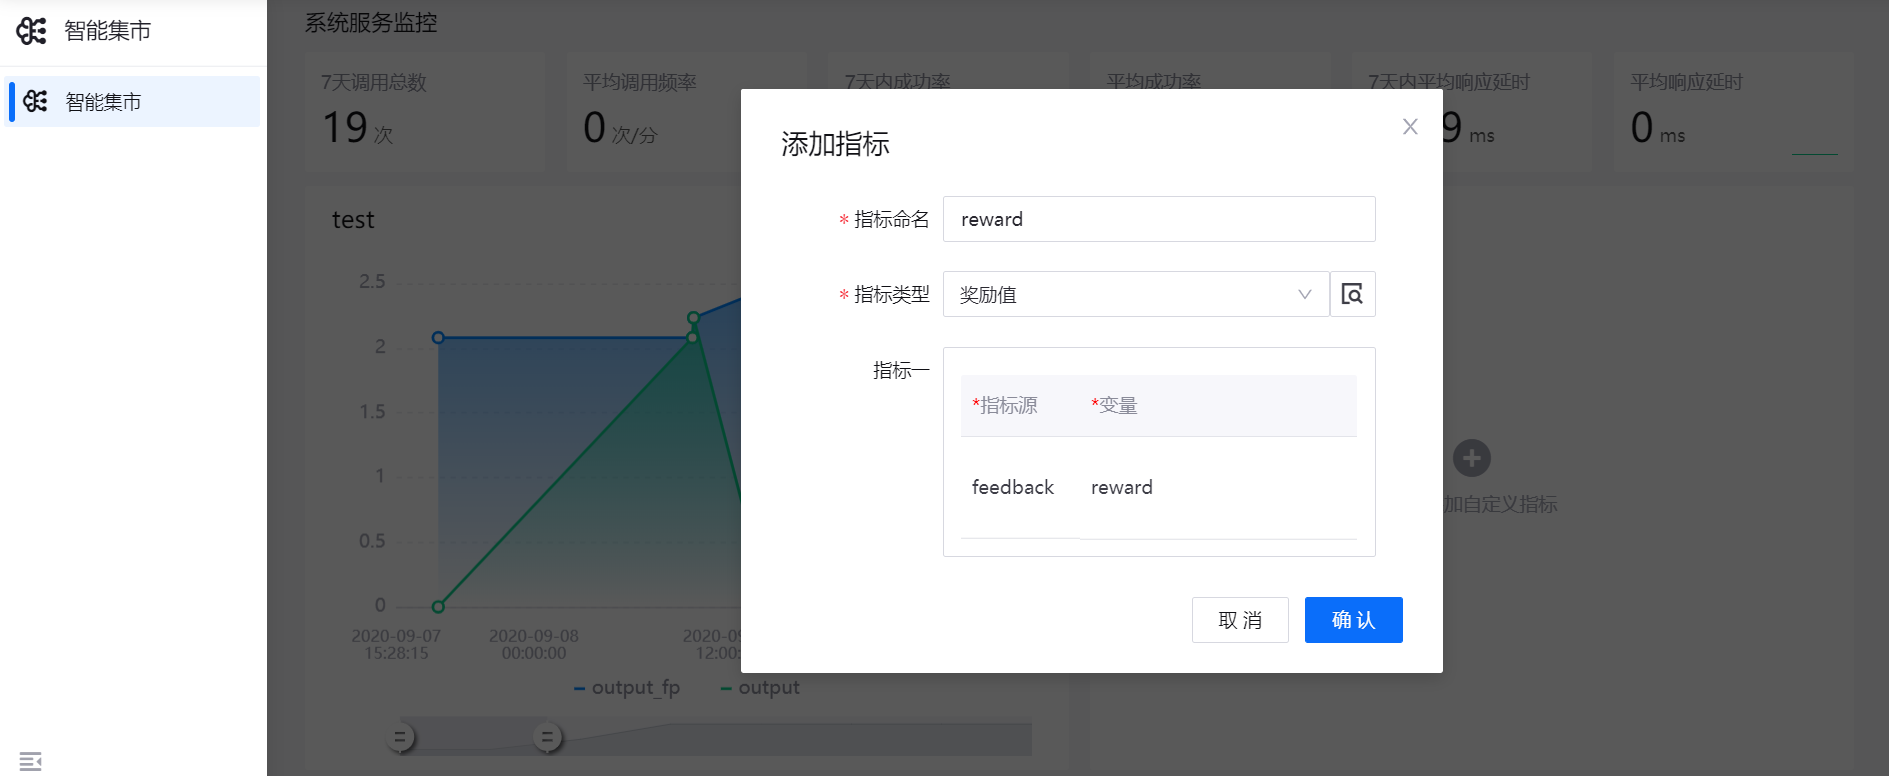
Click OK, add the reward value indicator, and view the line chart of the
Rewardvalue (where the X-axis stands for the time dimension, and the Y-axis stands for the reward input indicator value).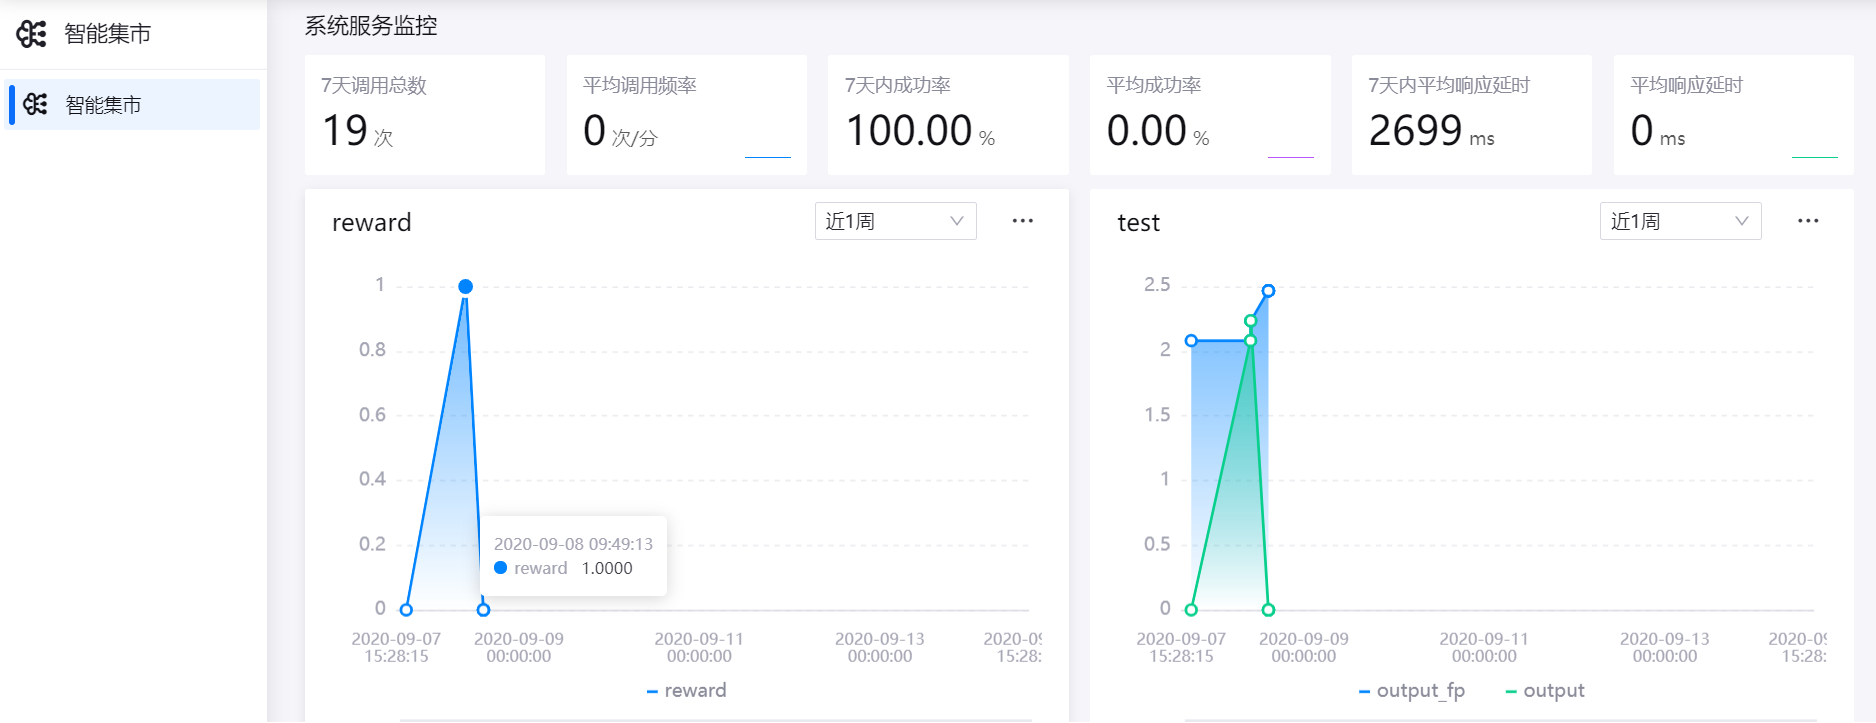
Fitting Indicators
When monitoring the existing model production indicators, the following monitoring indicators can be added to the fitting model operator:
Metric name |
Value range |
|---|---|
RMSE |
Root Mean Squared Error |
MAE |
Mean Absolute Error |
MPE |
Mean Percentage Error |
R^2 |
R-square |
MAPE |
Mean Absolute Percentage Error |
In the Model Indicator Monitoring page, click Add Customized Indicator.
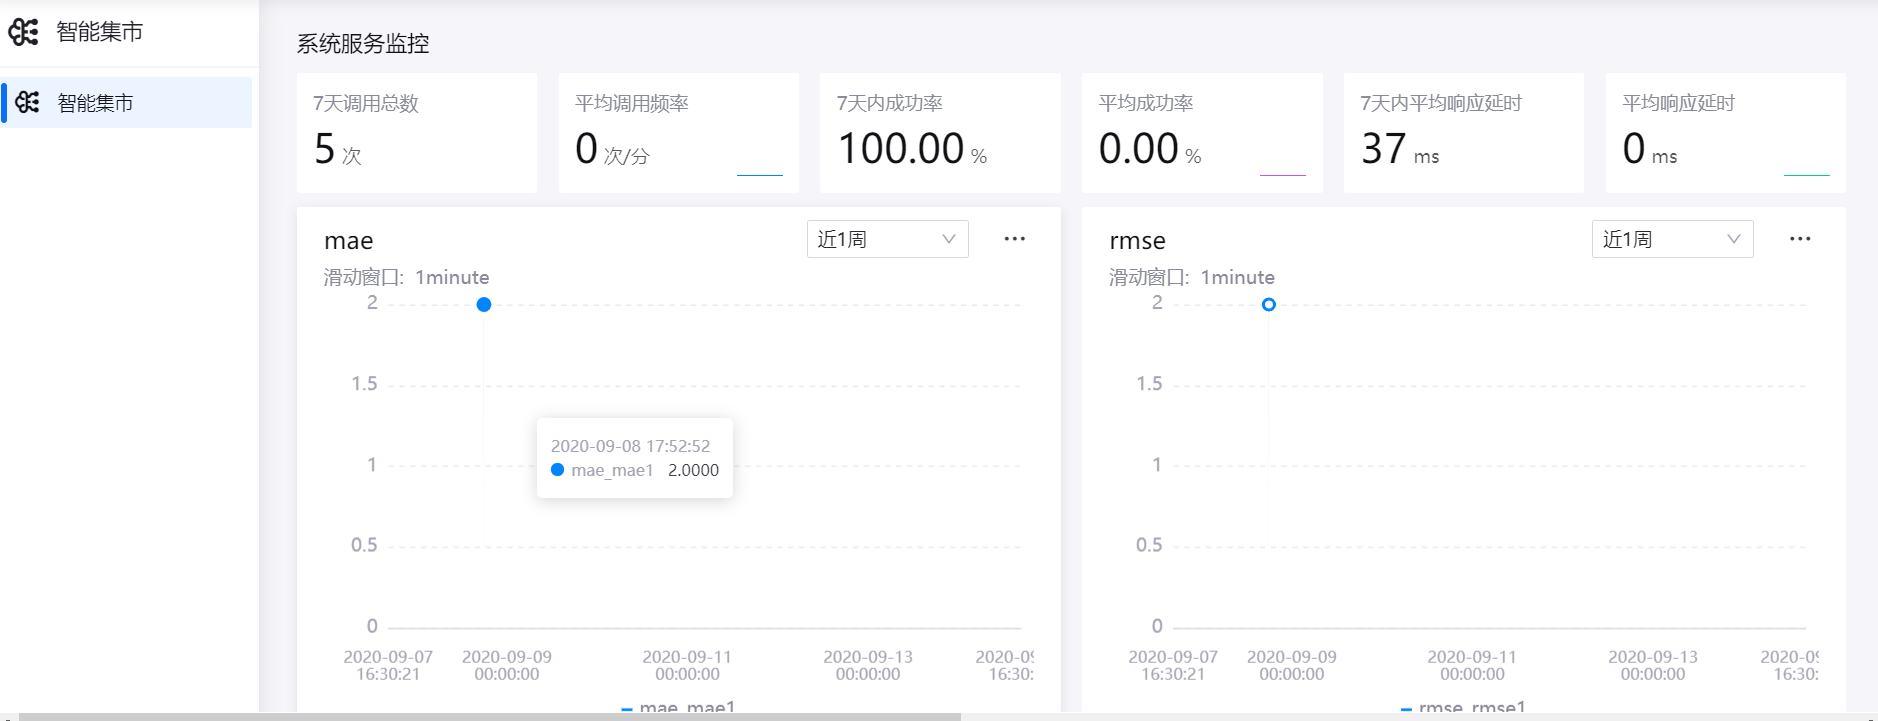
Enter the indicator name in the pop-up window, and select rmse / mae / mpe / r2 / mape in the Indicator Type dropdown menu.
Specify variable names for
predictorandobserverindicator sources.In the Sliding Window column, specify the window time for monitoring the changes of indicators in the dynamic environment.
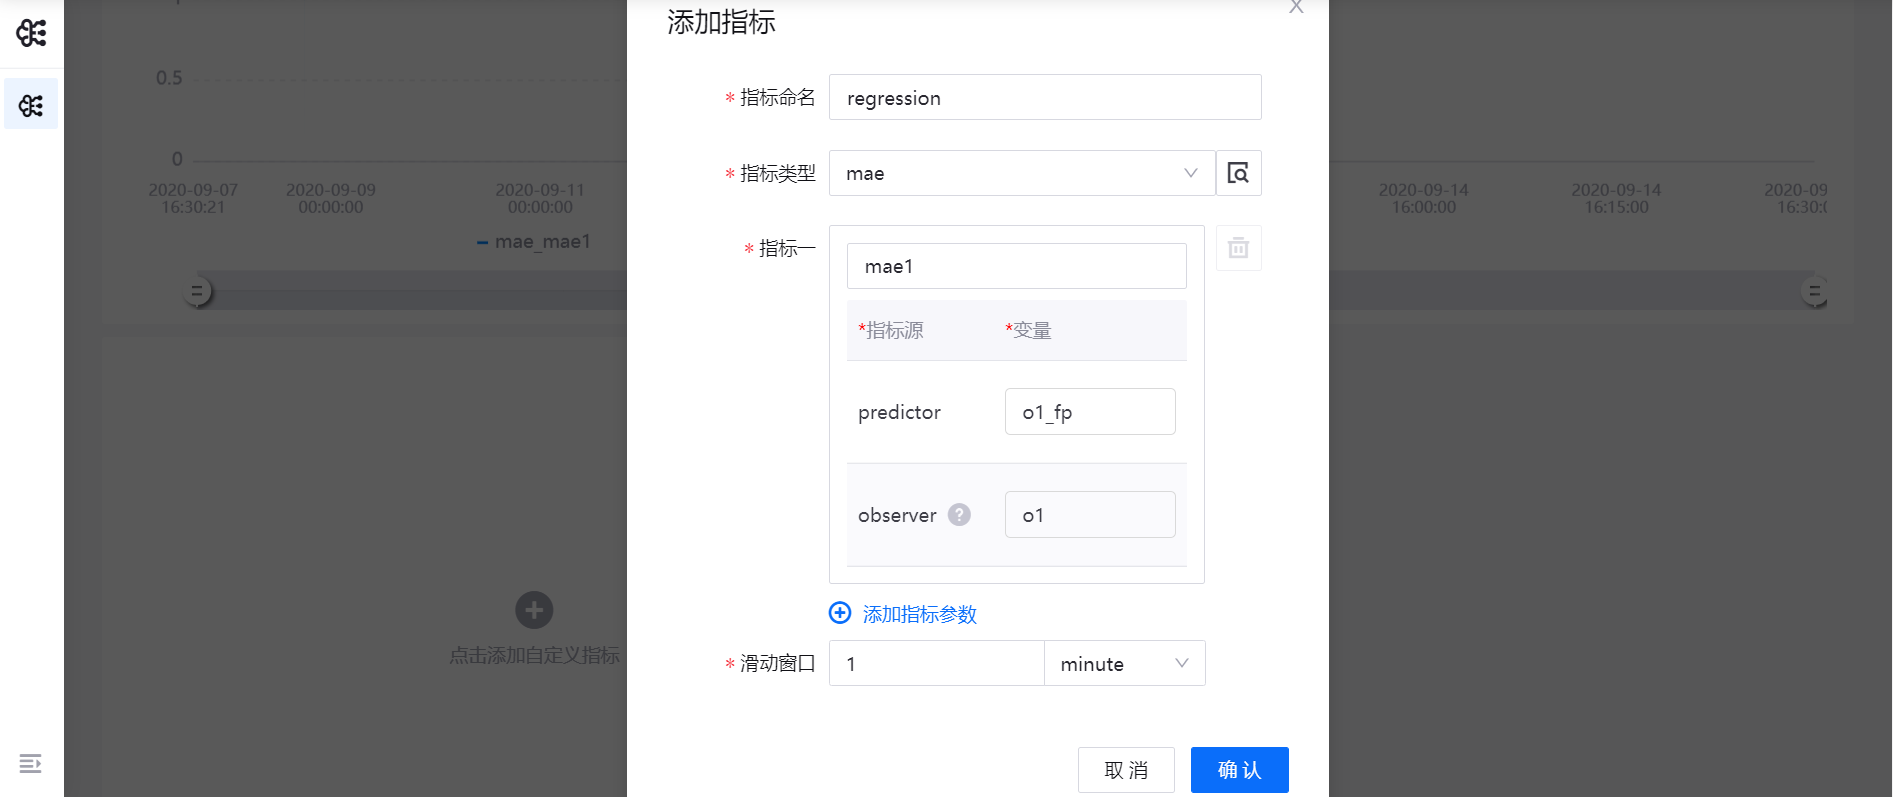
Click OK to add the fitting indicator, and view the indicator line chart.
Classification Indicators
When monitoring the existing model production indicators, the following monitoring indicators can be added to the classification model operator:
Metric name |
Description |
|---|---|
Precision |
Precision rate, which is the ratio of the number of positive cases of correct prediction to the total number of positive cases predicted, TP/(TP+FP) |
Recall |
TP/(TP+FN) |
F1-score |
Weighted harmonic average of precision and recall |
In the Model Indicator Monitoring page, click Add Customized Indicator.
Enter the indicator name in the pop-up window, and select precision / recall / f1score in the Indicator Type dropdown menu.
Specify variable names for
predictorandobserverindicator sources.In the Sliding Window column, specify the window time for monitoring the changes of indicators in the dynamic environment.
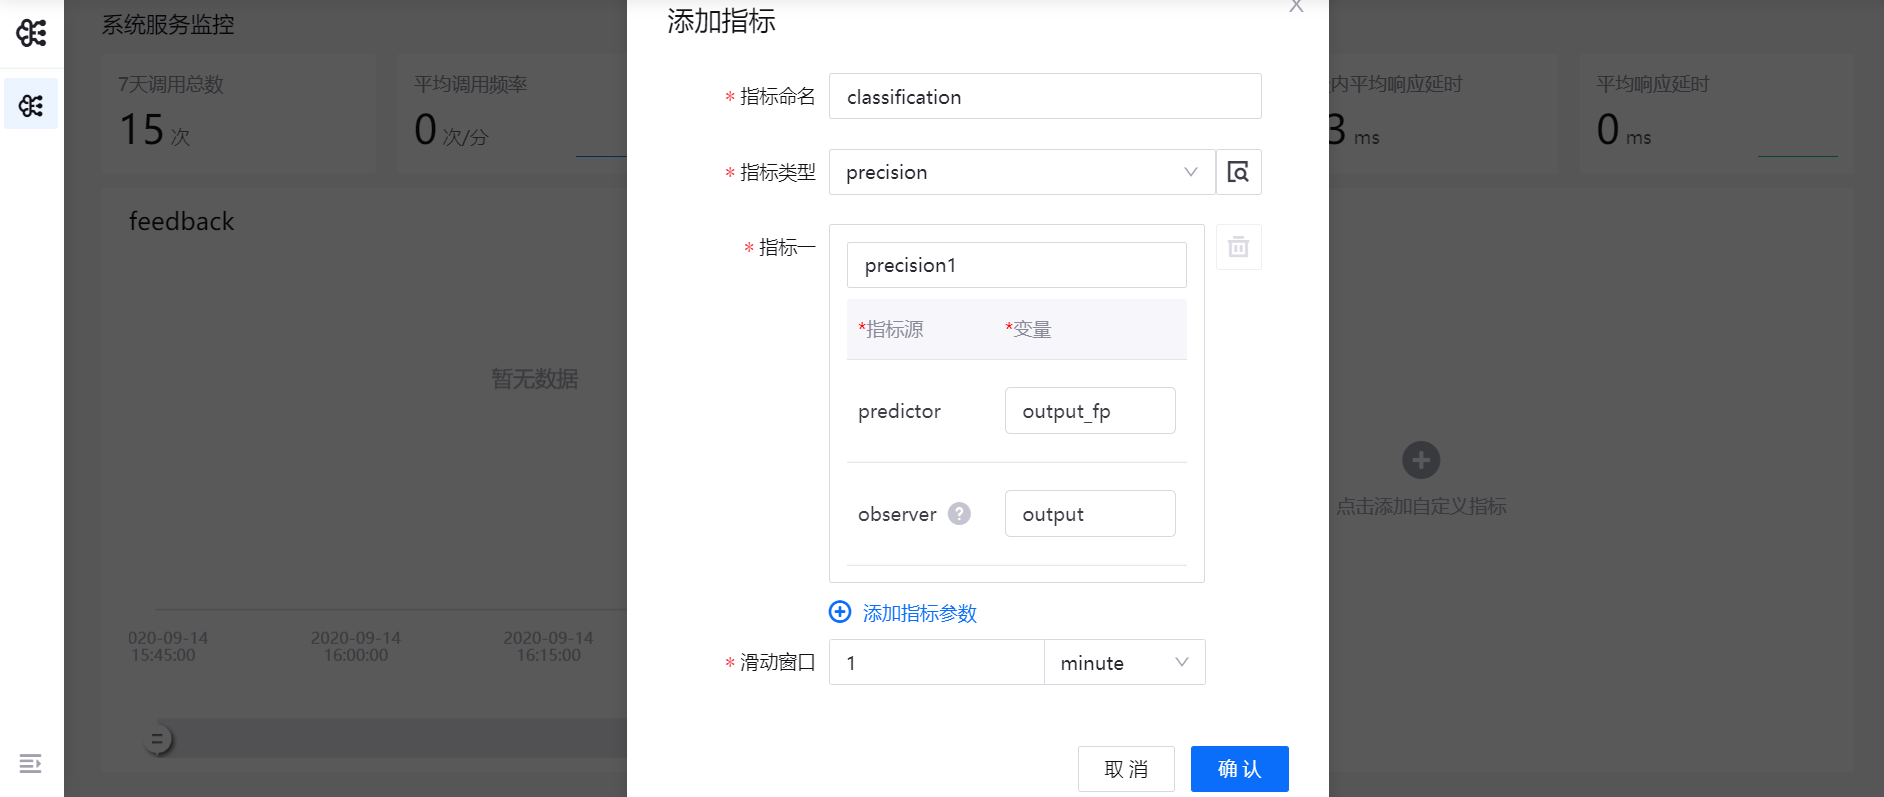
Click OK to add the classification indicator.