Electric Energy Calculation Logic
Electric power calculation is one of the most common calculation scenarios in the energy industry, and the calculation has strict requirements for accuracy. Therefore, processing of abnormal data such as drastic change of electric meter data and power data is quite important. EnOS stream processing engine integrates abnormal data processing into the calculation process to ensure the accuracy of the electric energy data.
Sum of Meter Reading Delta
The Electric Energy Calculation by Metering Reading template uses the “Sum of meter reading delta” calculation method to calculate daily electric energy data, with the following steps:
- Obtain the electric energy data of each time interval (delta of electric meter readings in the time interval).
- Calculate the daily electric energy data by summing up the delta in all time intervals of the day.
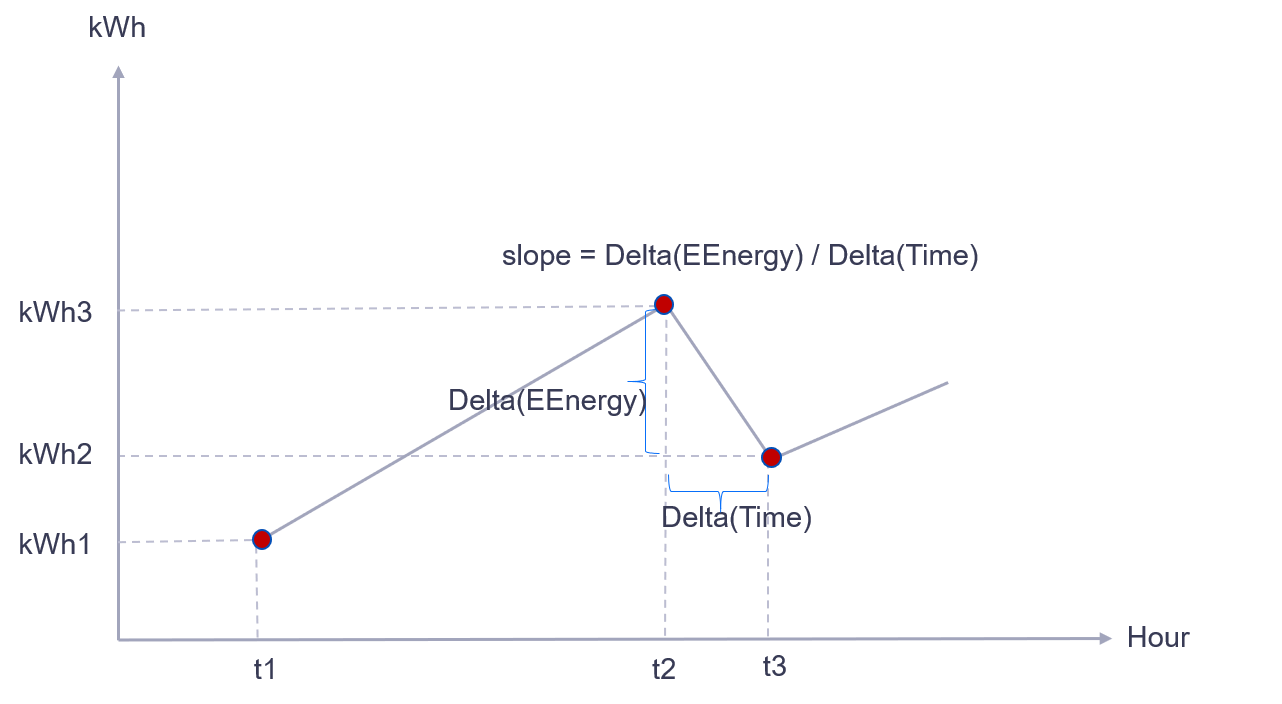
The calculation method is illustrated in the following figure:
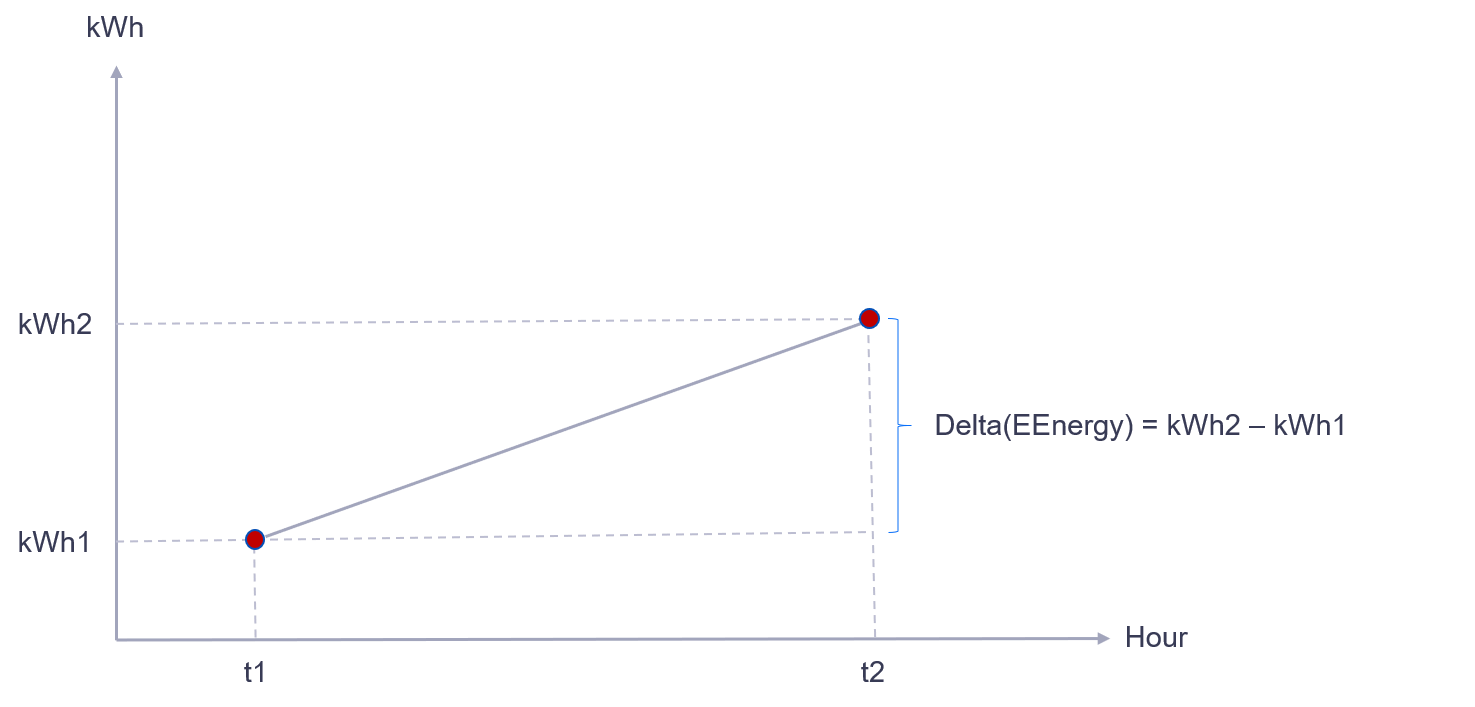
- Input: Electric meter readings (
kWh) - Time interval: The time range from
t1throught2(Hour) - Electric energy data in the time interval:
Delta(EEnergy)=kWh2-kWh1
Calculation Logic
Detailed logic for calculating electric energy data of different situations is as follows:
Data changes in a time interval
Check whether the slope of the time interval falls in the threshold (0,slope_max]:
- If Yes, add the electric energy data of this time interval to the daily value, that is
DailyData=Sum(EEnergy)*scale. The system will record the latest electric meter reading data (kWh) and the end time of the interval (Hour), which will be used as the starting point for the slope of the next time interval. - If No, the electric energy data of this time interval will not be added to the daily value. The system will also record the latest electric meter reading data (kWh) and the end time of the interval (Hour), which will be used as the starting point for the slope of the next time interval.
Data does not change in a time interval
In the time interval, the electric meter reading does not change. The system does not record the end time of the interval. See the following figure:
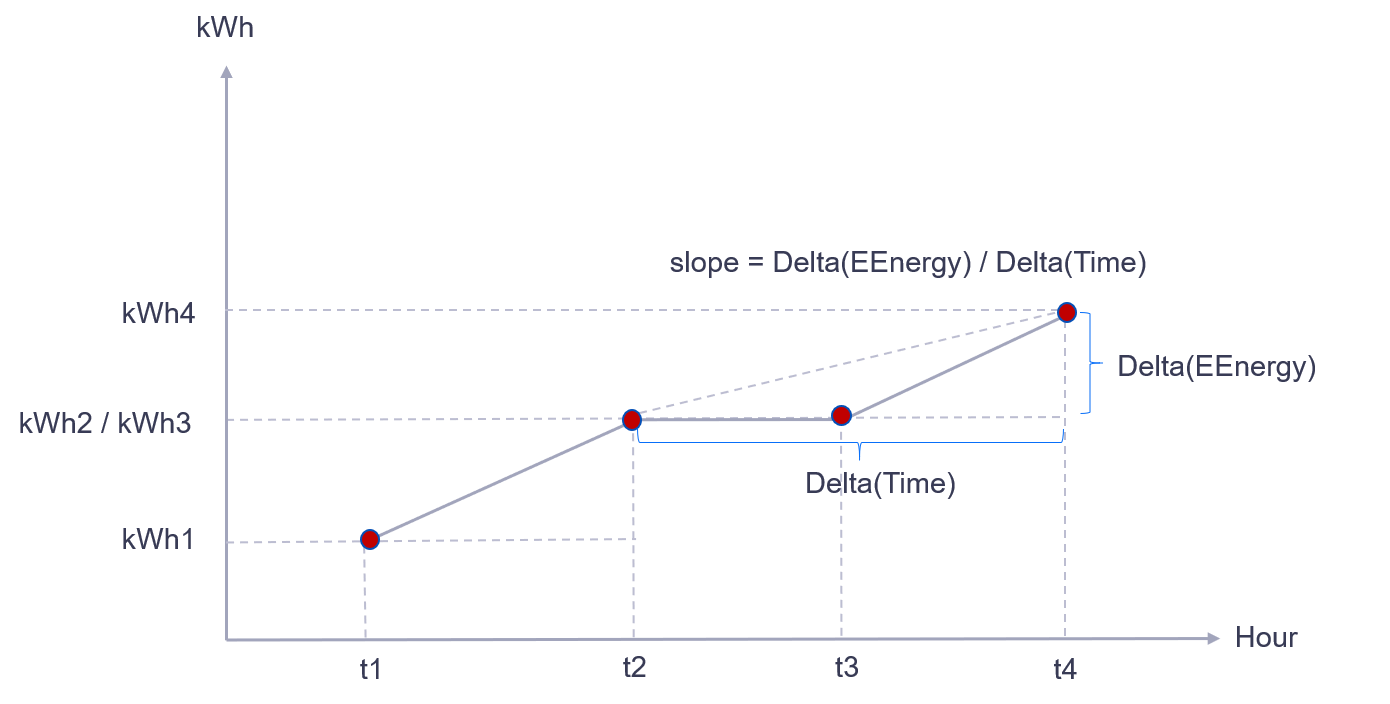
As the figure shows, the electric meter reading does not change from t2 through t3. When new data arrives at t4, the time interval for calculation of the slope and electric energy data is from t2 through t4.
Calculation across 0’clock
Generally, the uploaded electric meter reading will be crossing 00:00. As shown in the following figure, this time interval crosses 00:00.
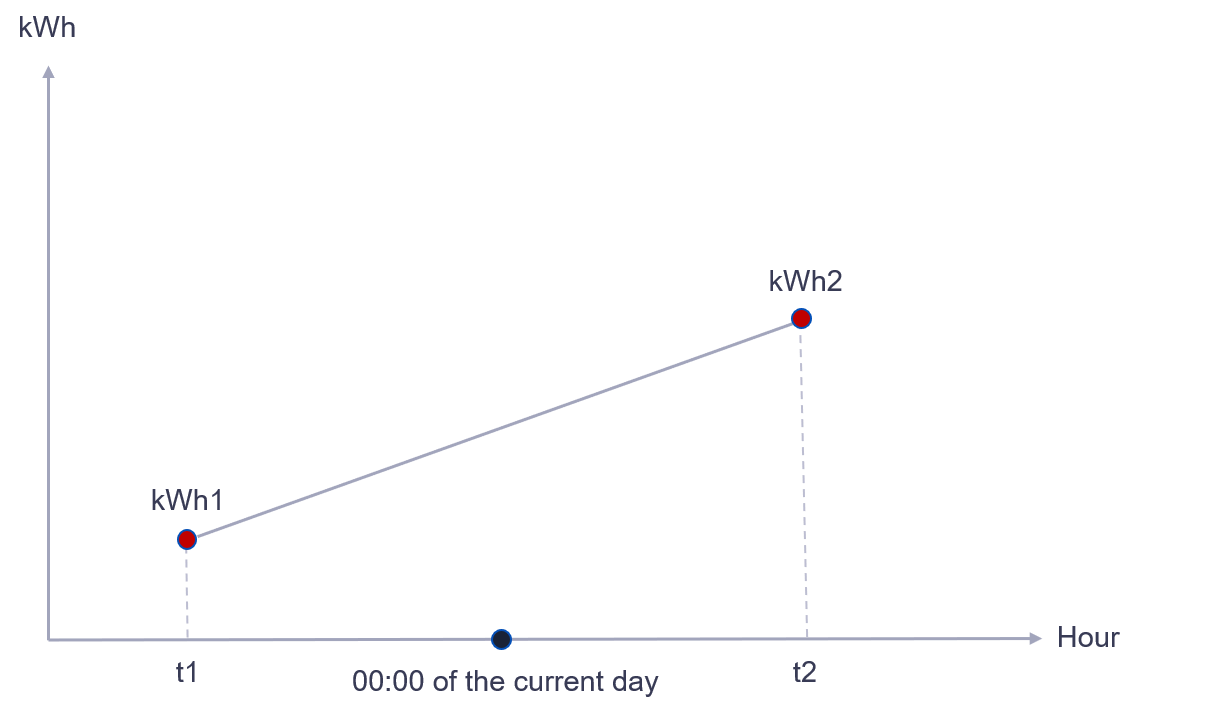
Therefore, the electric energy data calculation of the previous day ends at t1, and the data calculation for the current day starts from t1.
Constant Parameters
In electric energy calculation, the following constant parameters are determined by business and devices:
- Electric meter accuracy (digits)
- Slope threshold
- Electric meter scale
- Electric energy unit (kWh)
Processing of Abnormal Data
In the chart of electric energy data, the slope of the curve in a time interval can be used to filter out abnormal data. Different electric meters allow different slope values. For example, (0, max] indicates that if the slope of a time interval falls in the range of 0 - max, the electric meter reading data of the time interval is valid. Invalid data will not be added to the total electric energy data.
The calculation method of the slope is: slope=Delta(EEnergy)/Delta(Time)
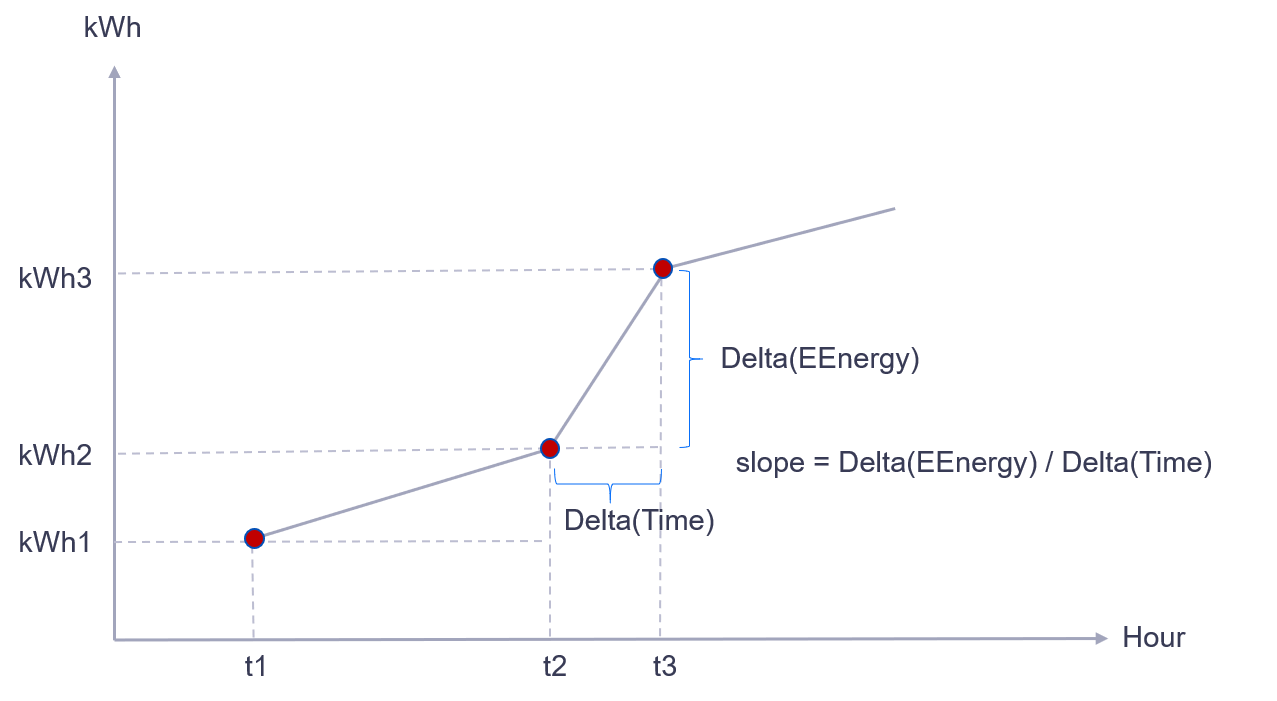
If the slope exceeds a certain range, it may be caused by drastic change of electric meter data or by negative electric energy data (an extreme case is that the electric meter reading is reset to zero). This will break the monotonous increasing law of the chart curve. See the following figure:
Integral by Power
The Electric Power Calculation by Power templates uses the “Integral by instant / average power” (with the unit of kW or W) calculation method to calculate daily electric energy data, with the following calculation logic:
- Input: Power data ingested from a measuring point (
kWorW) - Time interval: The time range from
t1throught2(Hour) - Electric energy data in the time interval:
EEnergy=ActivePower*Time
The power data can be instant power data at a time point or average power data in a time interval.
Calculation Logic
The calculation logic for different power data types are as follows:
By instant power data
In a time interval, the measuring point ingests the instant power data at a time point. For example, the power data for the past 3 minutes is the instant power value at P1, as shown in the following figure:
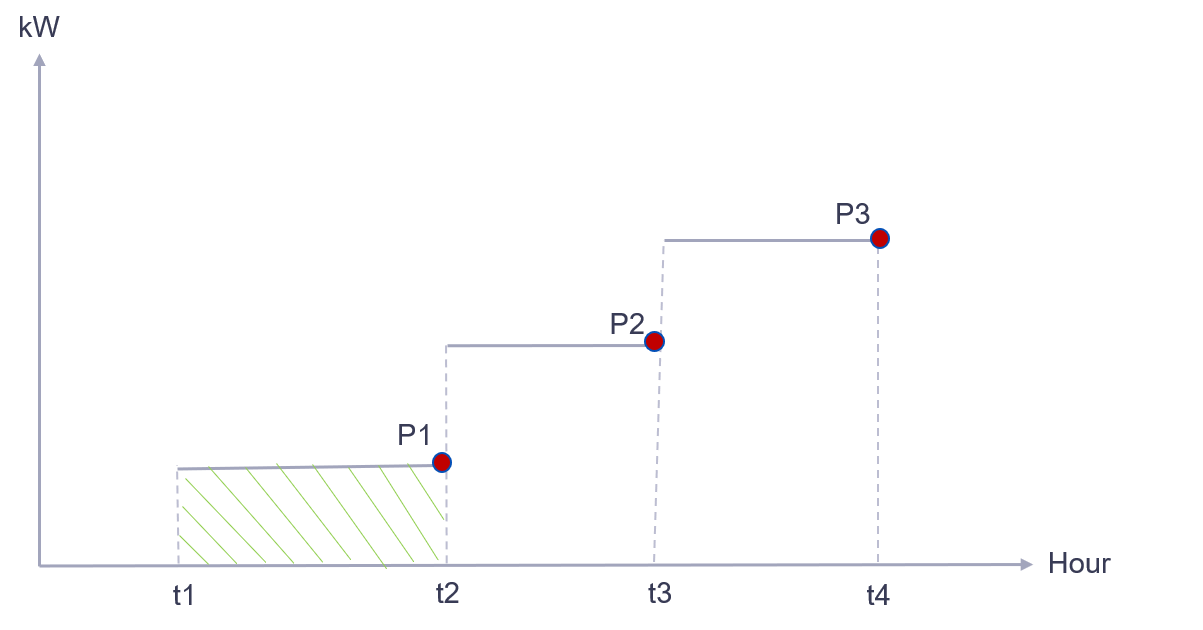
Electric energy data for time interval t1 through t2 is: EEnergy=P1*(t2-t1)。
By average power data
In a time interval, the measuring point ingests the average power data. For example, the average power value for the past 3 minutes, as shown in the following figure:
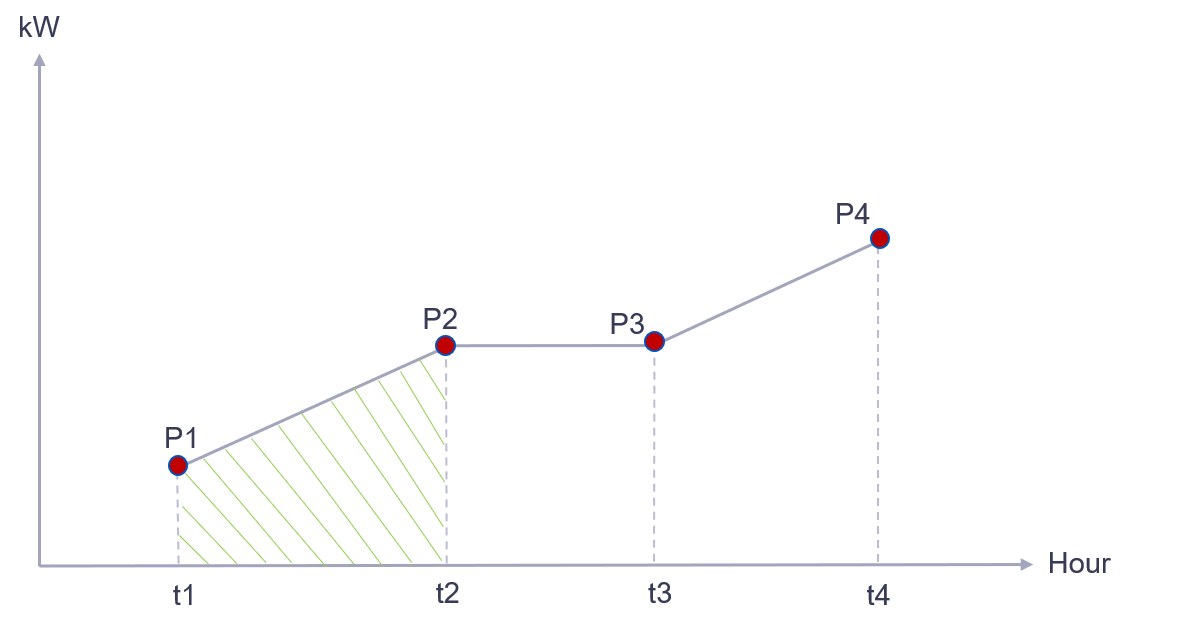
For easier calculation, we use the simple arithmetic average value of P1 and P2 to calculate electric energy, as shown in the figure below:
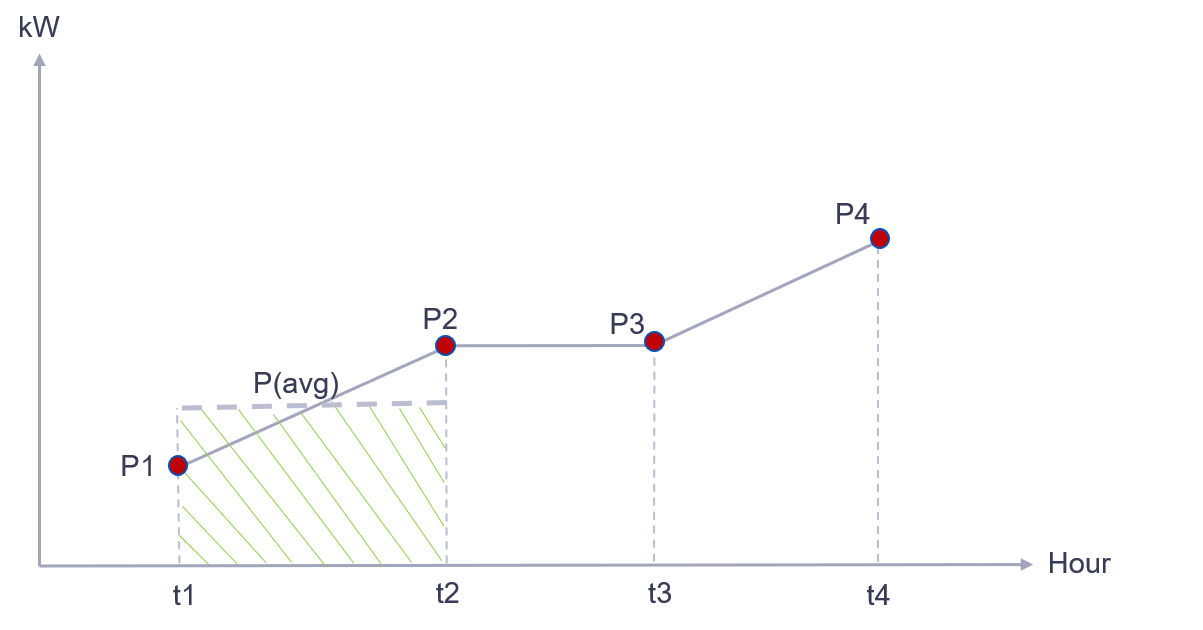
Electric energy data for time interval t1 through t2 is: EEnergy=(P1+P2)/2*(t2-t1)。
Processing of Abnormal Data
In actual situations, data might be lost, exceeding threshold, or duplicated:
- Data loss, but the data uploading frequency can be estimated
- Data exceeding threshold, or changing rate exceeding limit
- Duplicated data (time stamp and point value are both duplicated)
For the above abnormal situations, data needs to be processed to ensure that there is no big deviation in the electric energy calculation result.
Because the power data is of AI type, we can process the data first by the following procedure, and then calculate electric energy data (an extra measuring point is needed to receive the normalized power data):