Unit 6: Calculating the Memory Usage Percentage
With the total memory and used memory data ingested, we can now develop a stream data processing job to calculate the real-time usage percentage of the PC memory.
The EnOS Stream Analytics provides a Multi-Point Merging template that supports calculations between multiple measurement points and attributes.
Step 1. Creating a stream data processing job
Log in to the EnOS Management Console and click Stream Processing > Stream Development.
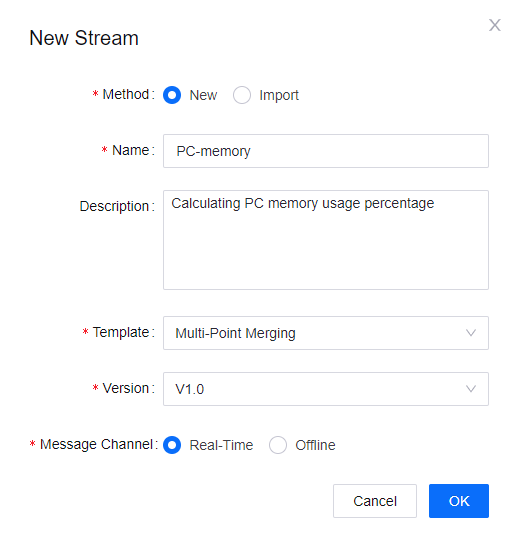
Click the + icon above the stream processing job list to open the New Stream window and fill in the following.
Method: Select New.
Name: Enter a name for the stream data processing job.
Description: Enter a description for the job.
Template: Select Multi-Point Merging.
Version: Select V1.0.
Message Channel: Select Real-Time.
Click OK to save the stream processing job.
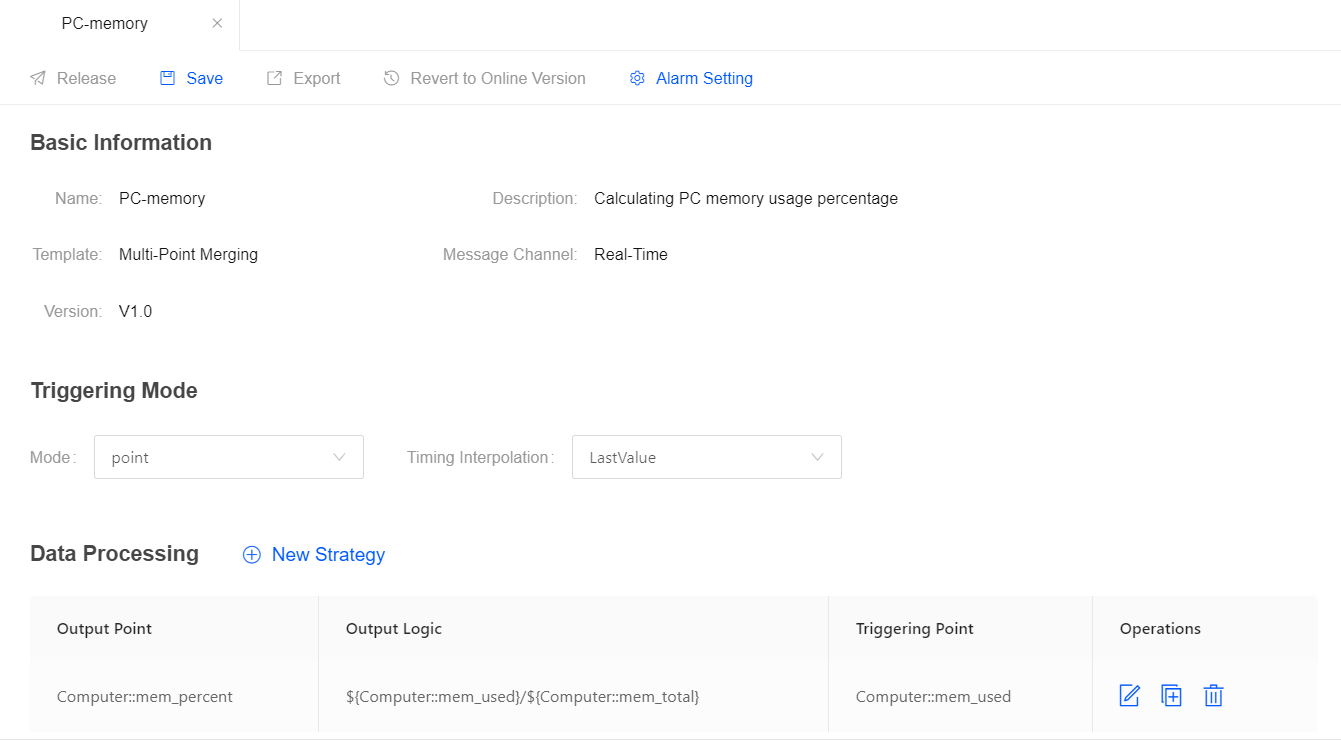
Step 2. Configuring the data processing policy
Configure the Multi-Point Merging template for calculating the memory usage percentage with the following parameters.
Field |
Value |
Description |
|---|---|---|
Triggering Mode |
Point |
The data processing job is triggered by the arrived input data. |
Timing Interpolation |
lastValue |
The interpolation policy. |
Output Point |
Computer::mem_percent |
The measurement point receiving the processed data. |
Triggering Point |
Computer::mem_used |
The measurement point triggering the data processing job. |
Output Logic |
|
The expression for getting the memory usage percentage. |
Step 3. Running the data processing job
After the data processing job configuration is completed, you can publish it online.
Click Save to save the configuration of the data processing job.
Click Release to release the job online.
At the Stream Operation page, find the data processing job that is online, and click the Start icon to start the job.
The data processing job will start running if there is no error.
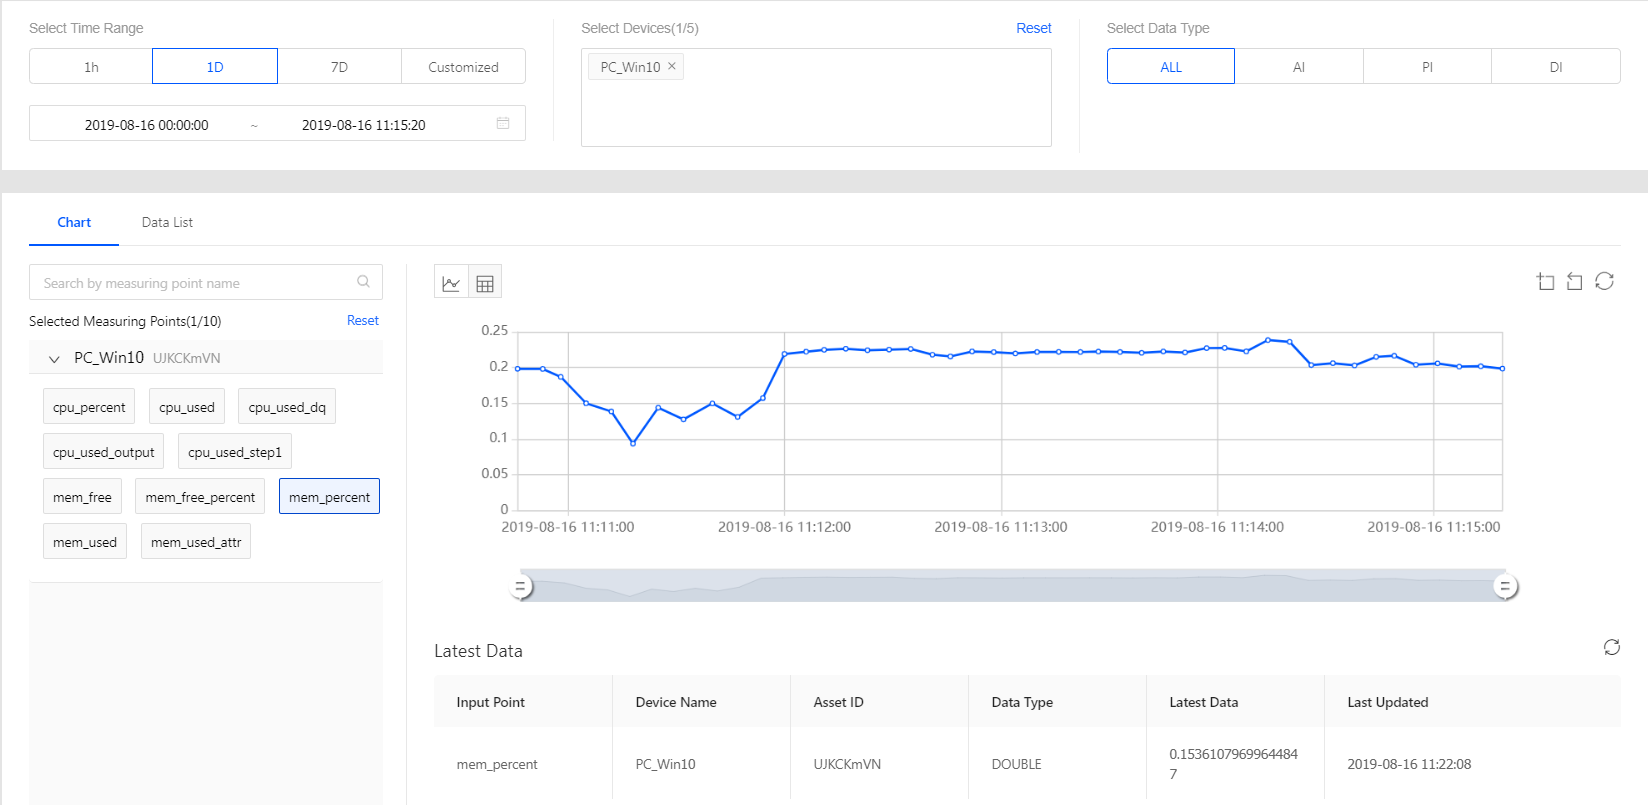
Step 4. Viewing the calculated data
You can view the calculated memory usage percentage data on the Time Series Data Management > Data Insights page.
In the Select Time Range section, select or specify the time range for querying data (for example,
1Dfor the current day).Click the Select Devices input box, and search for and select the
PC_Win10device.In the Select Data Type section, select ALL.
In the Selected Measuring Points column, click on the selected device name, expand the list of measurement points, and select the
mem_percentmeasurement point.The memory usage percentage data is shown in the chart.