Unit 6: Calculating the Memory Usage Percentage
With the total memory and used memory data ingested, we can now develop a stream data processing job to calculate the real-time usage percentage of the PC memory.
The EnOS Stream Processing service provides a set of underlying packaged operators for developing customized stream data processing jobs. In this tutorial, to help you quickly develop a stream data processing pipeline with operators, we provide a ready-to-use configuration file. You can quickly create and configure a stream processing pipeline by importing the configuration file (click Download Configuration File).
Step 1. Creating a Stream Data Processing Job
Log in to the EnOS Management Console and click Stream Processing > Pipeline Designer.
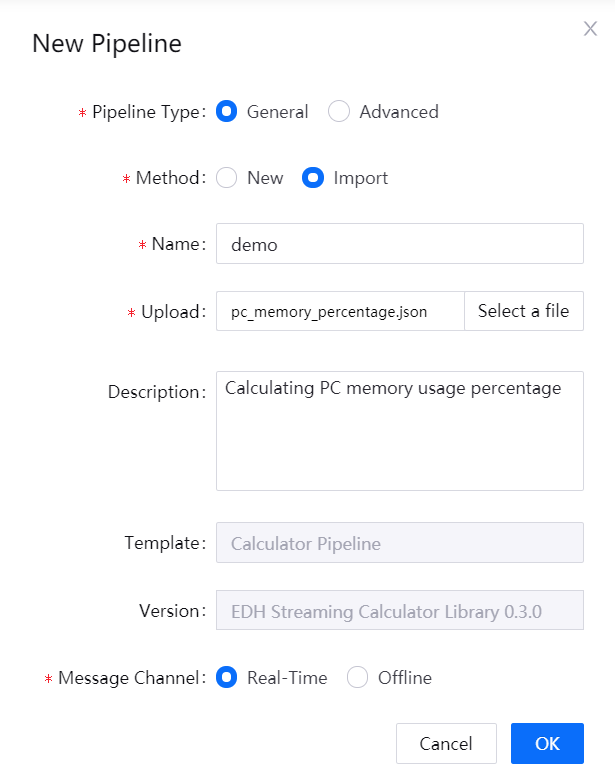
Click the + icon above the stream processing job list to open the New Pipeline window and fill in the following.
Pipeline Type: Select General.
Method: Select Import.
Name: Enter a name for the stream data processing job.
Upload: Select and upload the downloaded pipeline configuration file.
Description: Enter a description for the job.
Message Channel: Select Real-Time.
Click OK to save the stream processing job.

Step 2. Updating Operator Configuration
After importing the pipeline configuration file, you need to check the Criteria configuration of the Asset Lookup operator:
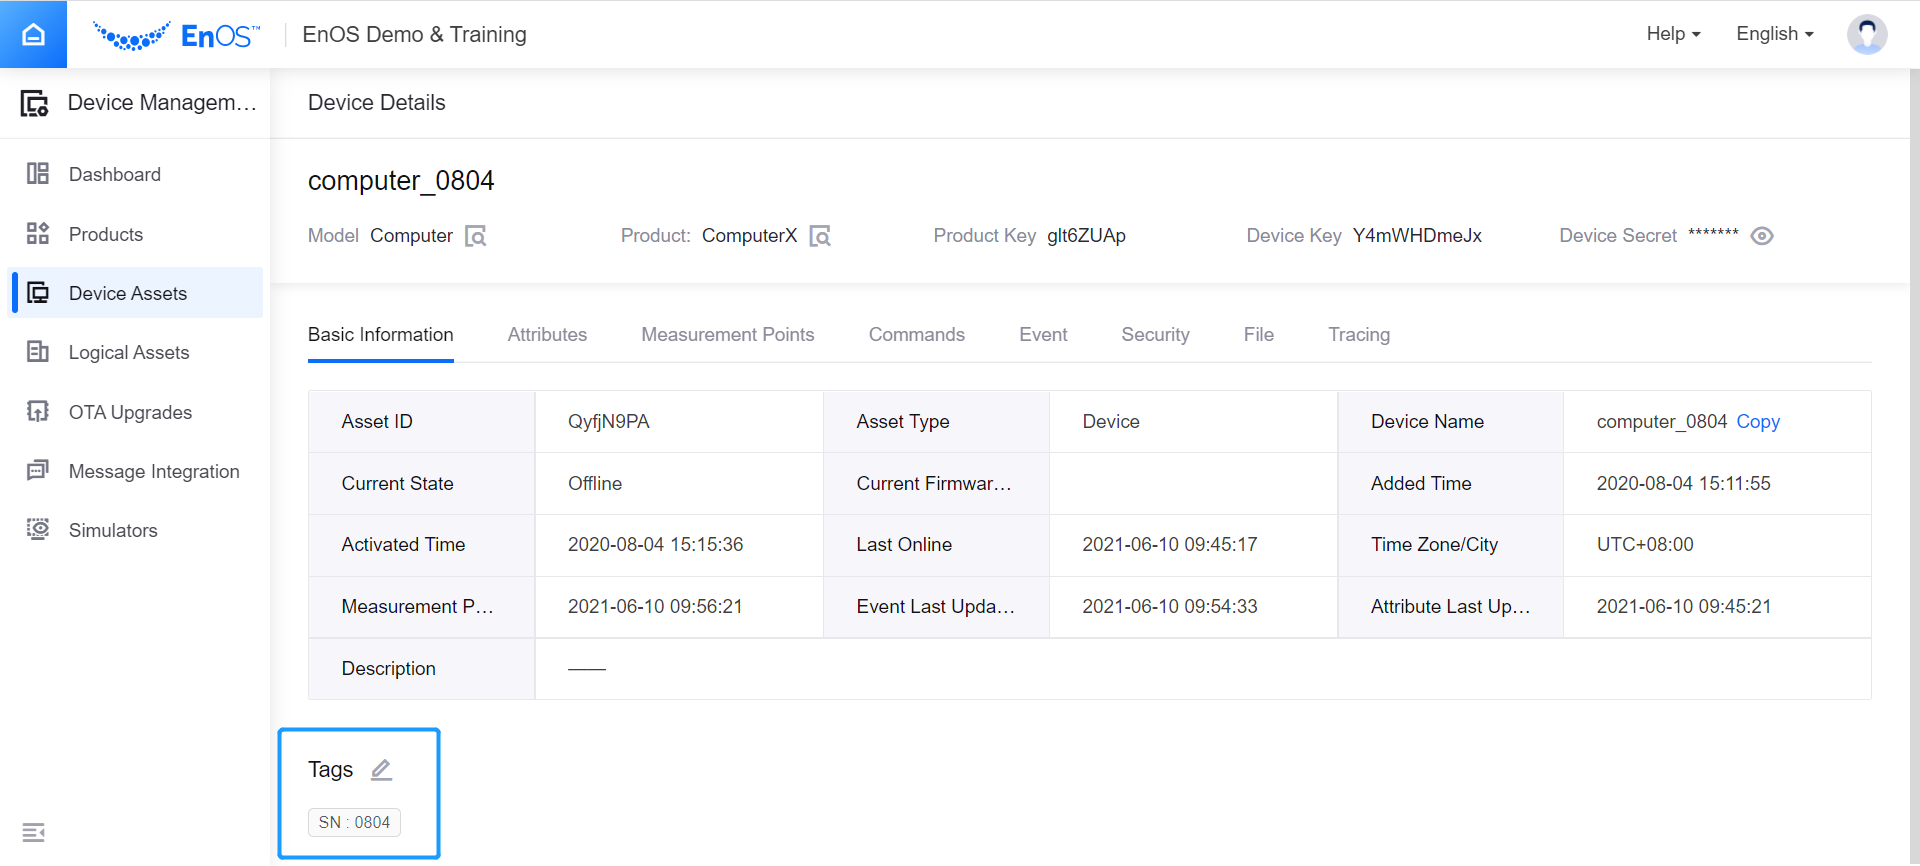
Tag Key: This field supports querying the asset metadata by the asset tag. You need to enter the tag used for the PC device on the Device Details page. See the following example:

For more information about the stream processing operators, see Operator Documentation.
Step 3. Running the Stream Processing Pipeline
After the stream processing pipeline configuration is completed, you can publish it online.
Click Save to save the configuration of the pipeline.
Click Release to release the pipeline online.
On the Pipeline Operation page, find the stream processing pipeline that is online, and click the Start icon to start the job. Note that the system pipelines must be running before starting the pipeline.
The stream processing pipeline will start running if there is no error.
Step 4. Viewing the Calculated Data
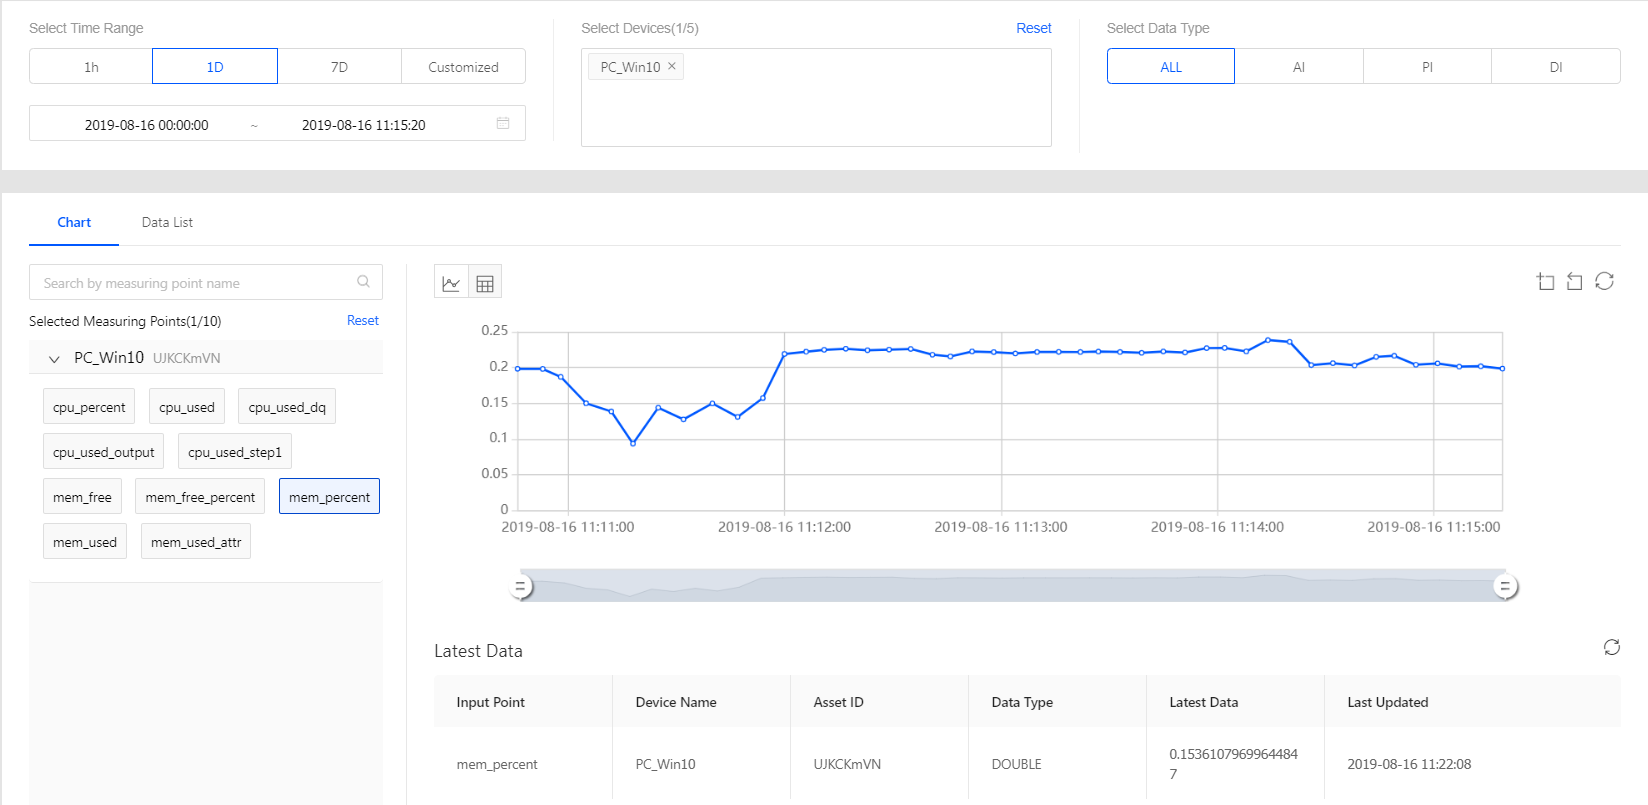
You can view the calculated memory usage percentage data on the Time Series Data Management > Data Insights page.
In the Select Time Range section, select or specify the time range for querying data (for example,
1Dfor the current day).Click the Select Devices input box, and search for the PC device name.
In the Select Data Type section, select ALL.
In the Selected Measuring Points column, click on the selected device name, expand the list of measurement points, and select the
mem_percentmeasurement point.The memory usage percentage data is shown in the chart.
