Exploring Digital Twin Monitoring (DTM)
This article describes the main elements of DTM.
Monitoring Editor
The following figure shows the page of the monitoring editor.
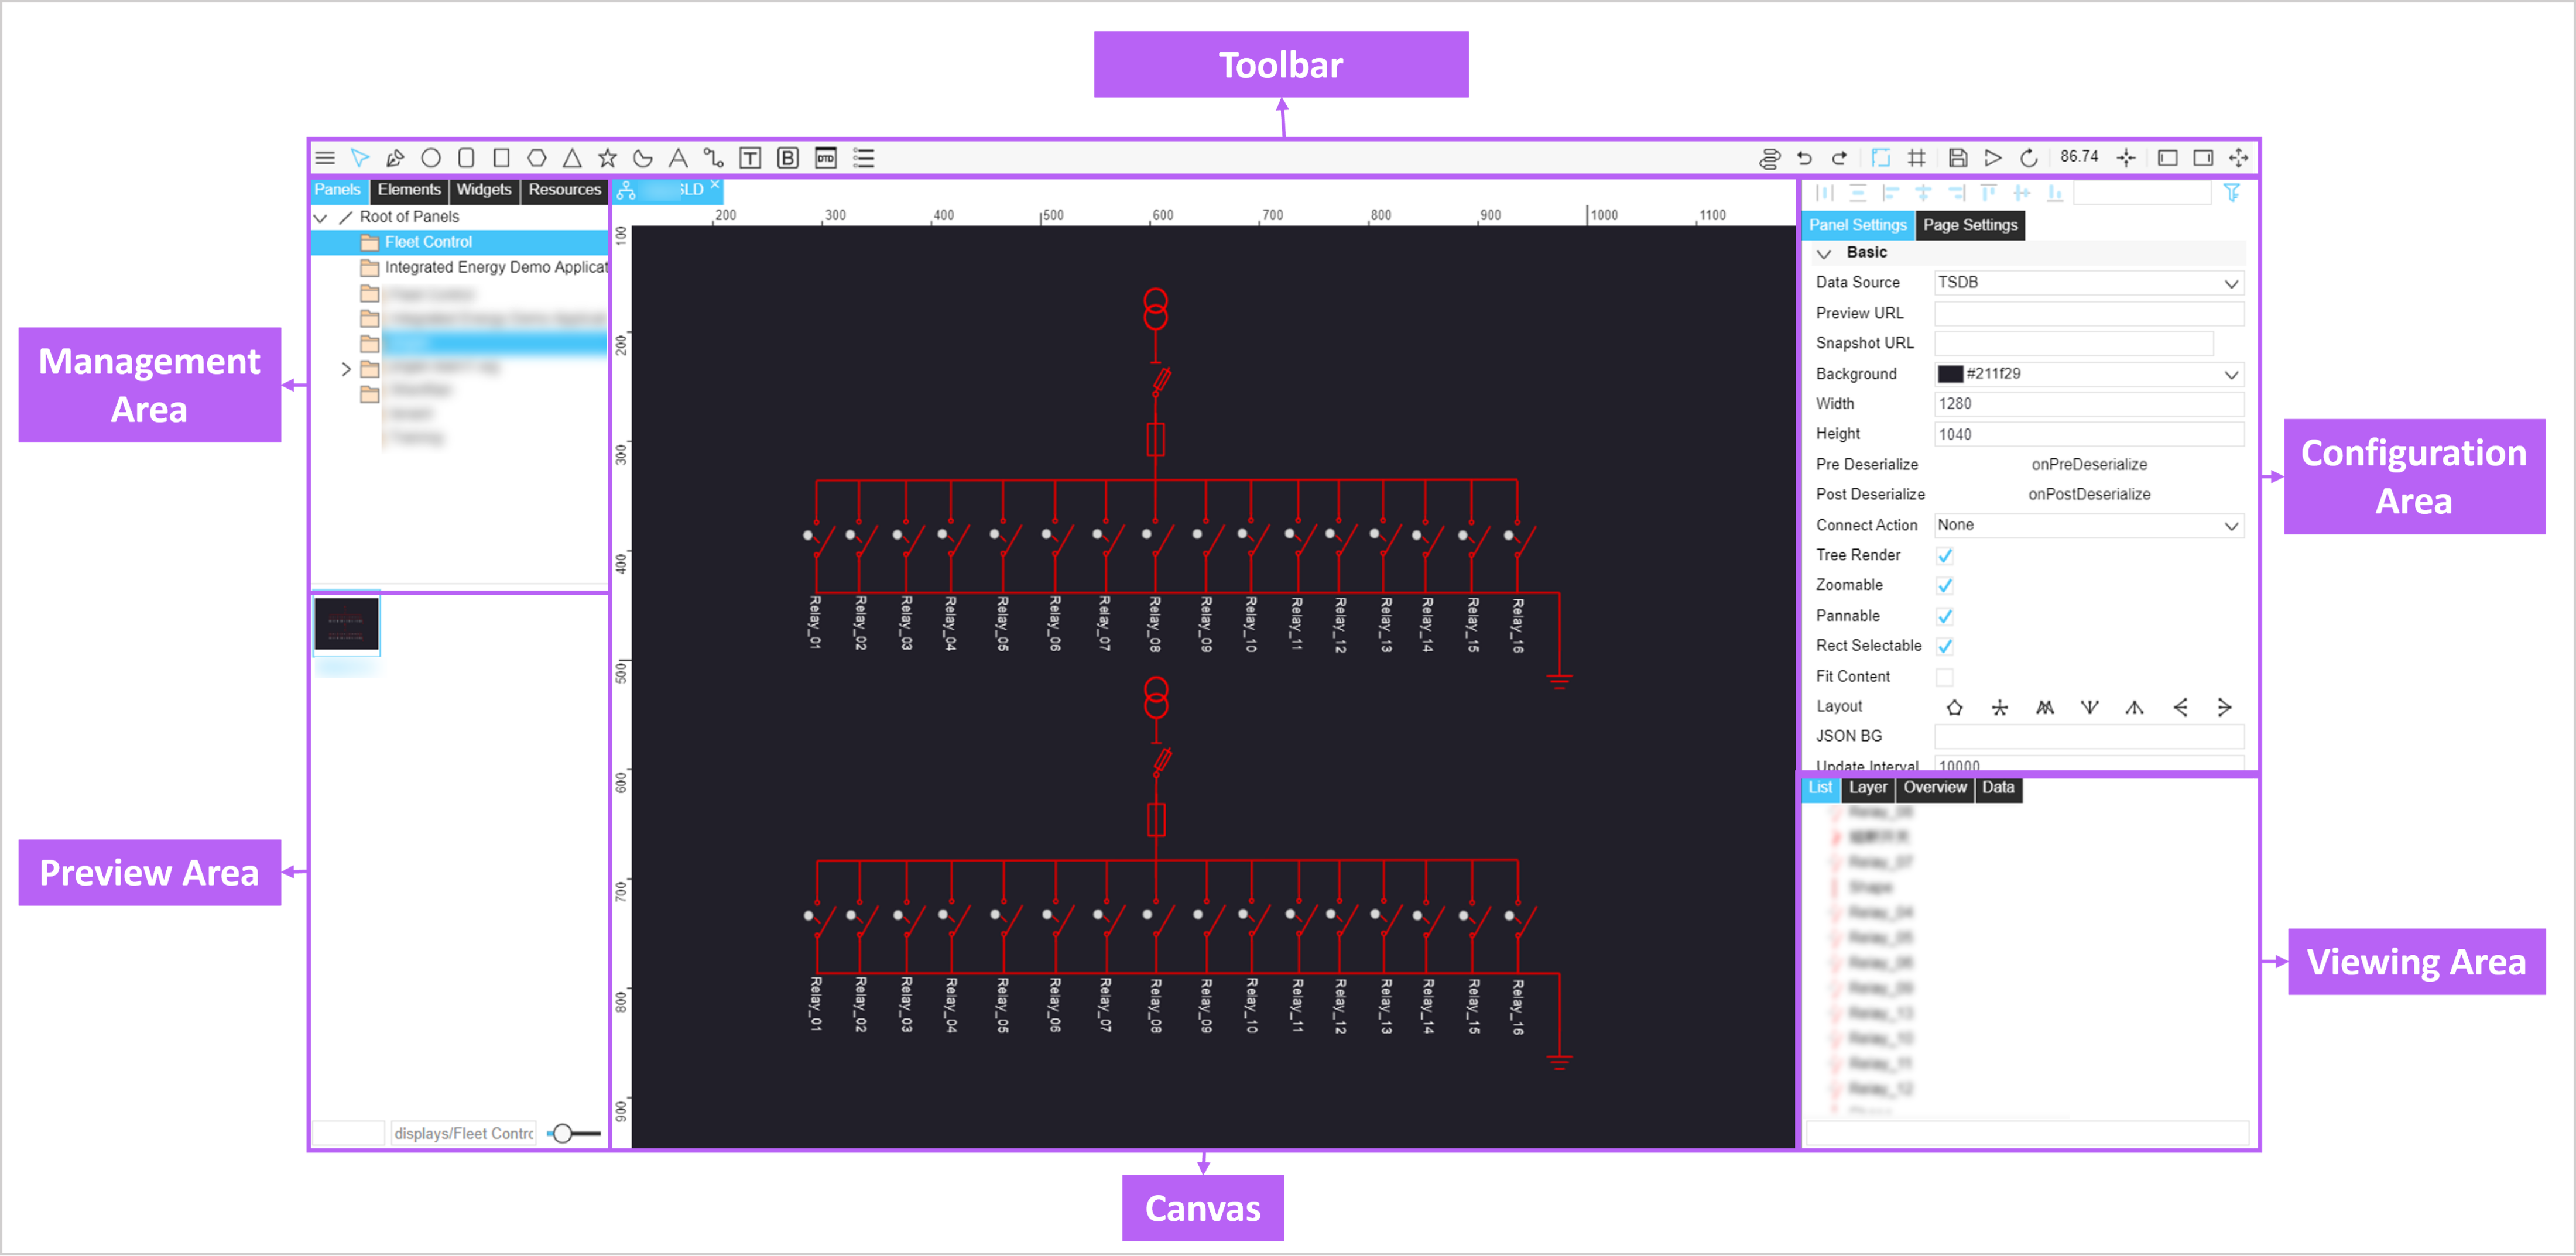
The names and functions of each area of the editor are described as follows.
| Component | Description |
|---|---|
| Toolbar | Include graphic drawing tools and page editing tools. |
| Management Area | Display and manage the directory where panels, elements, widgets, and resources are stored. |
| Preview Area | Display a preview view of the panels, elements, widgets, and resources in the management area. |
| Canvas | drawing panels or elements. |
| Configuration Area | Configure the properties of panels and elements and make data binding. |
| Viewing Area |
|
Toolbar
When editing a drawing or element, you can quickly draw a panel with the graphics tools in the toolbar or change the page state with the page editing tools.
Graphics Tools
The graphics tool in the toolbar is shown below.

Element Graphics Tools

The table below explains the functions of each button.
| Button | Description |
|---|---|
 |
Edit mode. |
 |
Draw irregular shapes. |
 |
Draw ellipses, rounded rectangles, rectangular bodies, orthogonal polygons, triangular bodies, star bodies, and circular arcs. |
 |
Add text. |
 |
Draw the border. |
 |
Draw pie charts, single-dimensional bar charts, bar charts, and line charts. Available only when drawing elements. |
 |
Connects the center of the elements. Available only when drawing panels. |
 |
Provides controls such as Textbox input and buttons to control the asset. |
 |
Add a DTD page and enable sending parameters to the DTD page. |
 |
Add an alarm list of assets. You can acknowledge alarms directly on the DTM page or enter the alarm console directly to operate. |
Page Editing Tools
The page editing tool in the toolbar is shown below.

The table below explains the functions of each button.
| Button | Description |
|---|---|
 |
Bind assets to the panel. |
 |
Undo/redo. |
 |
Toggle/hide the rulers. |
 |
Toggle/hide the grid. |
 |
Save the page. |
 |
Preview the page. |
 |
Reload. |
 |
Current page zoom scale. Drag the numbers left and right to adjust the scale. |
 |
Zoom to full screen. |
 |
Hide/Show the left toolbar. |
 |
Hide/Show the right toolbar. |
 |
Enable/disable full-screen mode. |
Element Editing Tools
The element editing tool in the toolbar is shown below.

The table below explains the functions of each button.
| Button | Description |
|---|---|
 |
Horizontal/vertical distribution, available only when three or more elements are selected. |
 |
Alignment, available only when two or more elements are selected. |
 |
Search for element configuration. |
 |
Hide/Show advanced configuration. |