Key Concepts
The user and permission system of EnOS Digital Twin Visualization is inherited from EnOS Application Portal. Before you start, you need to learn about the Key Concepts of EnOS Application Portal.
Below are the key concepts of DTV.
Common Concept
This section introduces the common key concepts of Dashboards and DTMs.
Data Source
DTV supports multiple data sources such as a database, an uploaded CSV file, measurement point data from physical devices, or time series data from stream processing engines. For more information, see Data Sources.
Key Concepts of Dashboards
This section introduces the key concepts of Dashboard.
Data Fields
In DTV, you can assign your data fields to a particular data type, which will affect how your data is displayed on widgets.
Measurements are quantitative data fields that you can measure, usually containing numeric values that could be aggregated.
Dimensions are quantitative values. Dimensions can be discrete (such as country and name), or continuous (such as time) values. Generally, you can use dimensions for classification.
Comparisons enable you to further differentiate the data into multiple layers so that you can compare many sets of data with the same dimension data values.
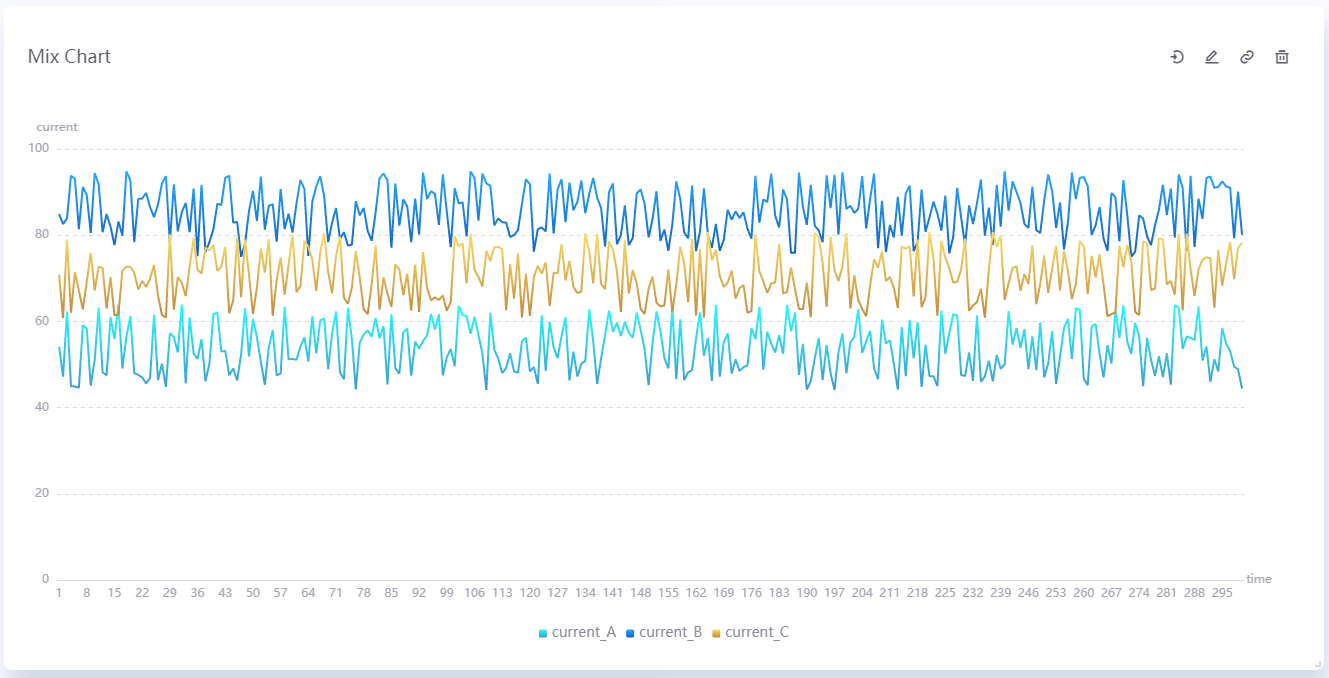
A typical scenario is plotting a trendline. Often, the Dimension field is time. As time passes, one or more variables could be measured. As such, the Measurement fields could be current, voltage, or capacity. If you have multiple devices, you can plot multiple charts on the same widget by setting device_name as the Comparison field, for example.
The graph below plots electrical current data (Measurement) against time (Dimension), with the type of device as a comparison.
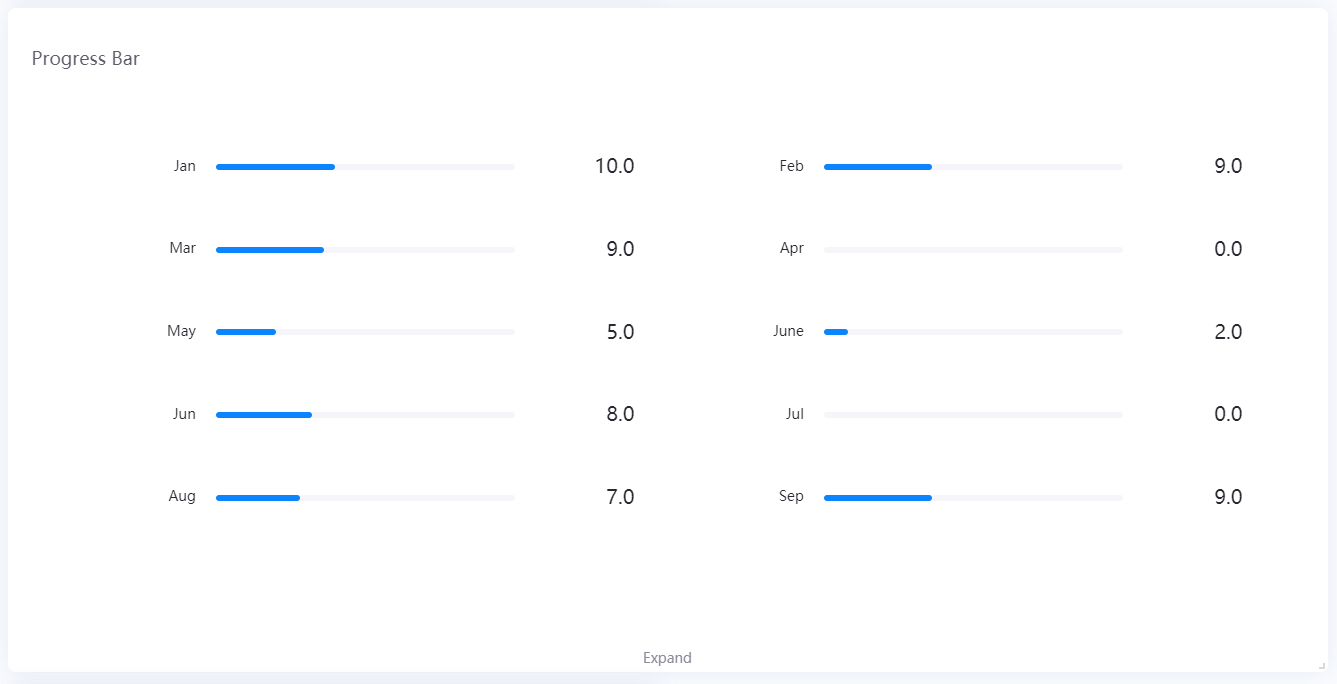
Another scenario is displaying indicators or progressive values. The Measurement fields could be score, progress percentage, and remaining time. Similarly, if you have multiple processes, you can plot their charts by setting process_name as the Comparison field, for example.
A simple rule of thumb is that DTV displays Dimensions as rows/X-axis, Measurements as columns/Y-axis, and Comparisons as multiple charts on the same widget.
Data Aggregation
Aggregation of data, including summation, average, maximum, minimum, etc.
Page
The page is a data visualization page that is formed by arranging multiple charts following certain business logic. It can be used for information display, data analysis, and monitoring and early warning.
Project
The project is used to hold one or more pages.
Container
Containers enable you to group widgets and even organize widgets into tabs. You can use containers when you want to:
Group widgets displaying similar information
Display different types of the widget in the same page area by using tabs
For information, see Grouping Widgets Using Containers.
Filter
Filters can filter data in widgets, containers and pages. The Dashboard has various types of filters:
Global filter: Filters data in all the widgets on the same page
Widget filter: Filters data in multiple linked widgets on the same page
Container filter: Filter data in multiple linked widgets in the same container.
Internal filter: Filters data within a single widget
Widget
The widget consists of a chart that displays the content on the page.
Widget Link
Widget link allows users to select data in one widget and change the display data in other widgets that have been linked. For more information, see Configuring Widget Links.
Widget Template
The widget template is formed by the determined widget types, selected data items, and determined widget configurations, which can be used to quickly create data monitoring and metric pages. For more information, see Widget Template.
Dynamic Unit
Dynamic units shorten long data values by using the most appropriate unit. For example, if the value is 1,000,000 W, it will be converted to 1 MW.
Formatting Rules
Used to set the corresponding color of the widget to be displayed when the measurement data reaches a certain threshold. For example, you can configure the widget to display blue when the measurement value is between 10 and 30, and red when it is between 30 and 50. For more information, see Setting Formatting Rules.
Page Parameters
Use parameters to display dynamic content. Page parameter keys can be used as placeholders and the parameter values will be displayed on the actual page. For more information, see Configuring Page Parameters.
Time Zone Conversion
You can convert time data in the page from one time zone to another by specifying the _tz_ page parameter in the dashboard URL. It enables users to convert the data to their browser time zone, ignore the time zone, or convert to their specified time zone. For more information, see Time Zone.
Key Concepts of DTM
This section introduces the key concepts of DTM.
Panel
The panel is a monitoring page formed according to a certain business logic layout, which can be used for equipment information display and monitoring and alerting. For more information, see Using Panel.
Element
In panels, one or more elements are presented according to business requirements. You can use a currently existing element template or create a new element by yourself. For more information, see Using Element.
Widget
Widgets are the smallest units that make up an element. DTM provides widget types such as basic graphics, textbox, border and basic charts. Users can also customize widgets when these basic widgets cannot meet their needs. For more information, see Using Widget.
Note
Widgets are the smallest units of an element. Widgets can only be added to an element, and cannot be added directly to a panel.