Configuring Service Monitor
This article describes how application developers can create a new Service Monitor configuration that defines the application as a Prometheus monitoring collection target.
Prerequisite
Implemented Business Exporter for the application based on Prometheus SDK
Service has been configured for the application in the cluster, with open accessible ports
Creating Service Monitor
Create a new Service Monitor for the application by following these steps:
In the left navigation bar, select Configuration > Service Monitor.
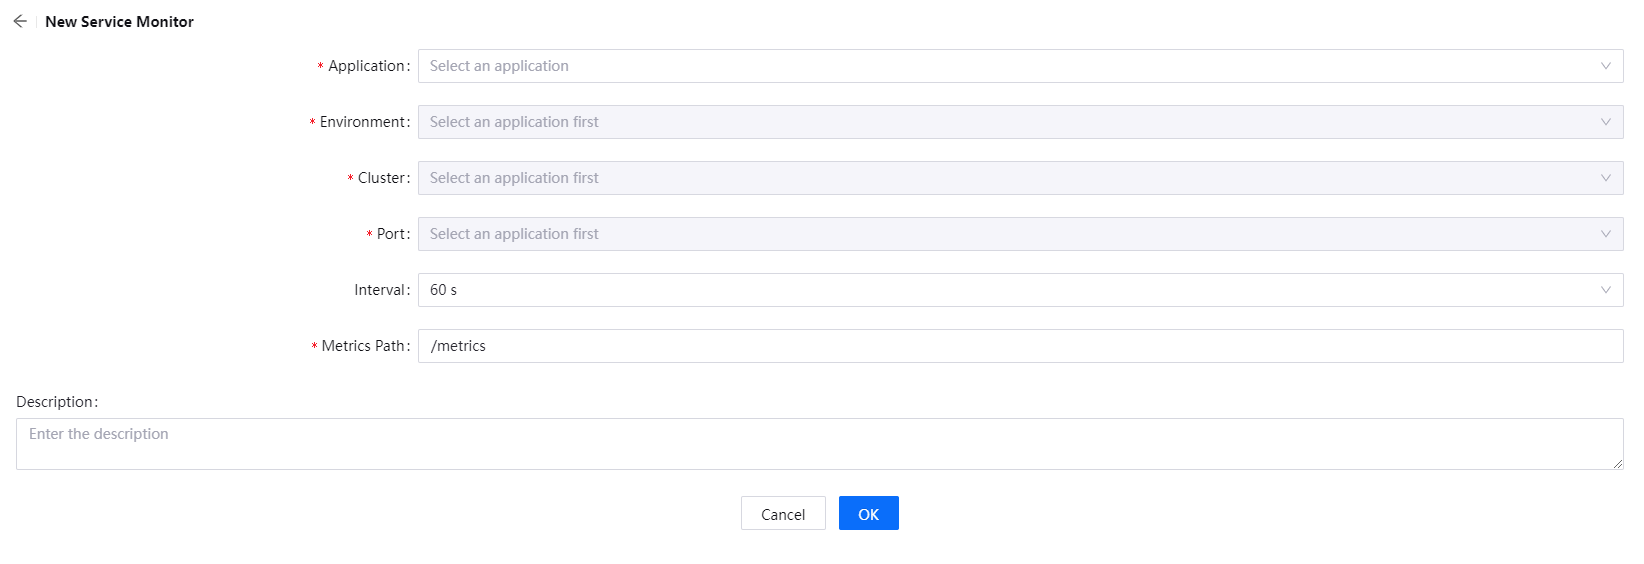
Click New Service Monitor and complete the detailed configuration of Service Monitor.

Name:Enter the name of the Service Monitor
Application Name: Enter the name of the application
Service:Select the Service of the application
Port:Specify the port used by Prometheus to collect Metrics, as defined by the Service configured by the application in the selected cluster
Interval:Prometheus Acquisition Cycle
Metrics Path:Default is /metrics, if you use other paths when accessing, you need to fill in the custom path
Description:Enter the information describing Service Monitor
Click OK to complete the Service Monitor configuration.
Next Step
After the Service Monitor configuration is created, you can clone, edit, and delete the Service Monitor. For details, see Configuring Deployment.