Metering Details
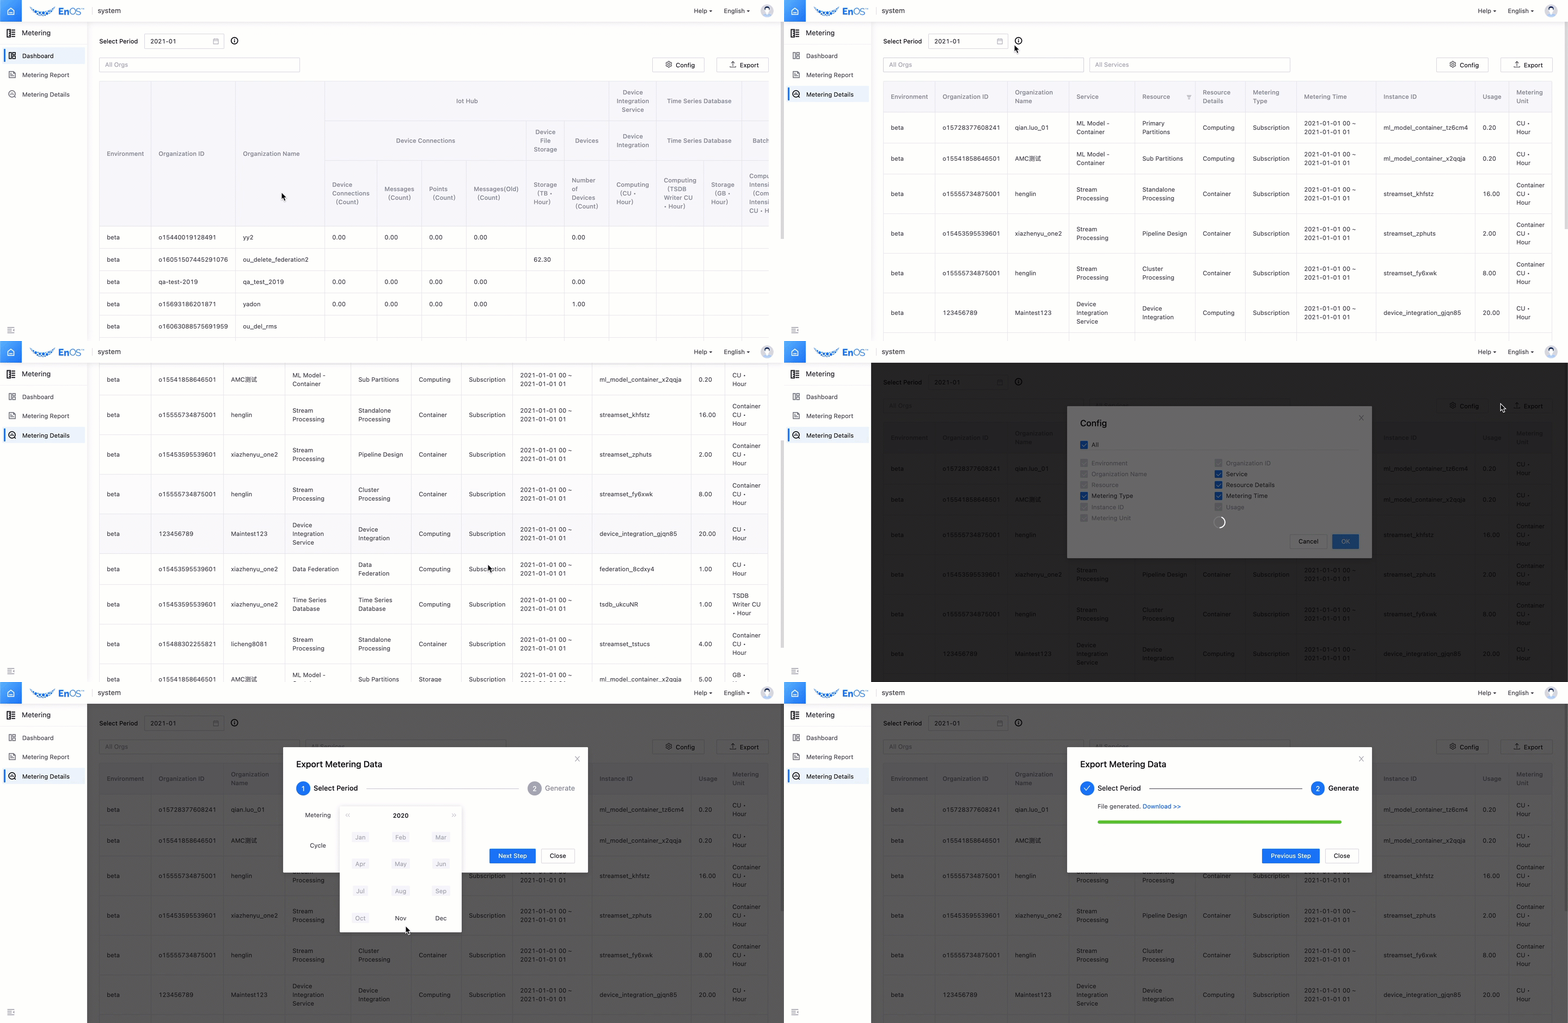
The metering details can provide operators with all the detailed data in the last three months. The operators can view the corresponding metering details by directly clicking the consumption information in the metering report, and can troubleshoot problems based on the metering data that is accurate to the instance ID and hour level.
The metering data saved at the highest granularity in the process of statistical metering data collection is generally accurate to the hour and instance level, and can be used for reconciliation and auditing.
Audience
System administrator
Before You Start
You should have an EnOS system administrator account and have all operation permissions for message push management. See Policies, Roles, and Permissions.
Operations
Select Metering > Metering Details in the EnOS Management Console.

Filter Conditions
Metering cycle (to be calculated on the basis of the local time zone where the platform service is provided): Select a year and month from Select Period to display the monthly data in the selected time range.
OUs: You can select one or multiple OUs in the current time zone. The data for all OUs are displayed by default.
Services: Select one or multiple services that can access the metering function in EnOS. All services are selected by default.
Metrics: Click the Config button to select metrics such as Service, Metering Time, etc. All metrics are selected by default.
Export
In the EnOS Management Console, select Metering > Dashboard, click the Export button, and then select the metering cycle in months to export the statistical metering data for the currently selected filter conditions.