Viewing Dashboard
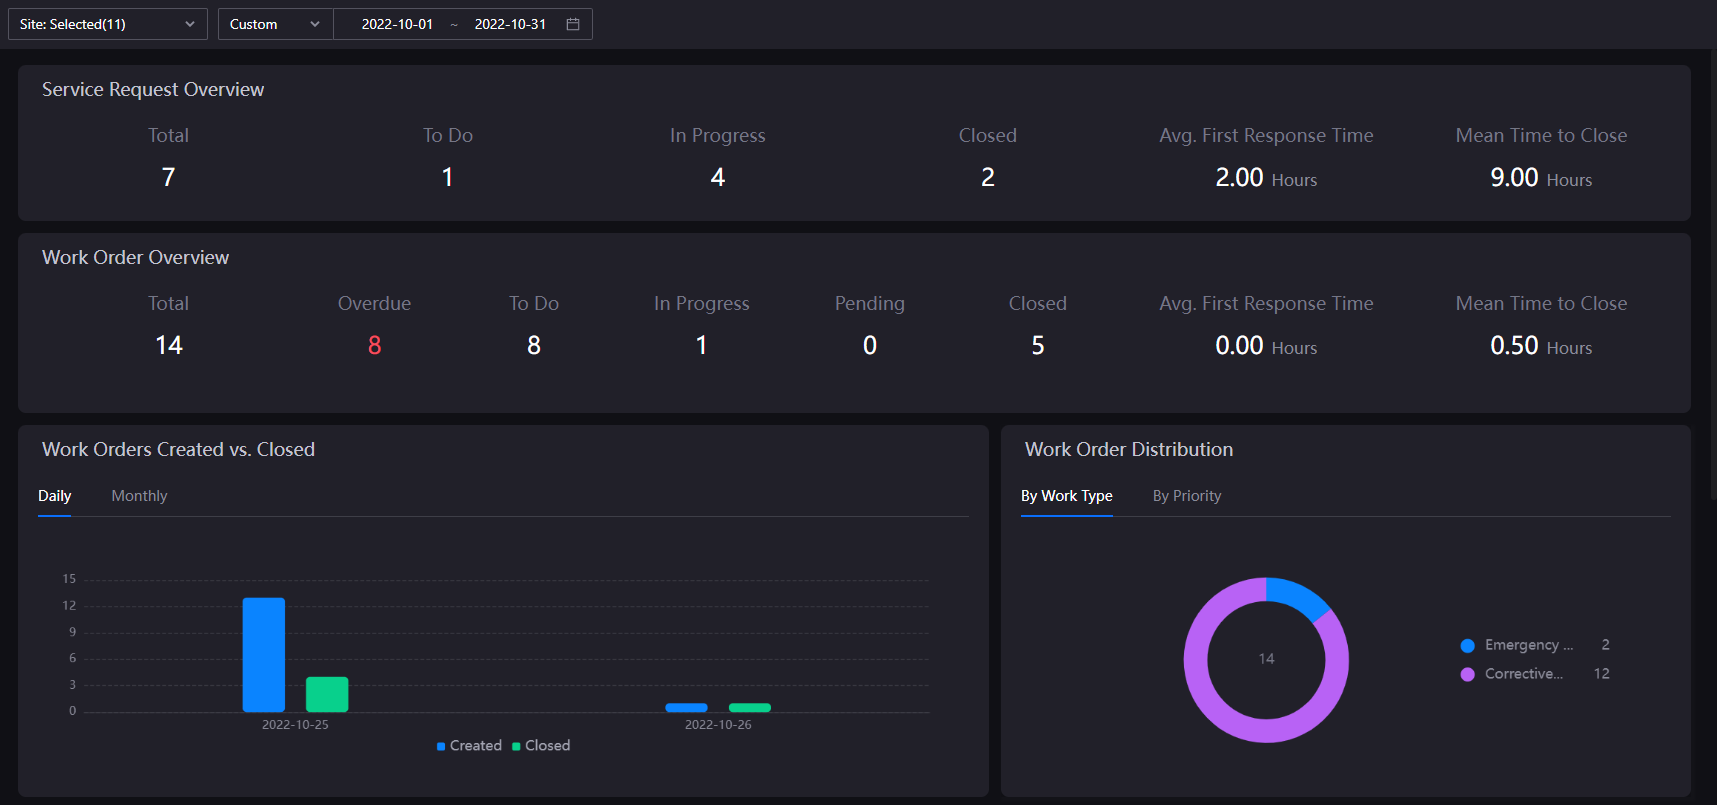
In the work dashboard, managers can view multiple data metrics about service requests and work orders to learn about the overall work situation.
Prerequisites
Before starting, make sure the current account has the required asset permissions, action permissions, and menu groups including Dashboard. If not assigned, contact the application administrator.
Filtering Sites and Time
In the filter bar at the top of the page, you can filter ticket data by site and time. By default, the ticket data of all sites for the past month is displayed.

Viewing Data Metrics
After filtering is done, the work overview will perform real-time calculations and display the following metrics based on the selected sites and time.
Card |
Description |
|---|---|
Service Request Overview |
|
Work Order Overview |
|
Work Orders Created vs. Closed |
A comparison between new and closed work orders can be viewed by day or month to help understand the daily/monthly generation and handling of work orders |
Work Order Distribution |
The proportion of different work orders types and priorities |
Work Order Closure Rate |
The ratio of closed work orders to new work orders helps managers understand the closed-loop status of work orders |
Work Order Process Efficiency |
The length of time from the first response to the closing time after a new work order is created can help managers understand the closed-loop efficiency of work orders |
Work Order Trends |
Numerical trends for new work orders in dimensions such as work order type and priority, which helps managers understand new work order developments and be able to better estimate future workload distribution |
Work Order Ranking |
Quantity trends for new work orders by categories such as site and device dimension |