Enabling Application Monitoring
Using the application monitoring function, you can quickly access the monitoring metrics generated by the application to the platform, generate a monitoring dashboard, and then create alerts based on the metrics through the common alerting service capability.
Prerequisites
Created and deployed the application
Service has been created for the application
The programming language used to develop the application supports application monitoring (currently only Java is supported)
Procedure
Turn on the application monitoring service by following these steps:
From the left navigation bar, select Monitor > Application Metric.
Enter the Application Metric List page and click Application Monitoring to complete the configuration of the access application.
After selecting the application, environment, and cluster name, click Next Step.

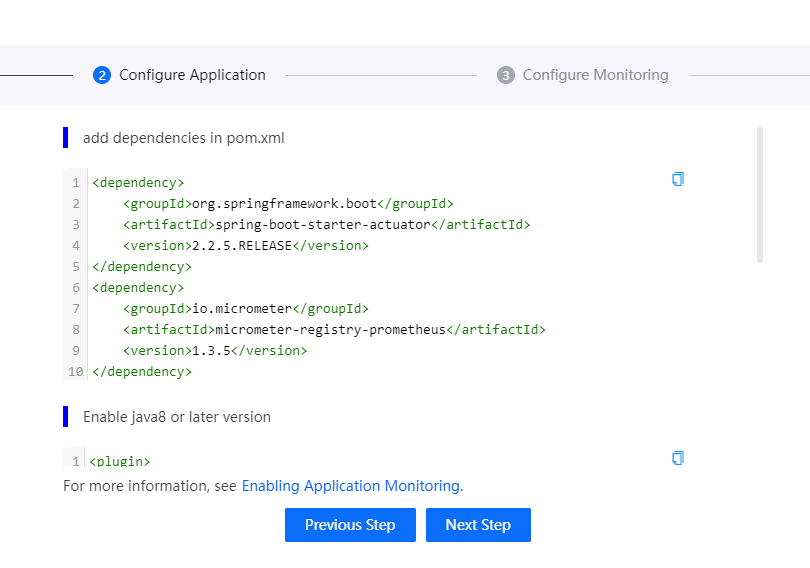
In the Configure Application page, update the code of the target application using the code examples provided by the platform, including:
Add dependencies in pom.xml
Enable java8 or laster version
Add configuration in
application.propertiesfileApplicationStarter class configuration

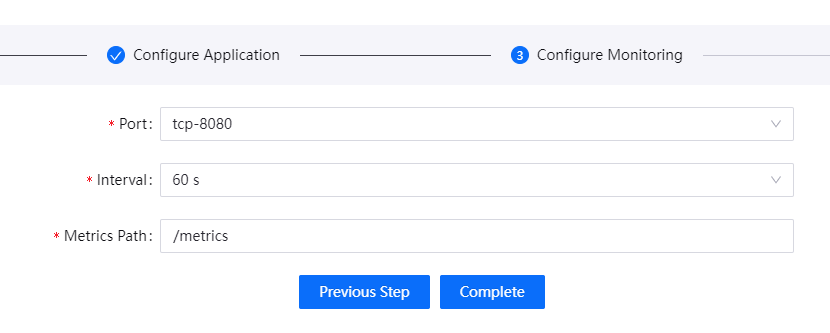
In the Configure Monitoring page, complete the monitoring configuration of the access application:
In this step, you need to configure the Service Monitor information, if the application has been configured with Service Monitor, the data will be loaded by default. You can adopt it directly or modify it. For details, see Configuring Service Monitor.
Note
Saving this change will update the Service Monitor information.
Port:After configuring Service for the application, the port information will be read automatically
Interval:Select the period for collecting application monitoring information
Metrics Path:Input path
/metrics/Prometheus

Click Complete to save the application monitoring configuration, and you can view the monitoring information on the Application Monitoring Dashboard page.
Next Steps
Users can create alert rules and receive alert events based on the application metrics, the following is whether each application metric supports setting alert rules:
Uptime:The time duration during which the application is up and running, no support for setting alerts
Start Time:The time duration during which the application is up and running, no support for setting alerts
Heap Used:Heap memory usage,no support for setting alerts
Non-Heap Used:Non-heap memory usage,no support for setting alerts
Files Opened by Processes:Number of open files in the process,supports setting alert
CPU Usage:CPU usage information,supports setting alert
Average Load:Average load information,supports setting alert
PS Eden Space(heap):Memory statistics of the Eden Space in the heap,no support for setting alerts
PS Old Gen(heap):Memory statistics of the Eden Space in heap,no support for setting alerts
PS Survivor Space (heap):Memory statistics of the Survivor Space in heap,no support for setting alerts
Code Cache (non-heap):Memory statistics of the Survivor Space in heap,no support for setting alerts
Metaspace (non-heap):Memory statistics of the Survivor Space in heap,no support for setting alerts
Classes Loaded:Memory statistics of the Survivor Space in heap,supports setting alert
Mapped Buffers:Memory-mapped buffers,no support for setting alerts
Direct Buffers:Direct buffers,no support for setting alerts
Memory Allocate:Incremented for an increase in the size of the young generation memory pool after one GC to before the next,supports setting alert
Memory Promote:Count of positive increases in the size of the old generation memory pool before GC to after GC,supports setting alert
Threads:Application threads,no support for setting alerts
GC Count:Garbage collection count,supports setting alert
GC Duration:Out-of-service duration of garbage collection,supports setting alert
For more information on how to create alert rules, see Configuring alert rules.