How to Create Log Metrics
Log moniroting and alarming are provided To help application developers and O&M users efficiently ensure the stability of applications and rapidly locate problems in the Devops process.
The log service can convert application logs into log metrics, and then trigger alerts based on the metrics by the general alarming service.
Creating Log Metrics
Take the following steps to create log metrics.
From the left navigation bar, select Log > Log Metrics
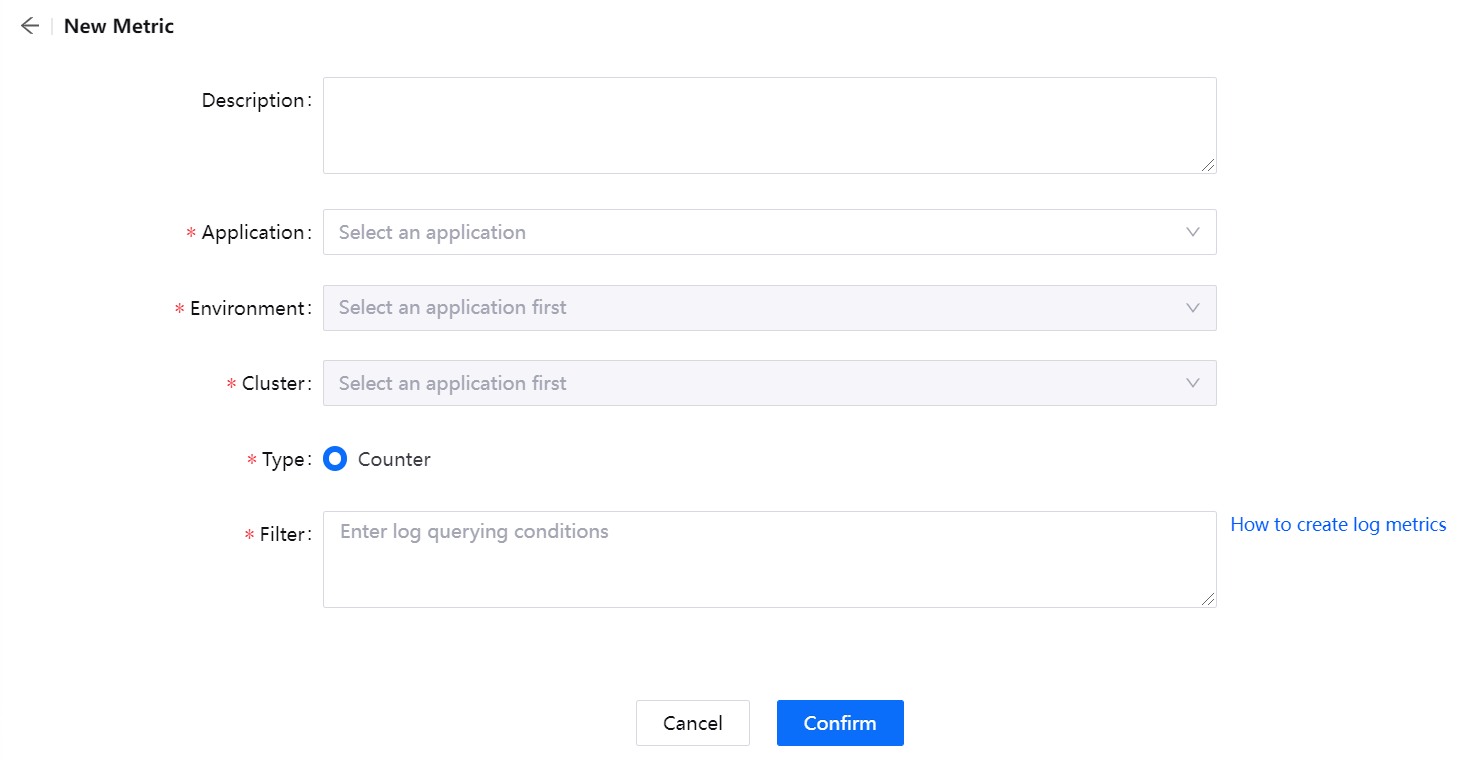
Click New Metric to open the Create metric page and complete the configuration of the log metric.
Metric Name: Enter the name of the log metric.
Description: Enter a description of the log metric.
Application: Select the application for which the log metrics need to be created.
Environment: Select the Environment where the application is located.
Cluster: Select the cluster where the application is located.
Type: default counter.
Filter: Enter the log query filter criteria. For details, see Querying Application Logs.

Click Confirm to complete the log metric creation.
Editing Log Metric
Click ![]() ,The user can edit log metrics and the following fields are supported for editing.
,The user can edit log metrics and the following fields are supported for editing.
Metric Name
Description
Type
Filter
Deleting Log Metric
Click ![]() ,users can delete log metrics.
,users can delete log metrics.
Note
If there is an alert rule related to the metric, the user needs to delete the alert rule before deleting the metric.
Next Steps
After the log metrics are created, they can be viewed in Log Monitor Dashboard. For details, see Enabling log monitoring.
Users can create alert rules based on log metrics and receive alert events.
For more information on how to create alert rules, see Configuring alert rules.