Unit 4: Developing Stream Data Processing Jobs
After storage policies are configured for the smart electric meter measuring points and the data is connected to EnOS, you can develop data processing jobs for the uploaded data. EnOS Stream Analytics targets to meet the real-time data processing requirements of devices and assets. The Stream Analytics service provides visualized template-based configuration to help you quickly develop stream analytics jobs and monitor the running status of the jobs.
Creating data processing jobs
EnOS Streaming System supports creating a data processing jobs and importing the configuration file of an existing job. Take the following steps to create data processing jobs for the electric meter data:
- Log in EnOS Console and click Stream Data Processing > Stream Development.
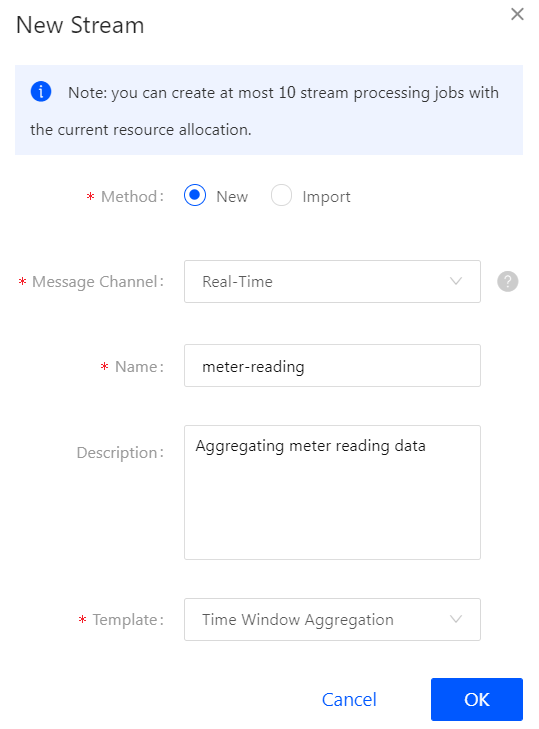
- Click the + icon above the stream processing job list to open the New Stream window. Enter the name and description of the stream processing job and select a template:
- Time Window Aggregation: For getting the maximum and minimum values of the meter reading data in 10 minutes.
- Multi-Point Merging: For getting the difference between the maximum and minimum values of the reading data in 10 minutes.
See the following example:

Configuring data processing jobs
EnOS Stream Analytics provides several templates for processing stream data. In this tutorial, configure 2 data processing jobs using the Time Window Aggregation and Multi-Point Merging templates.
Job for getting the max/min values of a measuring point
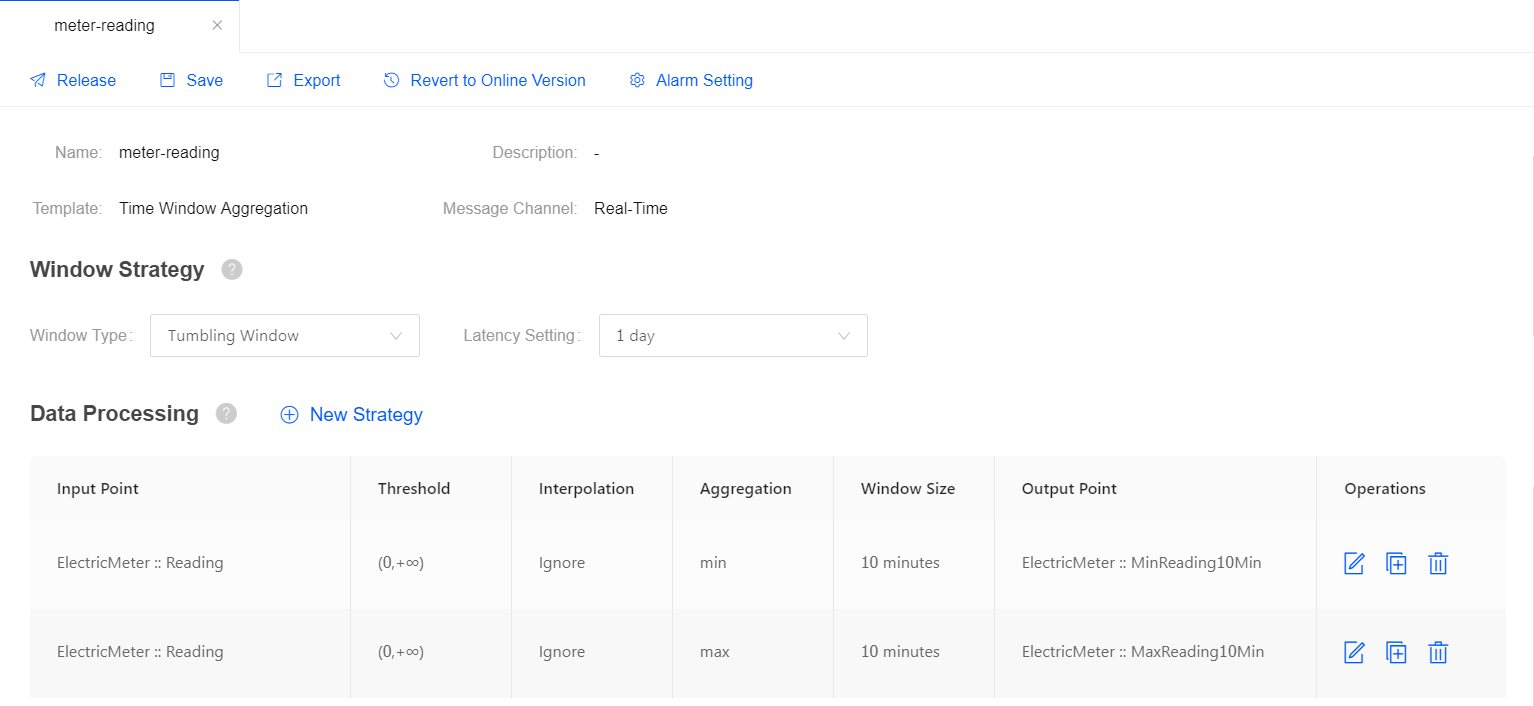
In this step, use the Time Window Aggregation template to create a data processing job for processing the data of the Reading measuring point and assigning the processed data to another measuring point.
Complete the following configuration for the stream data processing job:
| Field | Value | Description |
| Window Type | Tumbling Window | The time window for processing data, which has a fixed size and does not overlap. |
| Latency Setting | 1 day | The allowed lateness for data arriving late. 0 second indicates that data arriving late will be ignored. |
| Input Point | Reading | The measuring point providing raw data. |
| Threshold | [0, 100) | The threshold filtering valid data value. |
| Interpolation | Ignore | Interpolation algorithm that is used to process the input data that exceeds the threshold. |
| Aggregation | max / min | Get the maximum / minimum value of the meter reading data. |
| Window Size | 10 minutes | The size of each time window for processing data. |
| Output Point | MaxReading10Min / MinReading10Min | The measuring points receiving the processed data. |
See the following example:

For more information about the Time Window Aggregation template, see Time Window Aggregation Template.
Job for getting the difference between measuring points
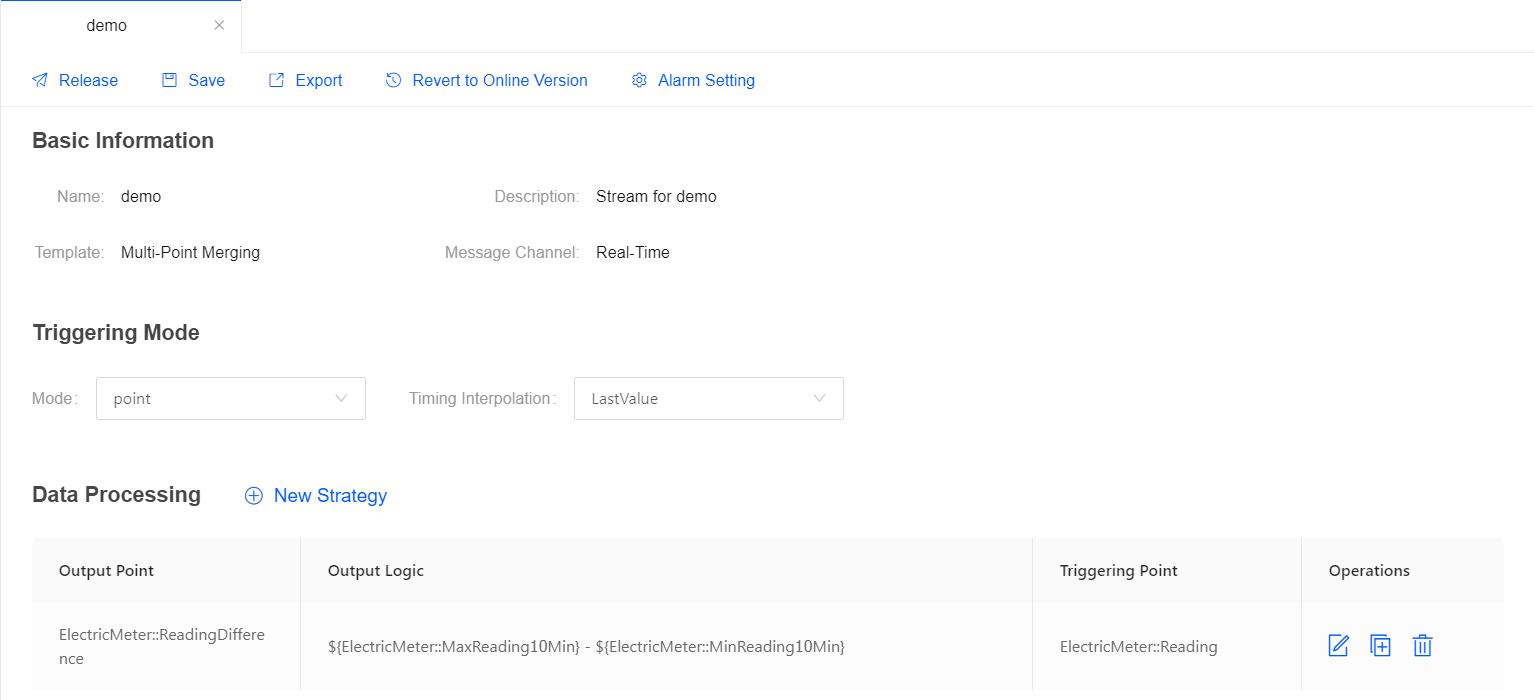
In this step, use the Multi-Point Merging template to create a data processing job for getting the difference between 2 measuring points and assigning the processed data to another measuring point.
Complete the following configuration for the stream data processing job:
| Field | Value | Description |
| Triggering Mode | Frequency | The data processing job is triggered by the specified frequency. |
| Triggering Frequency | 10 minutes | The data processing job will run every 10 minutes. |
| Output Point | ReadingDifference | The measuring point receiving the processed data. |
| Output Logic | ${ElectricMeter::MaxReading10Min} - ${ElectricMeter::MinReading10Min} |
The expression for getting the difference between the values of the 2 measuring points. |
See the following example:

For more information about the Multi-Point Merging template, see Multi-Point Merging Template.
Starting data processing jobs
After the data processing job configuration is completed, you can publish it online:
Click Save to save the configuration of the data processing job.
Click Release to release the job online.
On the Stream Operation page, find the data processing job that is online, and then click the the Start icon
 to start the job.
The data processing job will start running if there is no error.
Viewing the job running status
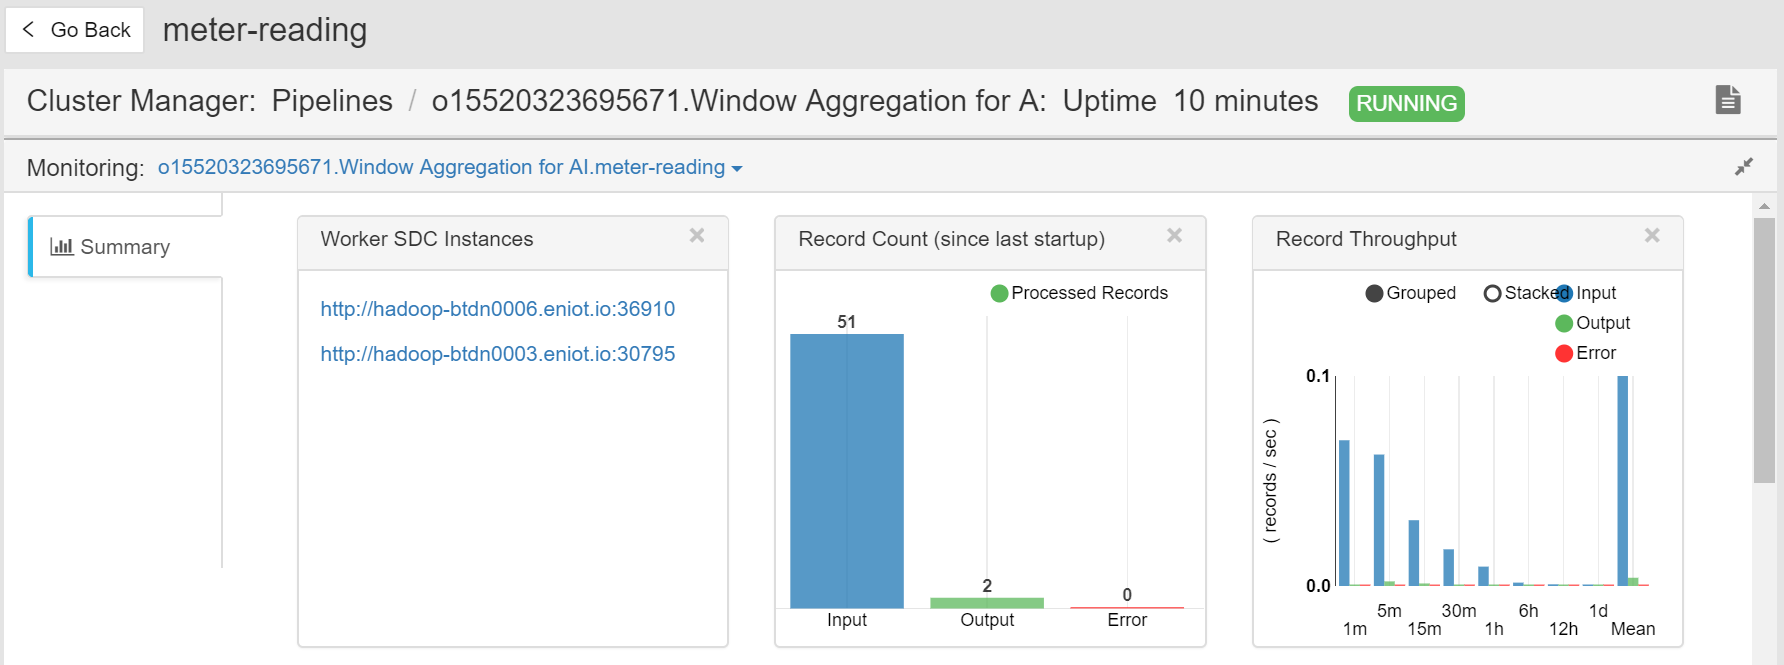
On the Stream Operation page, find the running data processing job in the table, and click the job name to open the Stream Details page. You can view the following information about the job:
Summary: View the summary of the running stream, such as the overall data processing records and the data aggregation records in a specific period.

Log: Click the View Logs icon on the upper right corner to check the running log of the job.
Results: The processed data will be stored in TSDB according to the configured storage policy.
Then, you can get the stored data with EnOS APIs as the follow-up step.