Unit 5: Viewing Stored Data with Data Insights
After the stream data processing pipeline has run for 1 day, you can go to the Data Insights page to view the daily energy production data of each wind turbine, and the daily energy production data and carbon reduction data of each wind farm.
Select Time Series Data Management > Data Insights from the left navigation panel of the EnOS Management Console to open the Data Insights page.
In the Select Time Range section, select the time range for querying the data, for example, 3D.
Click the Select Devices input box, search for the wind turbines or wind farms, and select one or more devices from the drop-down list. The selected devices will be dynamically presented in the Selected Measuring Points column.
In the Selected Measuring Points column, click on the device name of your choice, expand the list of measurement points, and select one or more measurement points. The queried energy production data or carbon reduction data will be displayed in the chart on the right.
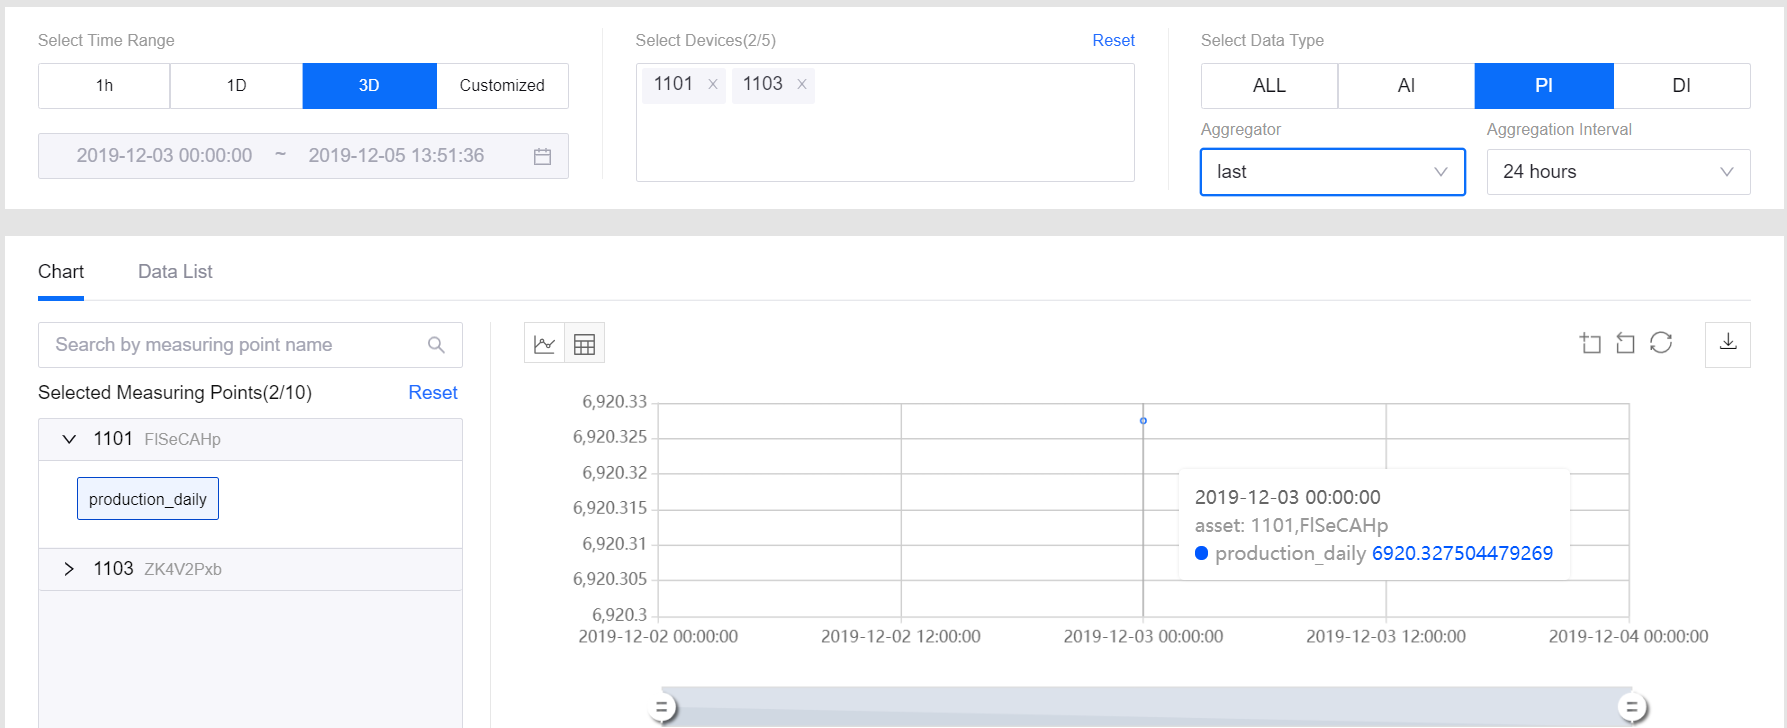
See the following example of the queried data for wind turbines:
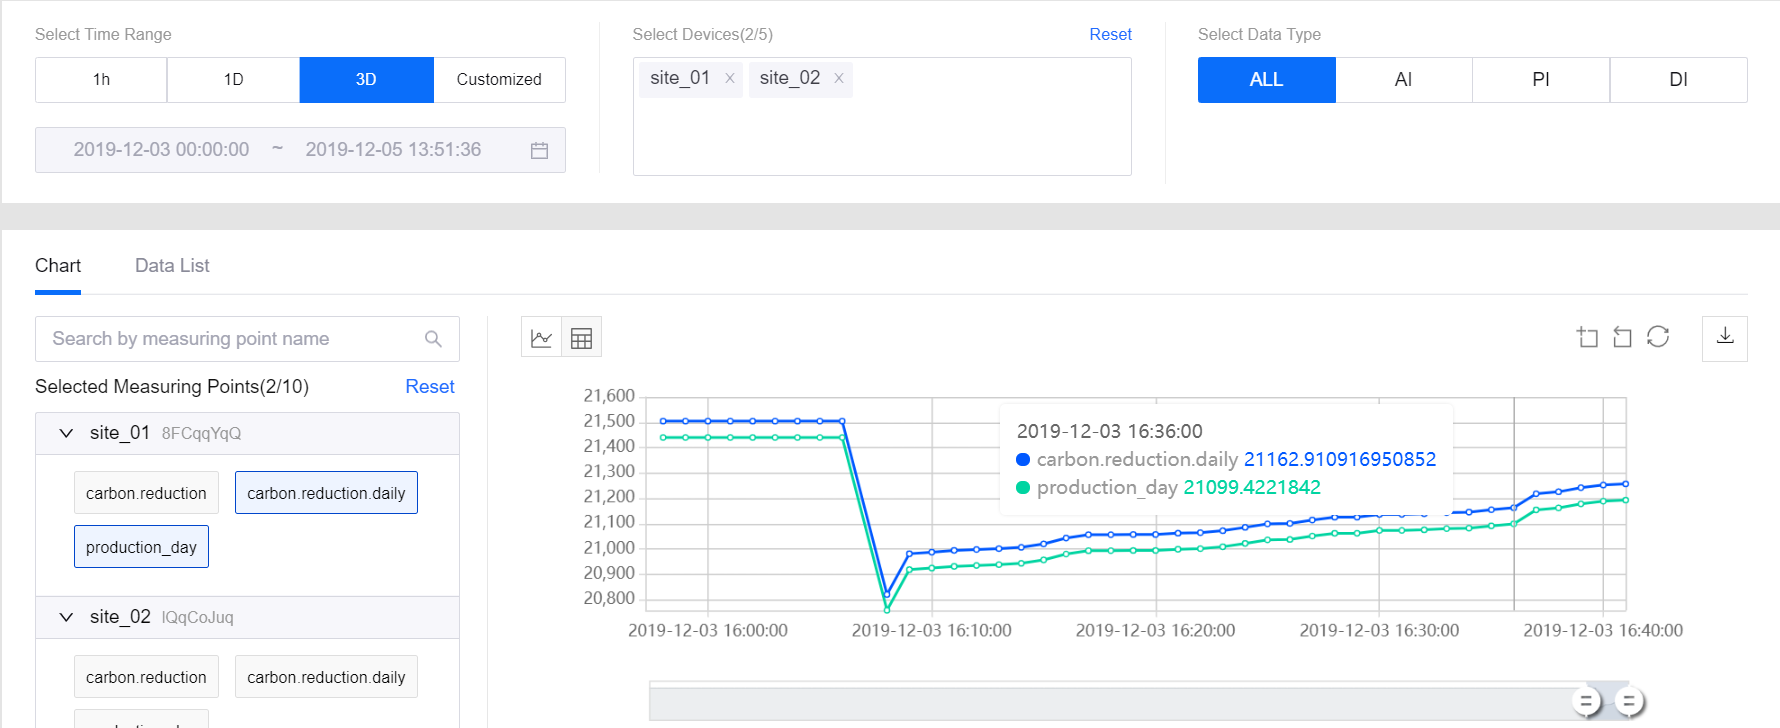
See the following example of the queried data for wind farms:
What to do next
To view the data of other wind turbines or measurement points, select the corresponding device name, data type, and measurement point name to query again.
After viewing the queried measurement point data, you can click the Download Data icon to download the queried data. The downloaded data will be saved as data_insight_{current_date}.csv.
The stored data can also be retrieved through EnOS data service APIs. For more information, go to EnOS Management Console > EnOS API.