Viewing Metric Data Quality
EnOS Data Quality provides a visualized page for querying the completeness, validity and credibility of metrics. Data Quality also provides the root cause analysis with corresponding data remediation methods for the metrics with low credibility or other data quality issues. Thus, application users can understand the overview of metric data quality, formulate solutions for metric data quality issues, and ultimately fix data problems and ensure high quality of metrics.
Prerequisites
Before you start, make sure the following items:
Make sure the user account has been assigned the menu group containing Metric Credibility. If not assigned, contact the application administrator.
The current OU has uploaded Quality Rule Configuration and Quality Analysis Configuration files. For more information, see Configuring Metric Quality Rule and Analysis Templates.
Viewing Metric Credibility
Reliability is used to measure the data quality of a metric and is related to the completeness and validity of the metric. The calculation formula for metric credibility is as follows:
Credibility = (Completeness Rate * Validity Rate) * 100%
You can view the credibility of metrics by the following steps:
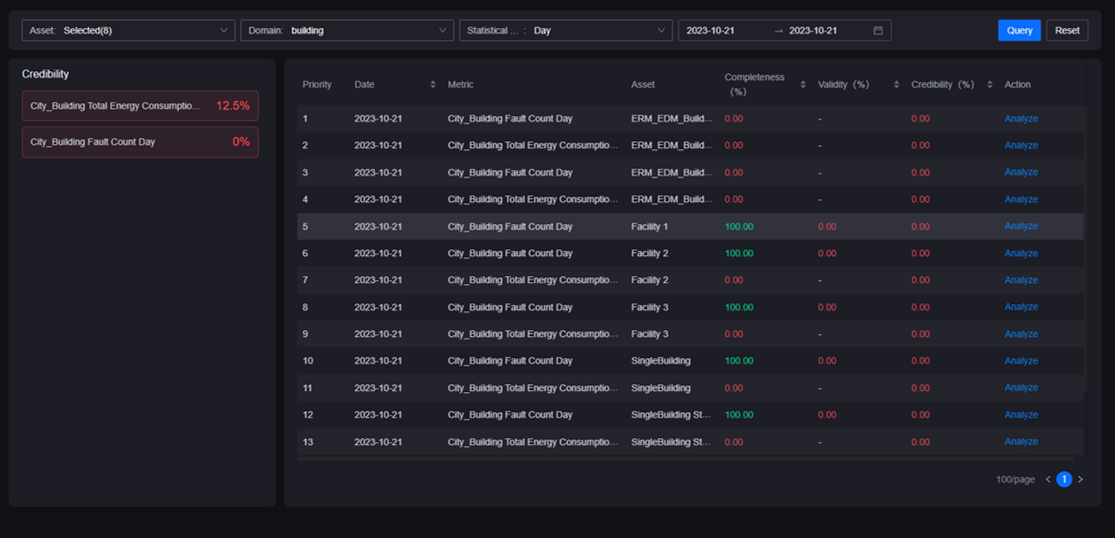
Select Data Quality > Metric Quality > Metric Credibility from the left navigation pane of Application Portal.
Configure the following information on the toolbar at the top of the page.
Field
Description
Asset
The site to which the metrics requiring data quality analysis belong.
You can select multiple sites at a time.Domain
The domain to which the metrics requiring data quality analysis belong to.
You can select multiple domains at a time.Statistical Period
The statistical period of the metric data and the time granularity for displaying query results.
Support selectingMonth(analyzing and displaying by month) orDay(analyzing and displaying by day).Start/End Date
The start and end time for data quality analysis.
Select query. The data quality results of the target metrics will be displayed in various visual charts on the page.
An example of the Metric Credibility page is shown as below.

Analyzing the Root Cause of Metric Quality Issues
After querying the overall credibility of the metrics, application users can use the root cause analysis tool provided by Data Quality to further locate the possible causes of the problems that occur for metrics with low credibility, and formulate solutions to address the quality issues, to achieve the quickly locating and resolving on data quality issues.
Follow the steps in Viewing Metric Credibility to query the credibility profile for each metric.
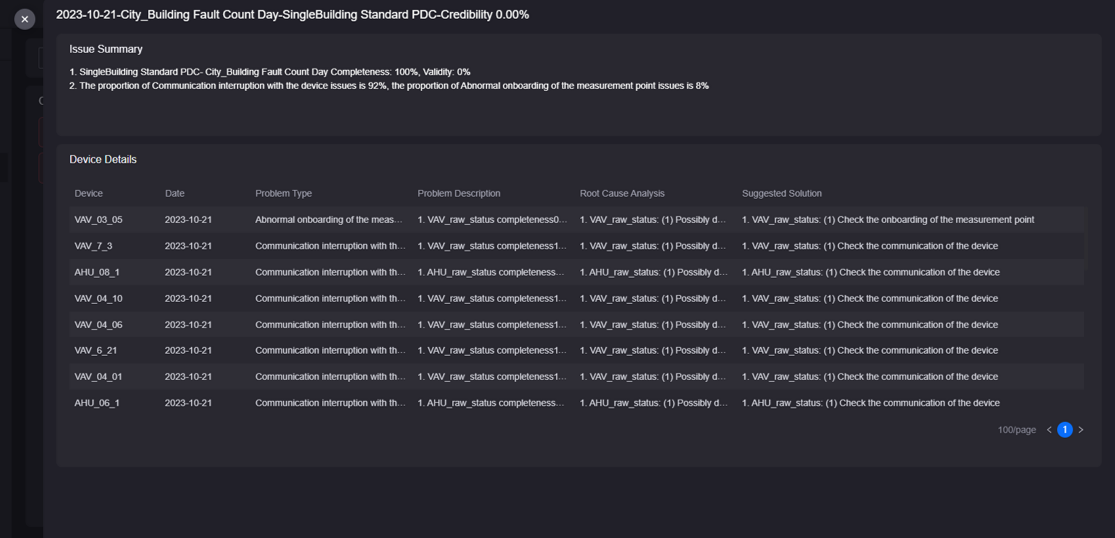
Select the Analyze of the target metric in the metric credibility list.
View the following information in the pop-up window.
Field
Description
Issue Summary
The details of metric quality, including information such as completeness, validity, issue proportion, and causes.
Device Details
The list of devices with data quality issues.
Device
The name of the target device.
Date
If the statistical period is
Day, it displays the date specified when querying metric quality.
If the statistical period isMonth, it displays the dates with quality issues in the specified months.Problem Type
The type of the metric quality issues, such as abnormal measurement point onboarding, device communication interruption, and abnormal data sources.
Problem Description
The description of the metric quality issues.
Root Cause Analysis
The potential root cause of the metric quality issues.
Suggested Solution
The suggested solution to fix the metric quality issues.
An example of the analysis report on metric quality issues is shown as below.
