Online Debugging
Developers can debug and test registered devices in IoT Hub online to quickly locate problems or to facilitate application development.
This section shows how to use the debug functions.
Real and Virtual Devices
There are two types of devices that you can debug: real and virtual devices. You can debug these devices according to the feature definitions defined in the model. For more information on feature definitions, see Model Elements.
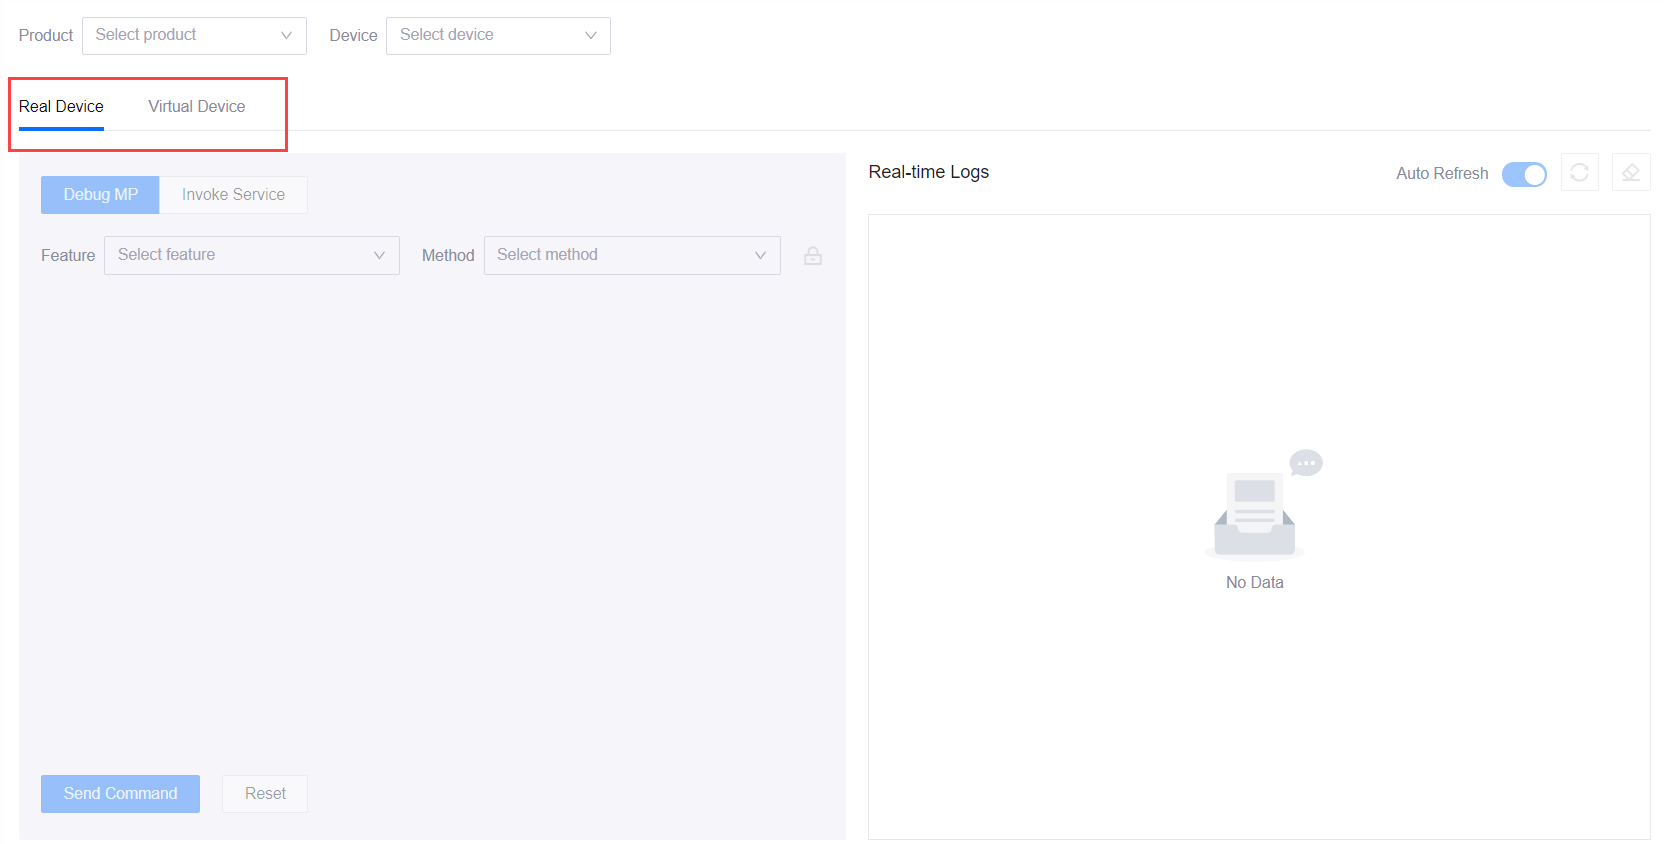
Real Devices
Real devices are devices that are currently activated and connected to IoT Hub and have an Online status.

As it is impossible to report the attributes, measurement points, and events of real physical devices from the cloud, the debugging functions for these devices only include the getting and setting of measurement points and invoking of services.
Virtual Devices
Virtual devices are devices in IoT Hub that have an Inactive or Offline status.

You can start using the virtual device by clicking on the Activate Virtual Device button. Activating these devices simulates a connection between the device and IoT Hub, enabling the simulated sending of device-to-cloud messages which helps in the quick development of cloud applications without relying on real devices. After activation, the status will change to Online. Once you have finished with the debugging, click Deactivate Virtual Device and the status will change to Offline.
Debugging functions include the simulated reporting of attributes, measurement points, and events from device to cloud, as well as the getting and setting of measurement points and invoking of services from cloud to device.
Before You Start
You need to be assigned the Device Management Administrator policy. If you are not assigned, contact your OU administrator. For more information about policies in EnOS, see Policies, Roles, and Permissions.
Procedure
Log in to the EnOS Management Console, go to Device Monitoring > Online Debugging, and select the Product that the device belongs to and then select the Device.
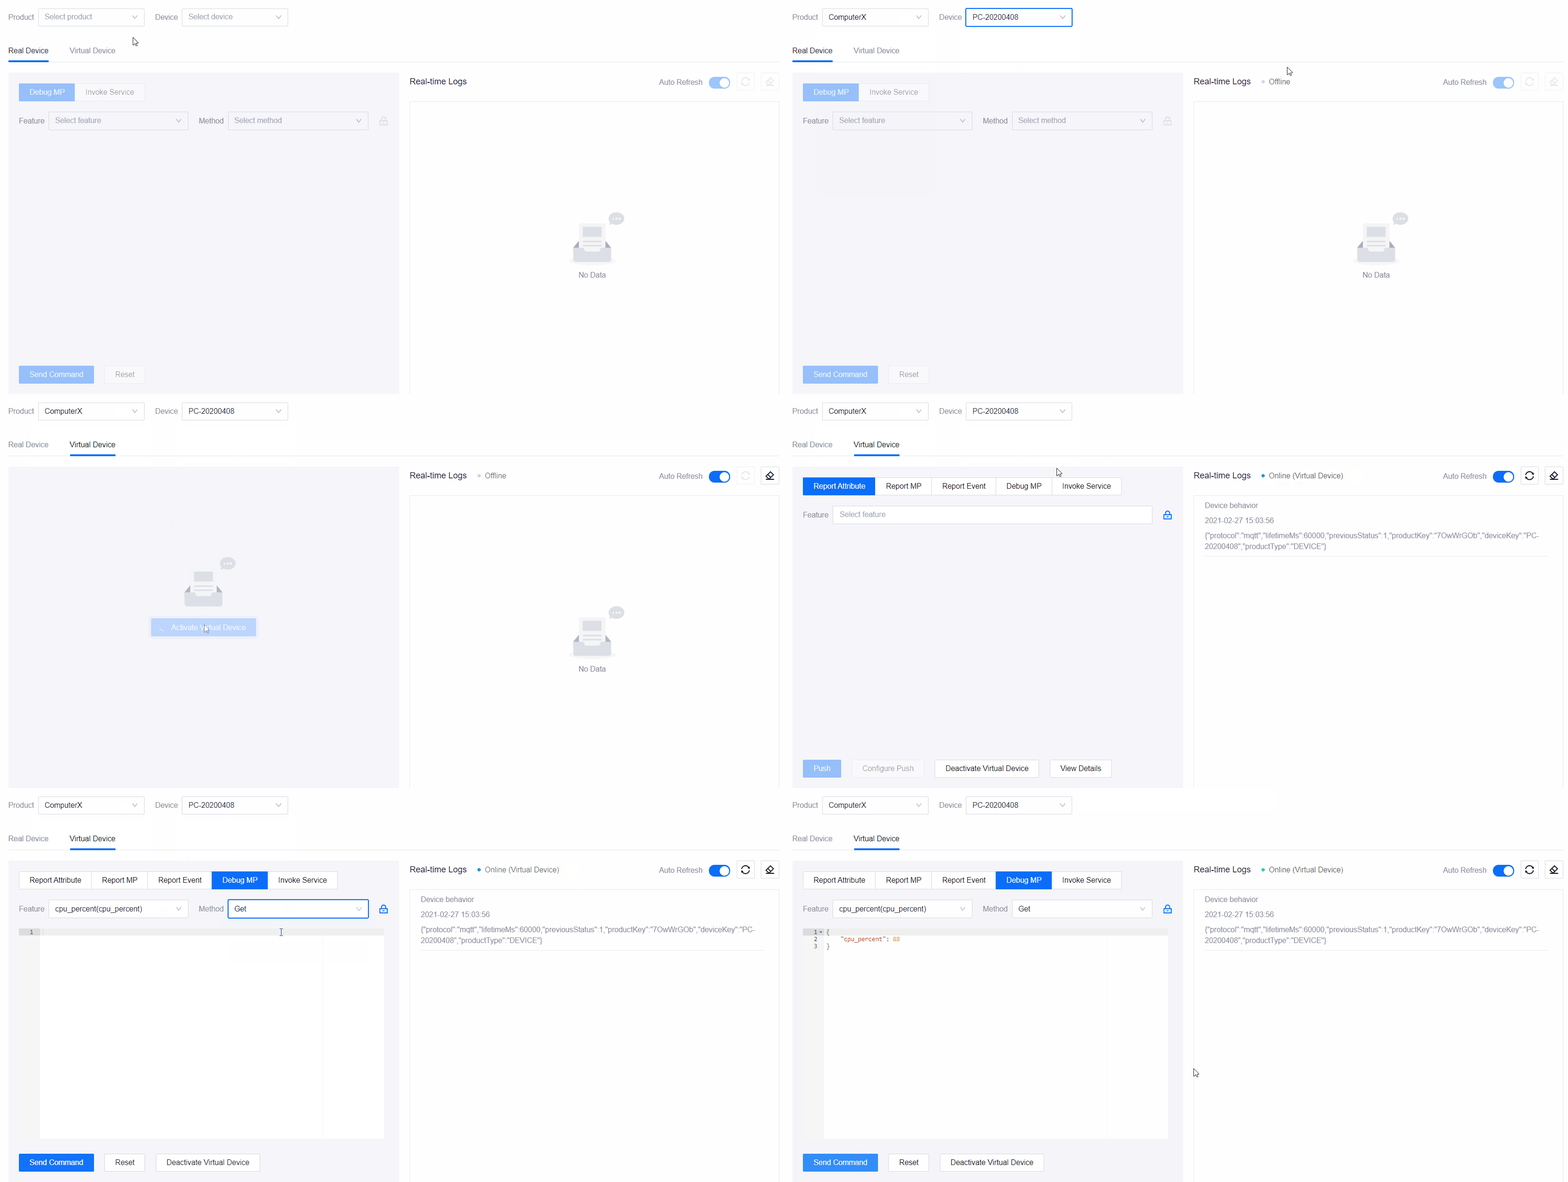
Getting Measurement Points
This is available for both real and virtual devices.
Under the Debug MP section, select the measurement point from the Feature drop-down and select Get from the Method drop-down.
Click the Send Command button to get the measurement point of the device. The latest data will be returned in the text box. There will be no corresponding logs displayed for this.
Setting Measurement Points
This is available for both real and virtual devices.
Under the Debug MP section, select the measurement point from the Feature drop-down and select Set from the Method drop-down.
Enter a value for the measurement point in the text box provided according to its data type.
Click the Send Command button to set the measurement point of the device. The corresponding logs for both the cloud and device side will be displayed on the right.
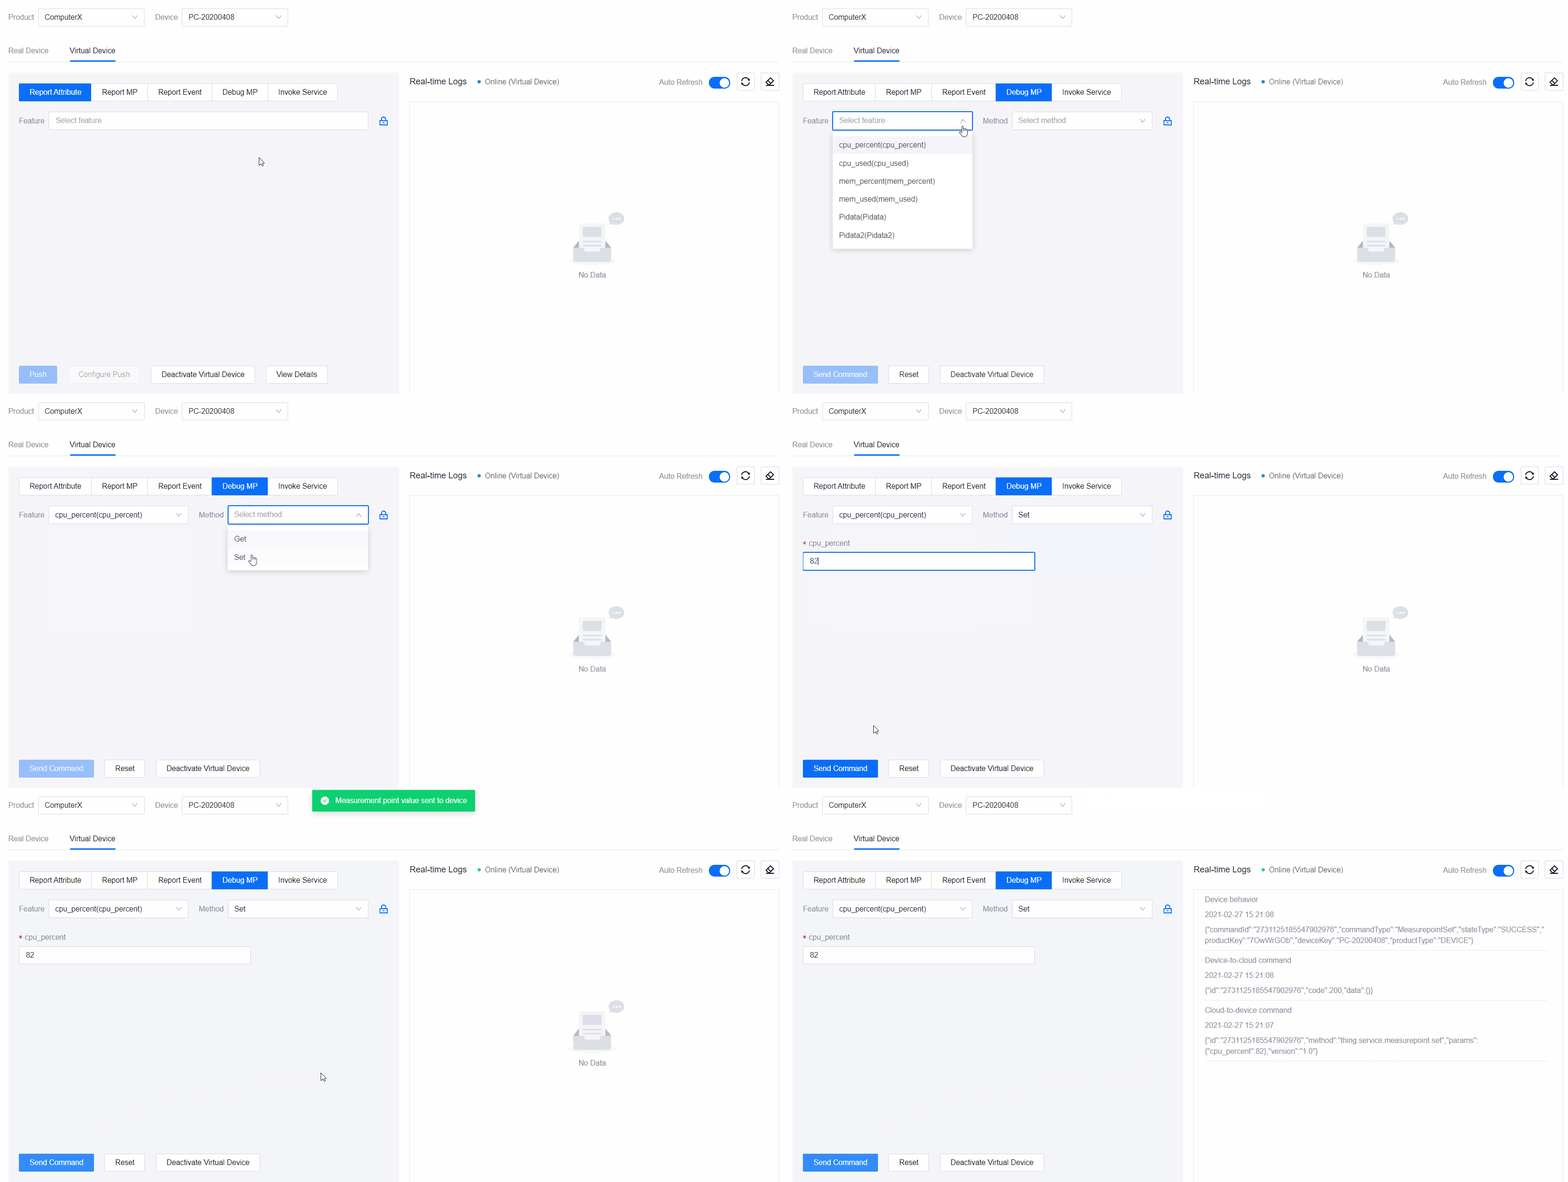
This command will also be reflected under the Commands tab in the device’s Device Details page at Device Management > Device Assets.
As this is the sending of a command from the cloud to the device, and not the actual reporting of measurement point from the device, the value of the measurement point in IoT Hub will not be changed.
Invoking Services
This is available for both real and virtual devices.
Under the Invoke Service section, select the service from the Feature drop-down.
The input parameters of the selected service will be listed. Enter a value for each parameter in the text box provided according to its data type.
Click the Send Command button to invoke the service. The corresponding logs for both the cloud and device side will be displayed on the right.
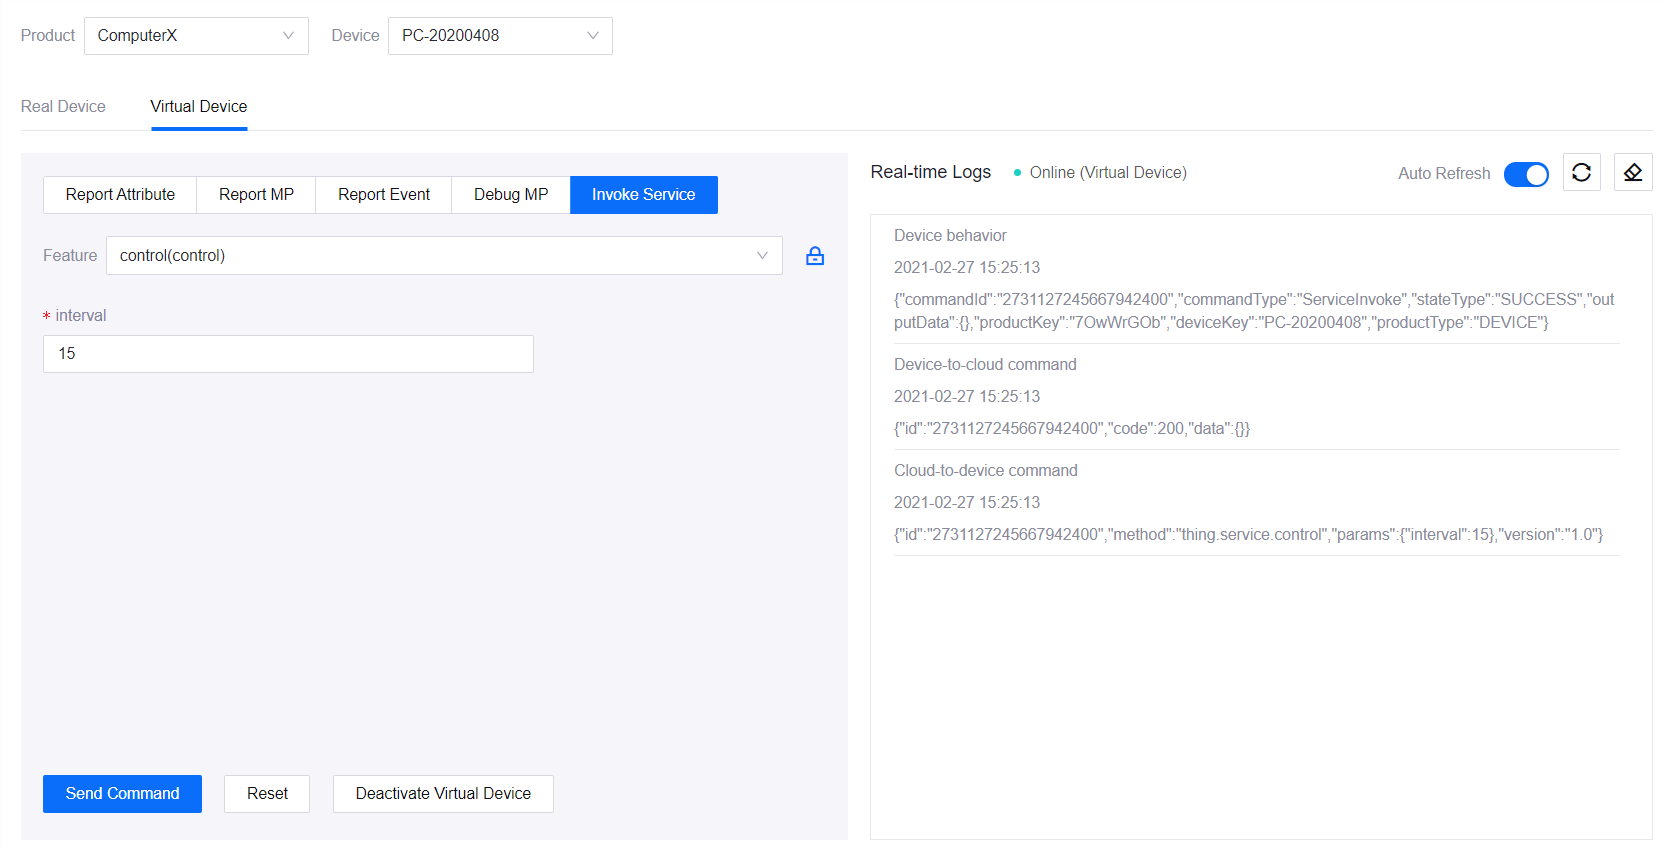
This command will also be reflected under the Commands tab in the device’s Device Details page at Device Management > Device Assets.
Reporting Attributes
This is only available for virtual devices.
After activating the virtual device, go to the Report Attribute section and select the attribute from the Feature drop-down.
Enter a value for the attribute in the text box provided according to its data type.
Click the Push button to report the attribute value. The corresponding logs for the reporting of the attribute value will be displayed on the right.
As this is a reporting of the attribute value from the device to the cloud, the value of the attribute in IoT Hub will be changed. You can see the information by clicking the View Details button.
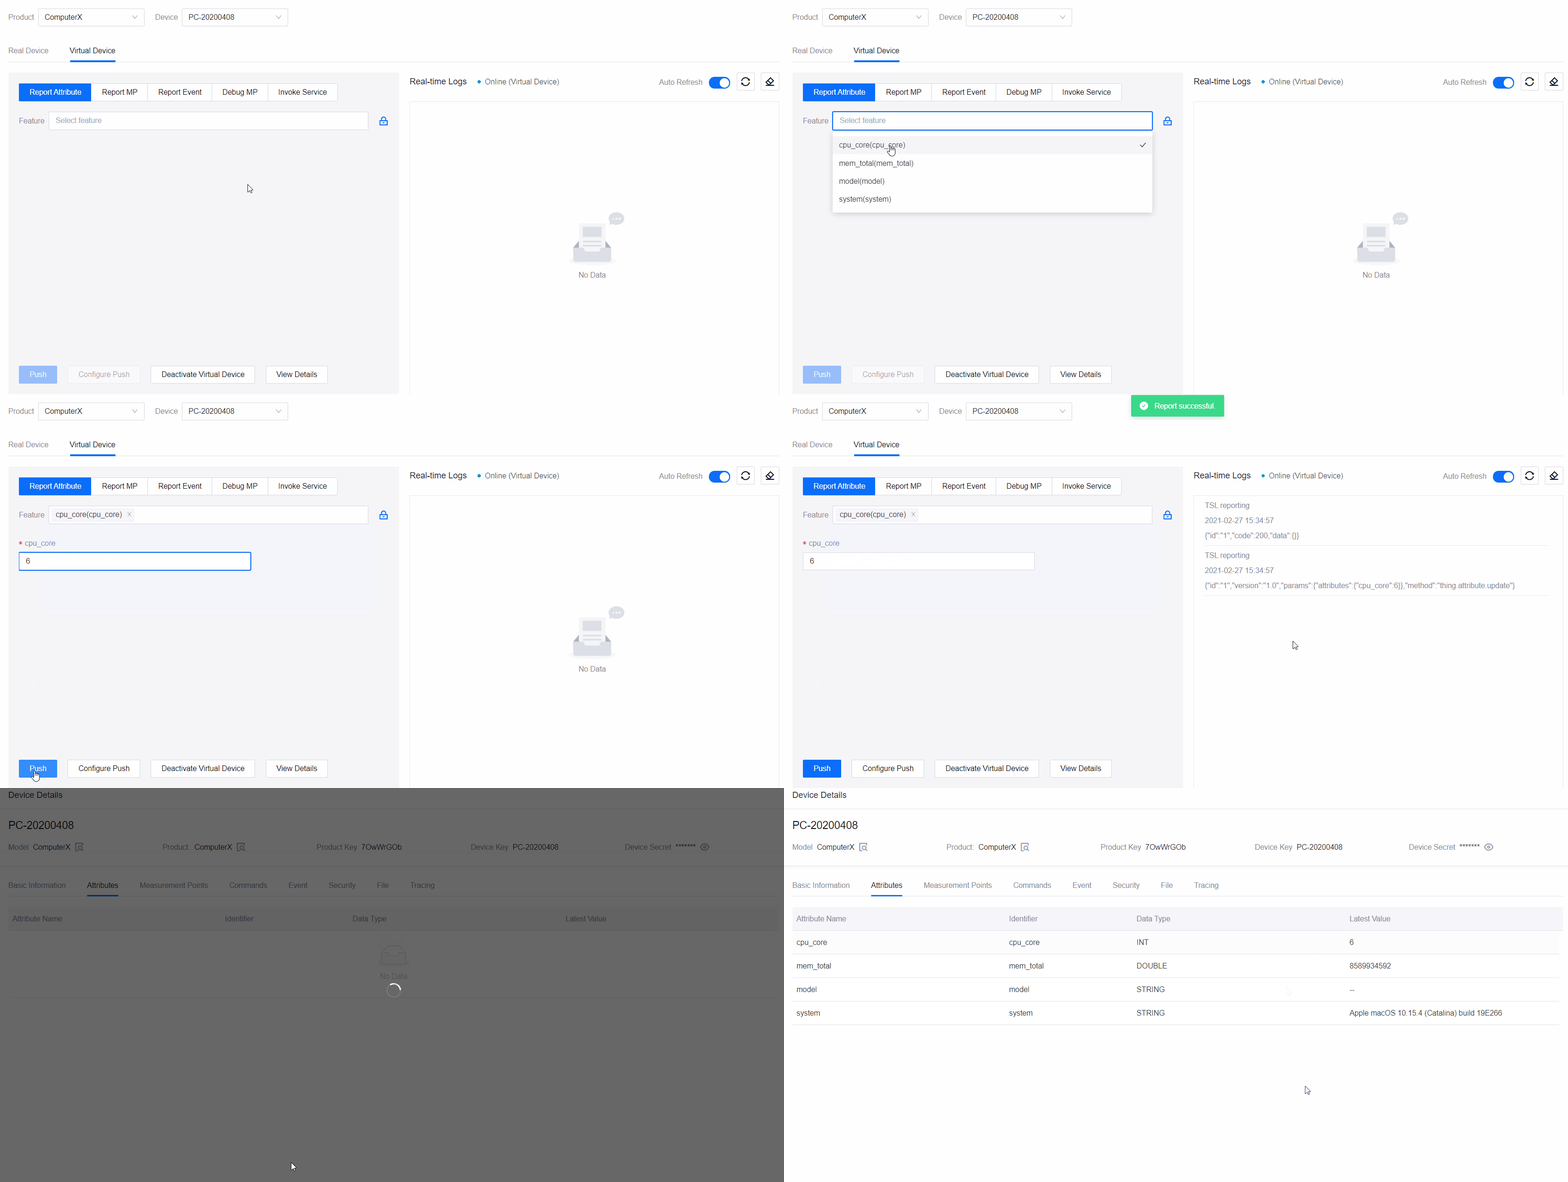
You can also configure the push timing/frequency via the Configure Push button. For more details, see Configuring Push.
Reporting Measurement Points
This is only available for virtual devices.
After activating the virtual device, go to the Report MP section and select the measurement point from the Feature drop-down.
Enter a value for the measurement point in the text box provided according to its data type.
Click the Push button to report the measurement point value. The corresponding logs for the reporting of the measurement point value will be displayed on the right.
As this is a reporting of the measurement point value from the device to the cloud, the value of the measurement point in IoT Hub will be changed. You can see the information by clicking the View Details button.

You can also configure the push timing/frequency via the Configure Push button. For more details, see Configuring Push.
Reporting Events
This is only available for virtual devices.
After activating the virtual device, go to the Report Event section and select the event from the Feature drop-down.
The output parameters of the selected event will be listed. Enter a value for each parameter in the text box provided according to its data type.
Click the Push button to report the event. The corresponding logs for the reporting of the event will be displayed on the right.
This event push will also be reflected under the Event tab in the device’s Device Details page. You can see the information by clicking the View Details button.
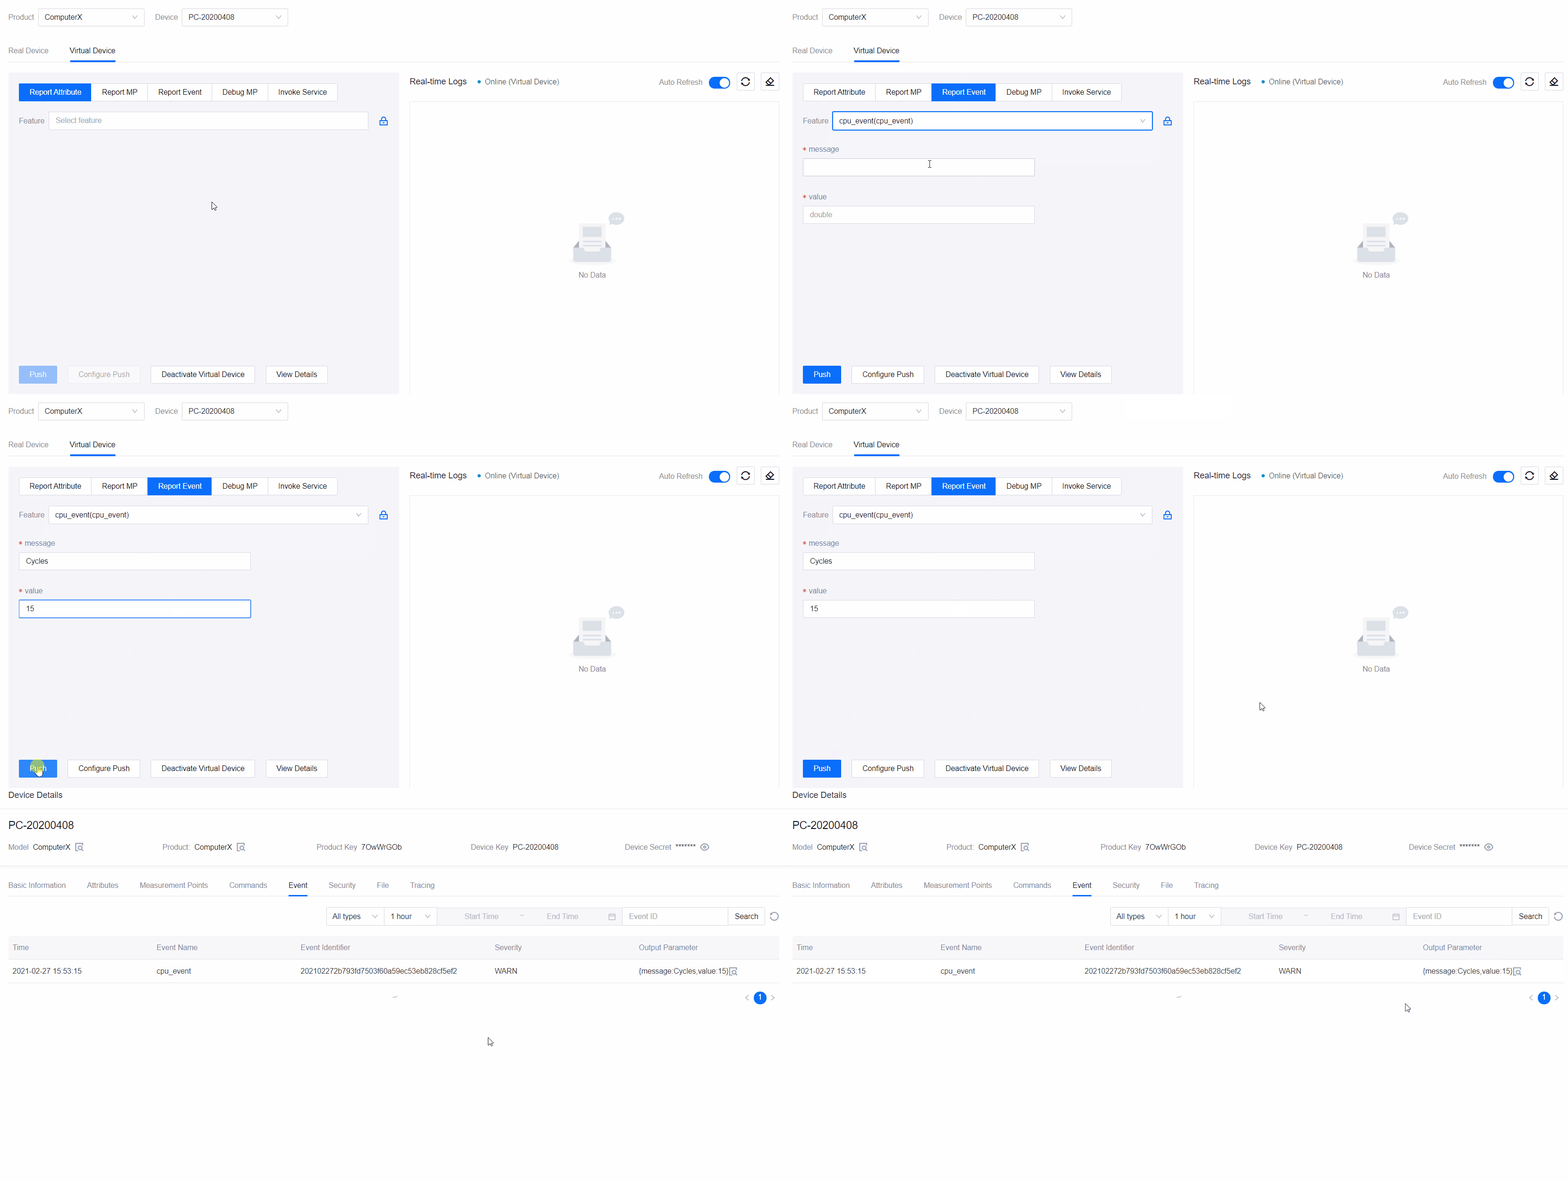
You can also configure the push timing/frequency via the Configure Push button. For more details, see Configuring Push.
Other Actions
Editing Models
As you can only debug the feature definitions defined in the selected model, you would not be able to debug a particular feature type if there are none defined. You can click on the Edit Model button to go to the Feature Definition tab for the selected model to add a feature for debugging. For more details on how to do this, see Defining Custom Model Features.
Configuring Push
There are two ways to configure the push timings/frequencies for the reporting of attributes, measurement points, and events: scheduled push or periodic push.
Scheduled Push: Enables you to schedule a push by selecting a date and time. Note that the date/time must be in the future and not the past.
Periodic Push: Enables you to set a push frequency for every N seconds per push.
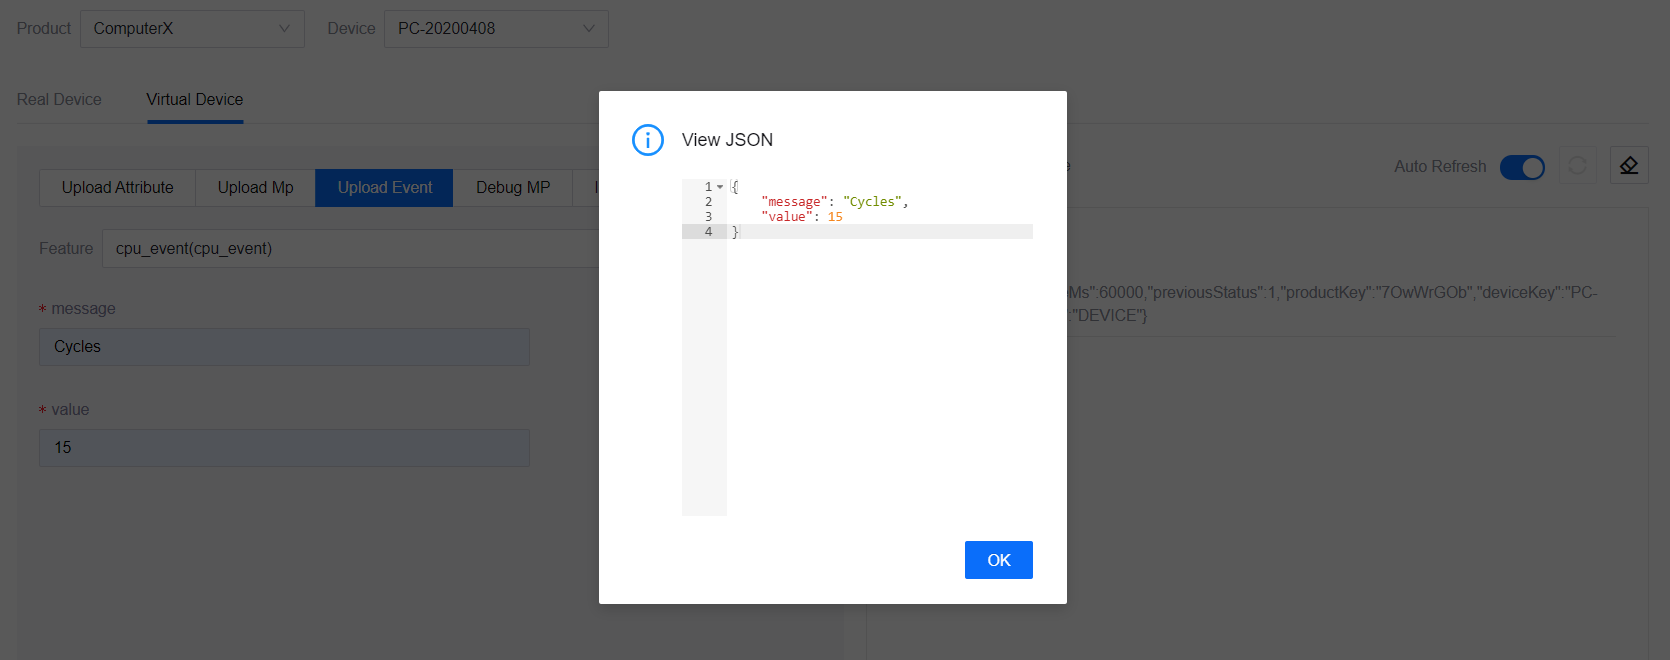
View JSON
Other than getting the device measurement points, you can view the JSON for the other debug functions. Click the View JSON icon  and a window displaying the script will pop-up.
