Cluster Monitoring Board
The ECP platform provides a cluster monitoring function where the cluster operation data is displayed on a monitoring board, which enables O&M personnel to track cluster usage.
Prerequisites
The user must have cluster administration permissions (administrator, cluster administrator, or namespace administrator).
Organization and namespace name are selected.
Procedure
Note
The Cluster Monitoring Service is part of the Cluster Management module of the Developer Studio and requires you to log in to EnOS ECP Developer Studio and switch to Cluster Management at the top left corner of the page menu.
Select Monitor > Monitor Board on the left navigation bar.
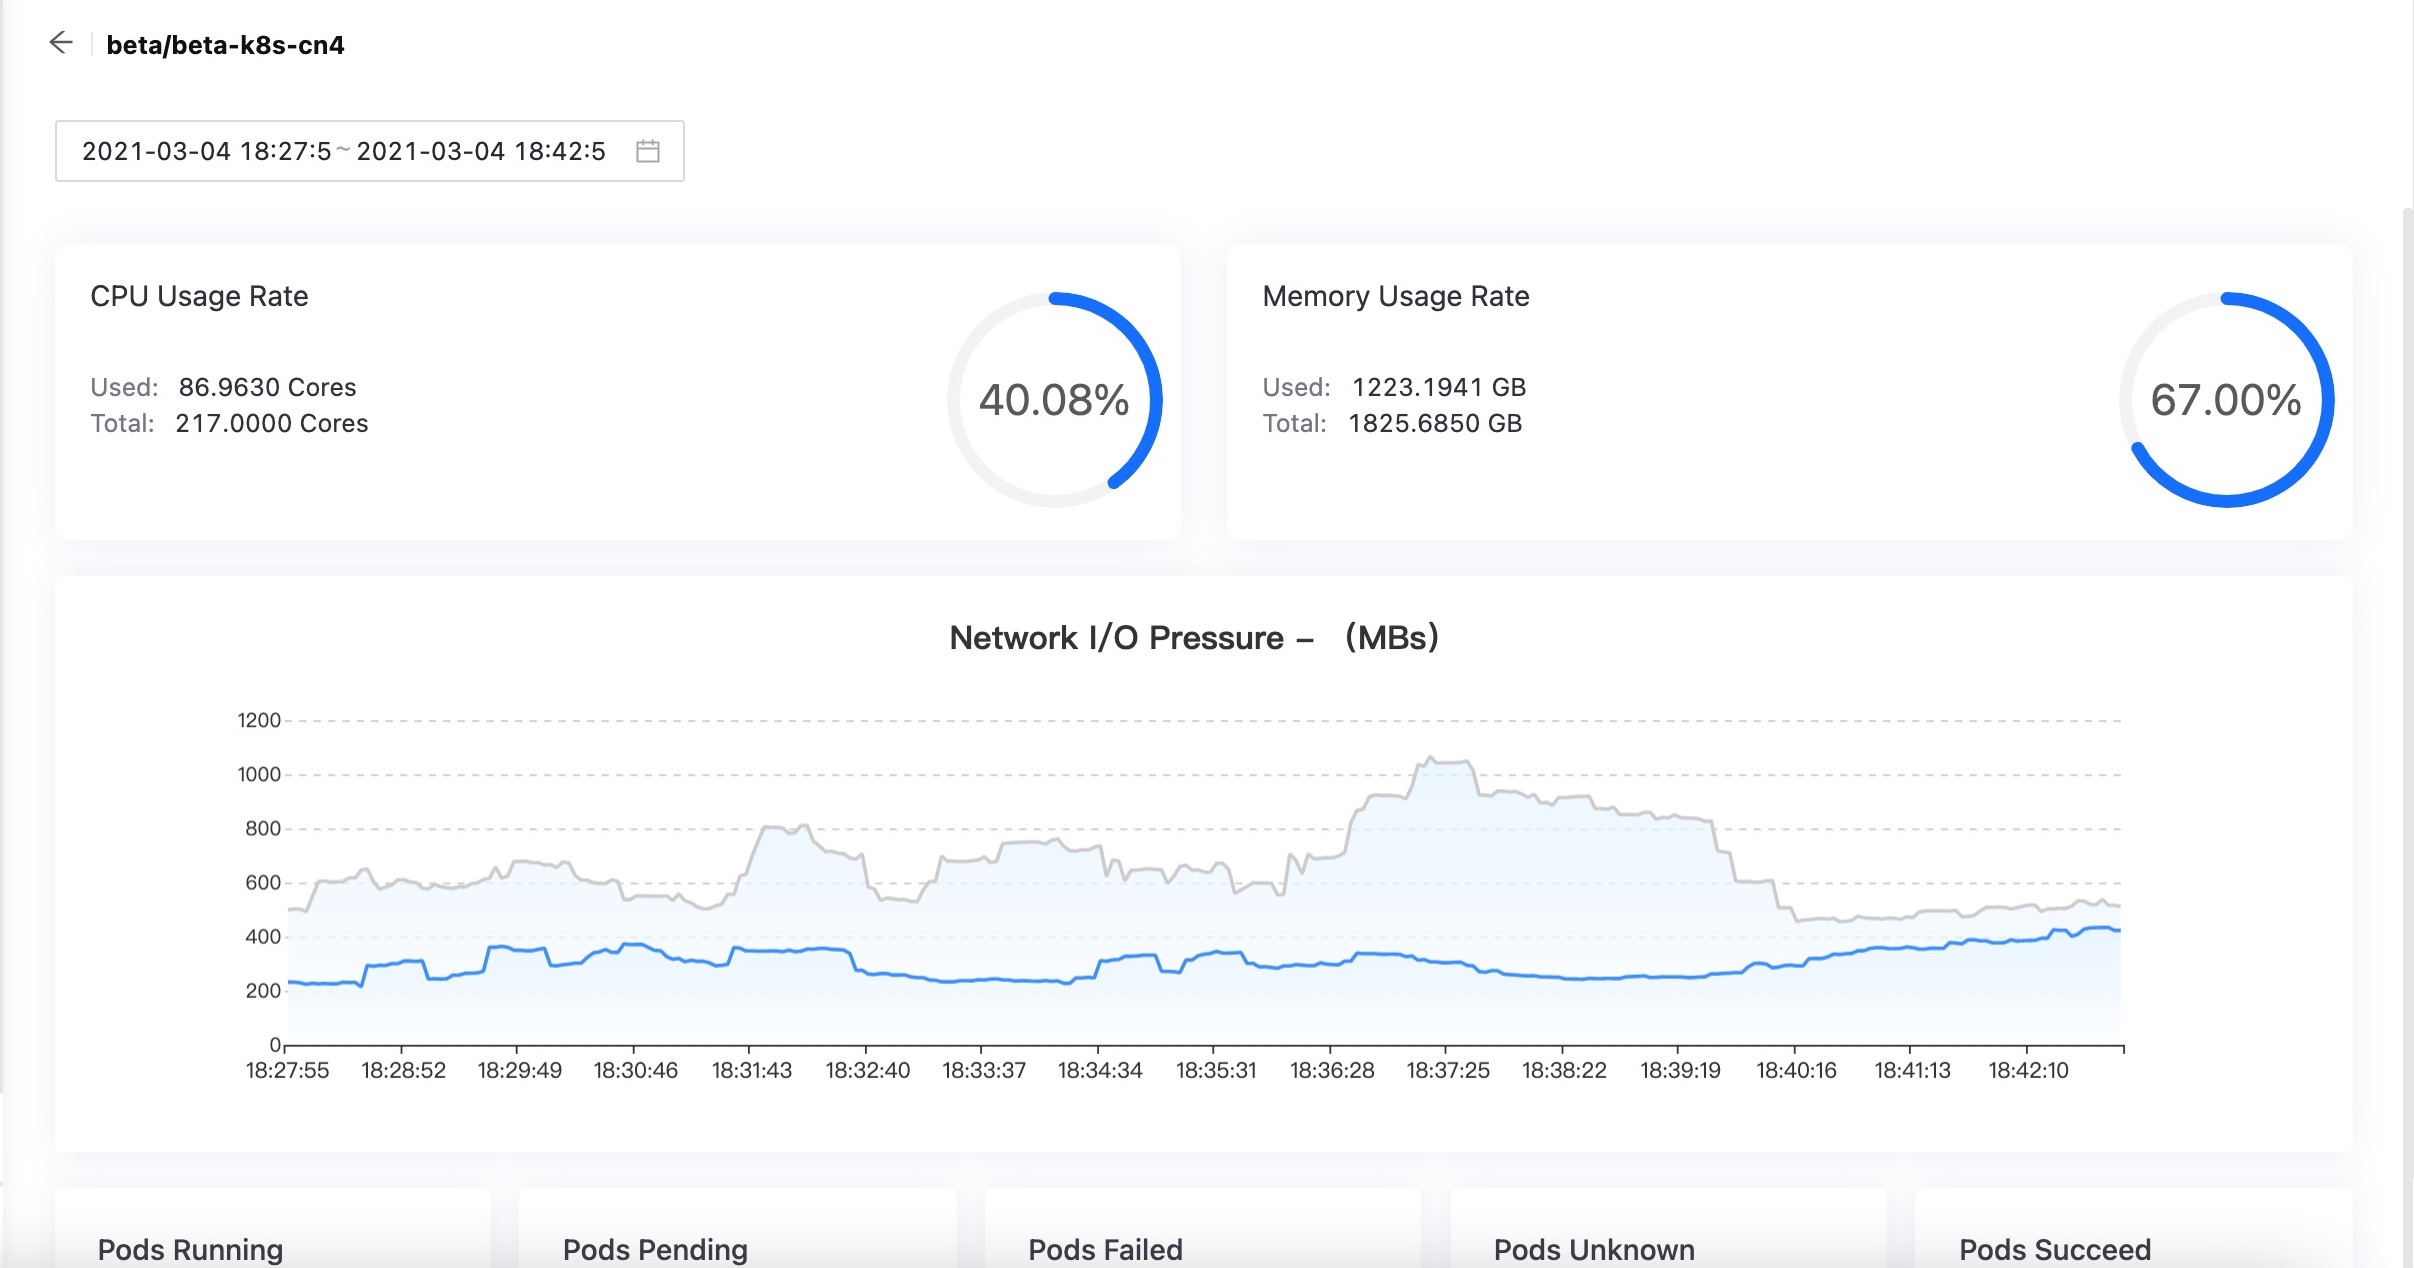
The default data shown is for the last 15 minutes. You can change this by selecting a custom time range at the top of the page. The longest time range that you can select is 1 month.
There are three sections to the displayed data.
Section 1: Shows the amount of CPU and memory currently used by the application, the total amount of CPU and memory that can be used by the application, and the CPU and memory usage ratio.
Section 2: Shows the received and transmitted network I/O pressure via a graph.
Section 3: Shows the number of pods according to their various status.
