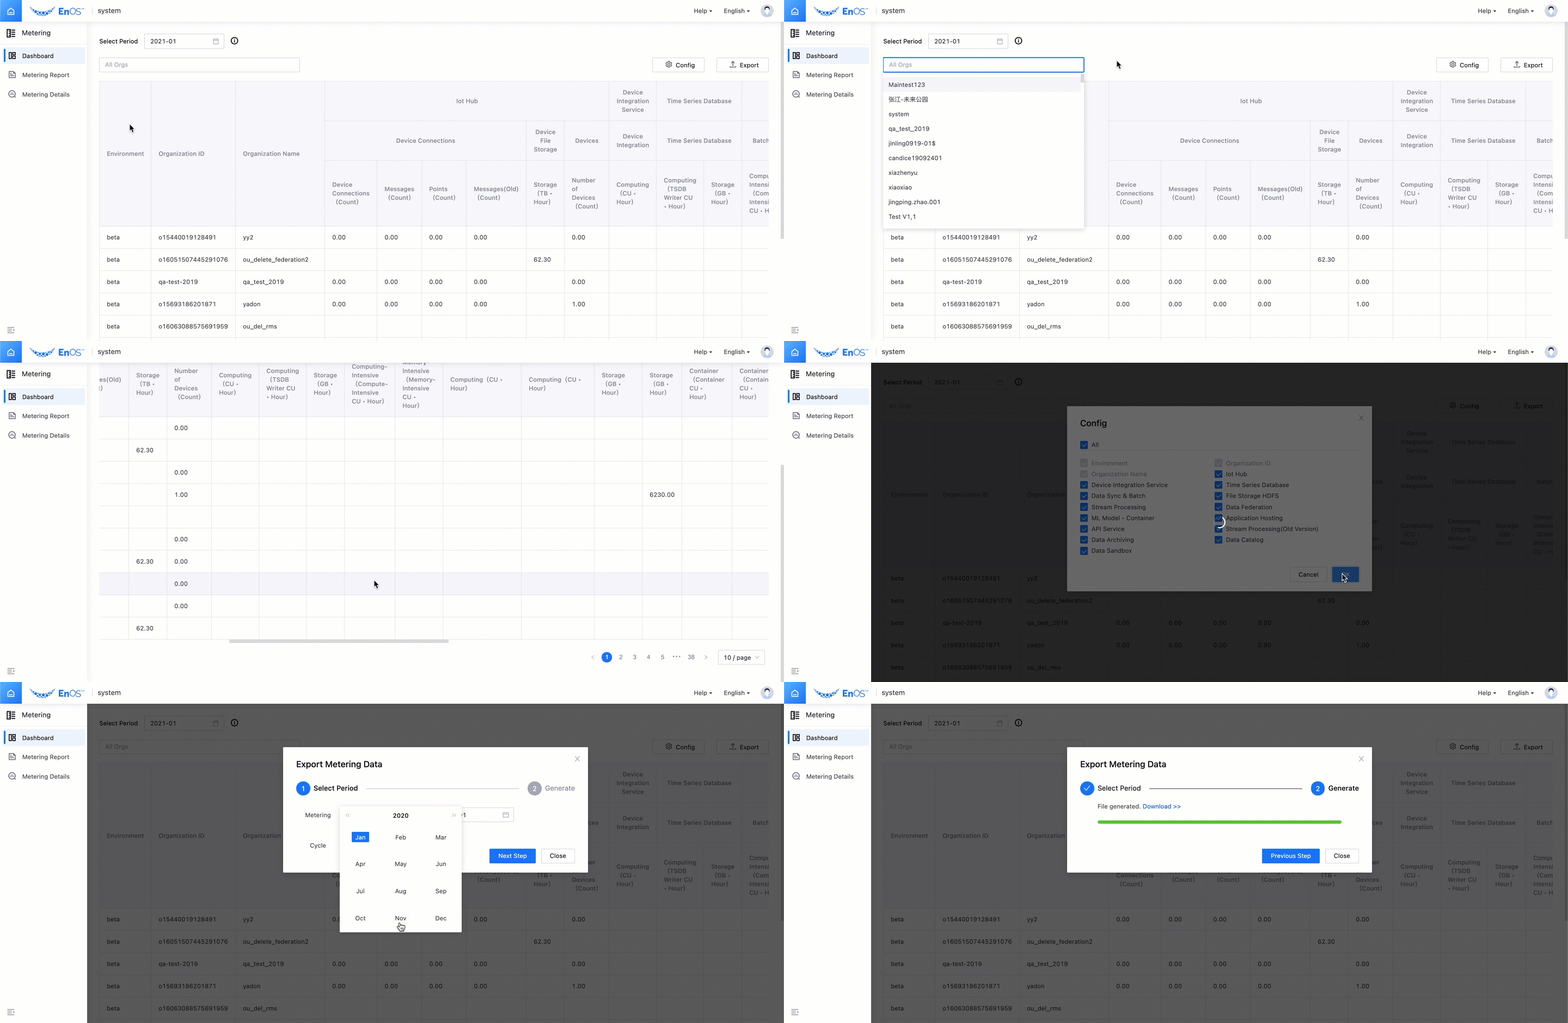
Metering Service Dashboard
The metering service dashboard can provide operators with the holistic statistical results on how each organization uses the resources and services on EnOS Cloud. Operators can flexibly view the information of each metering cycle, and can export and save the metering data. They can also view the metering statistics of the specified organization.
Audience
System administrator
Before You Start
You should have an EnOS system administrator account and have all operation permissions for message push management. See Policies, Roles, and Permissions.
Operations
Select Metering > Dashboard in the EnOS Management Console.

Filter Conditions
Metering cycle (to be calculated based on the local time zone where the platform service is provided): Select a year and month from Select Period to display monthly data in the selected time range.
OUs: You can select one or multiple OUs in the current time zone. The data for all OUs are displayed by default.
Services: Click the Config button to select the service. All services are selected by default.
Export
In the EnOS Management Console, select Metering > Dashboard, click the Export button, and then select the metering cycle in months to export the statistical metering data for the currently selected filter conditions.