What’s New in R2411?
This section introduces the new services and features included in EnOS R2411.
Application Building
Application Portal
Application creators can contact the system administrator to configure email templates for the domain or the OU.
Digital Twin Visualization
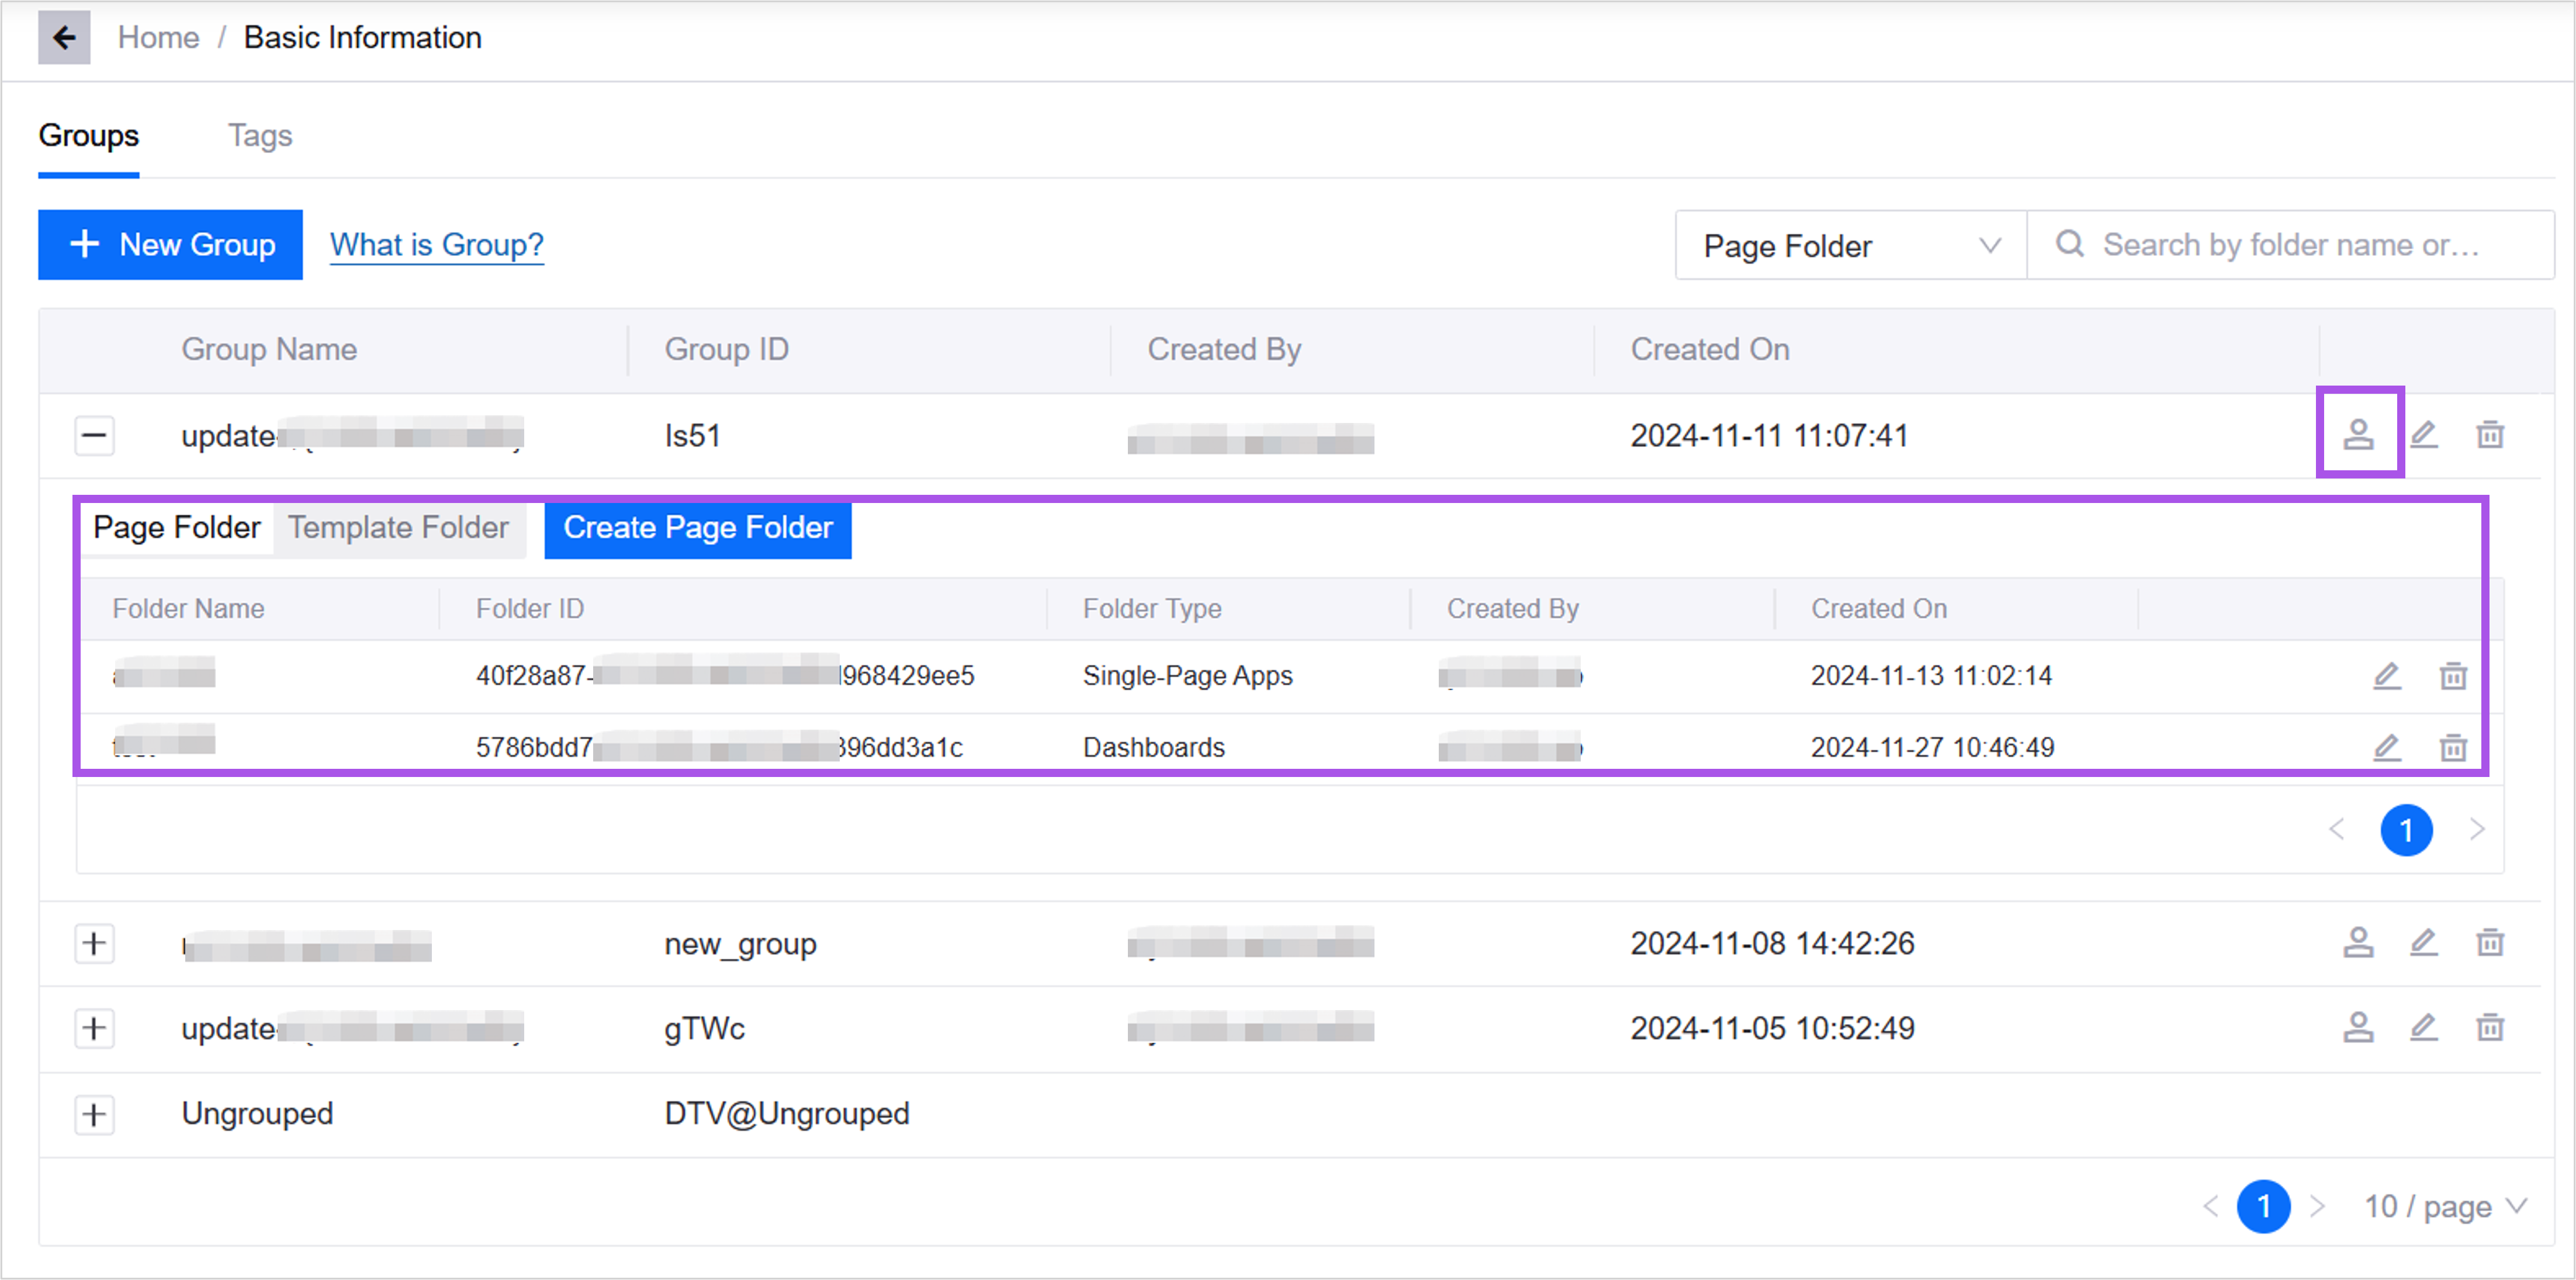
Added Page Folders and Template Folders for groups in Basic Information. Application creators can create and manage folders for each group, as well as assign viewing and editing permissions of groups. Only users with the permissions can view, edit, and use pages and templates within the group.
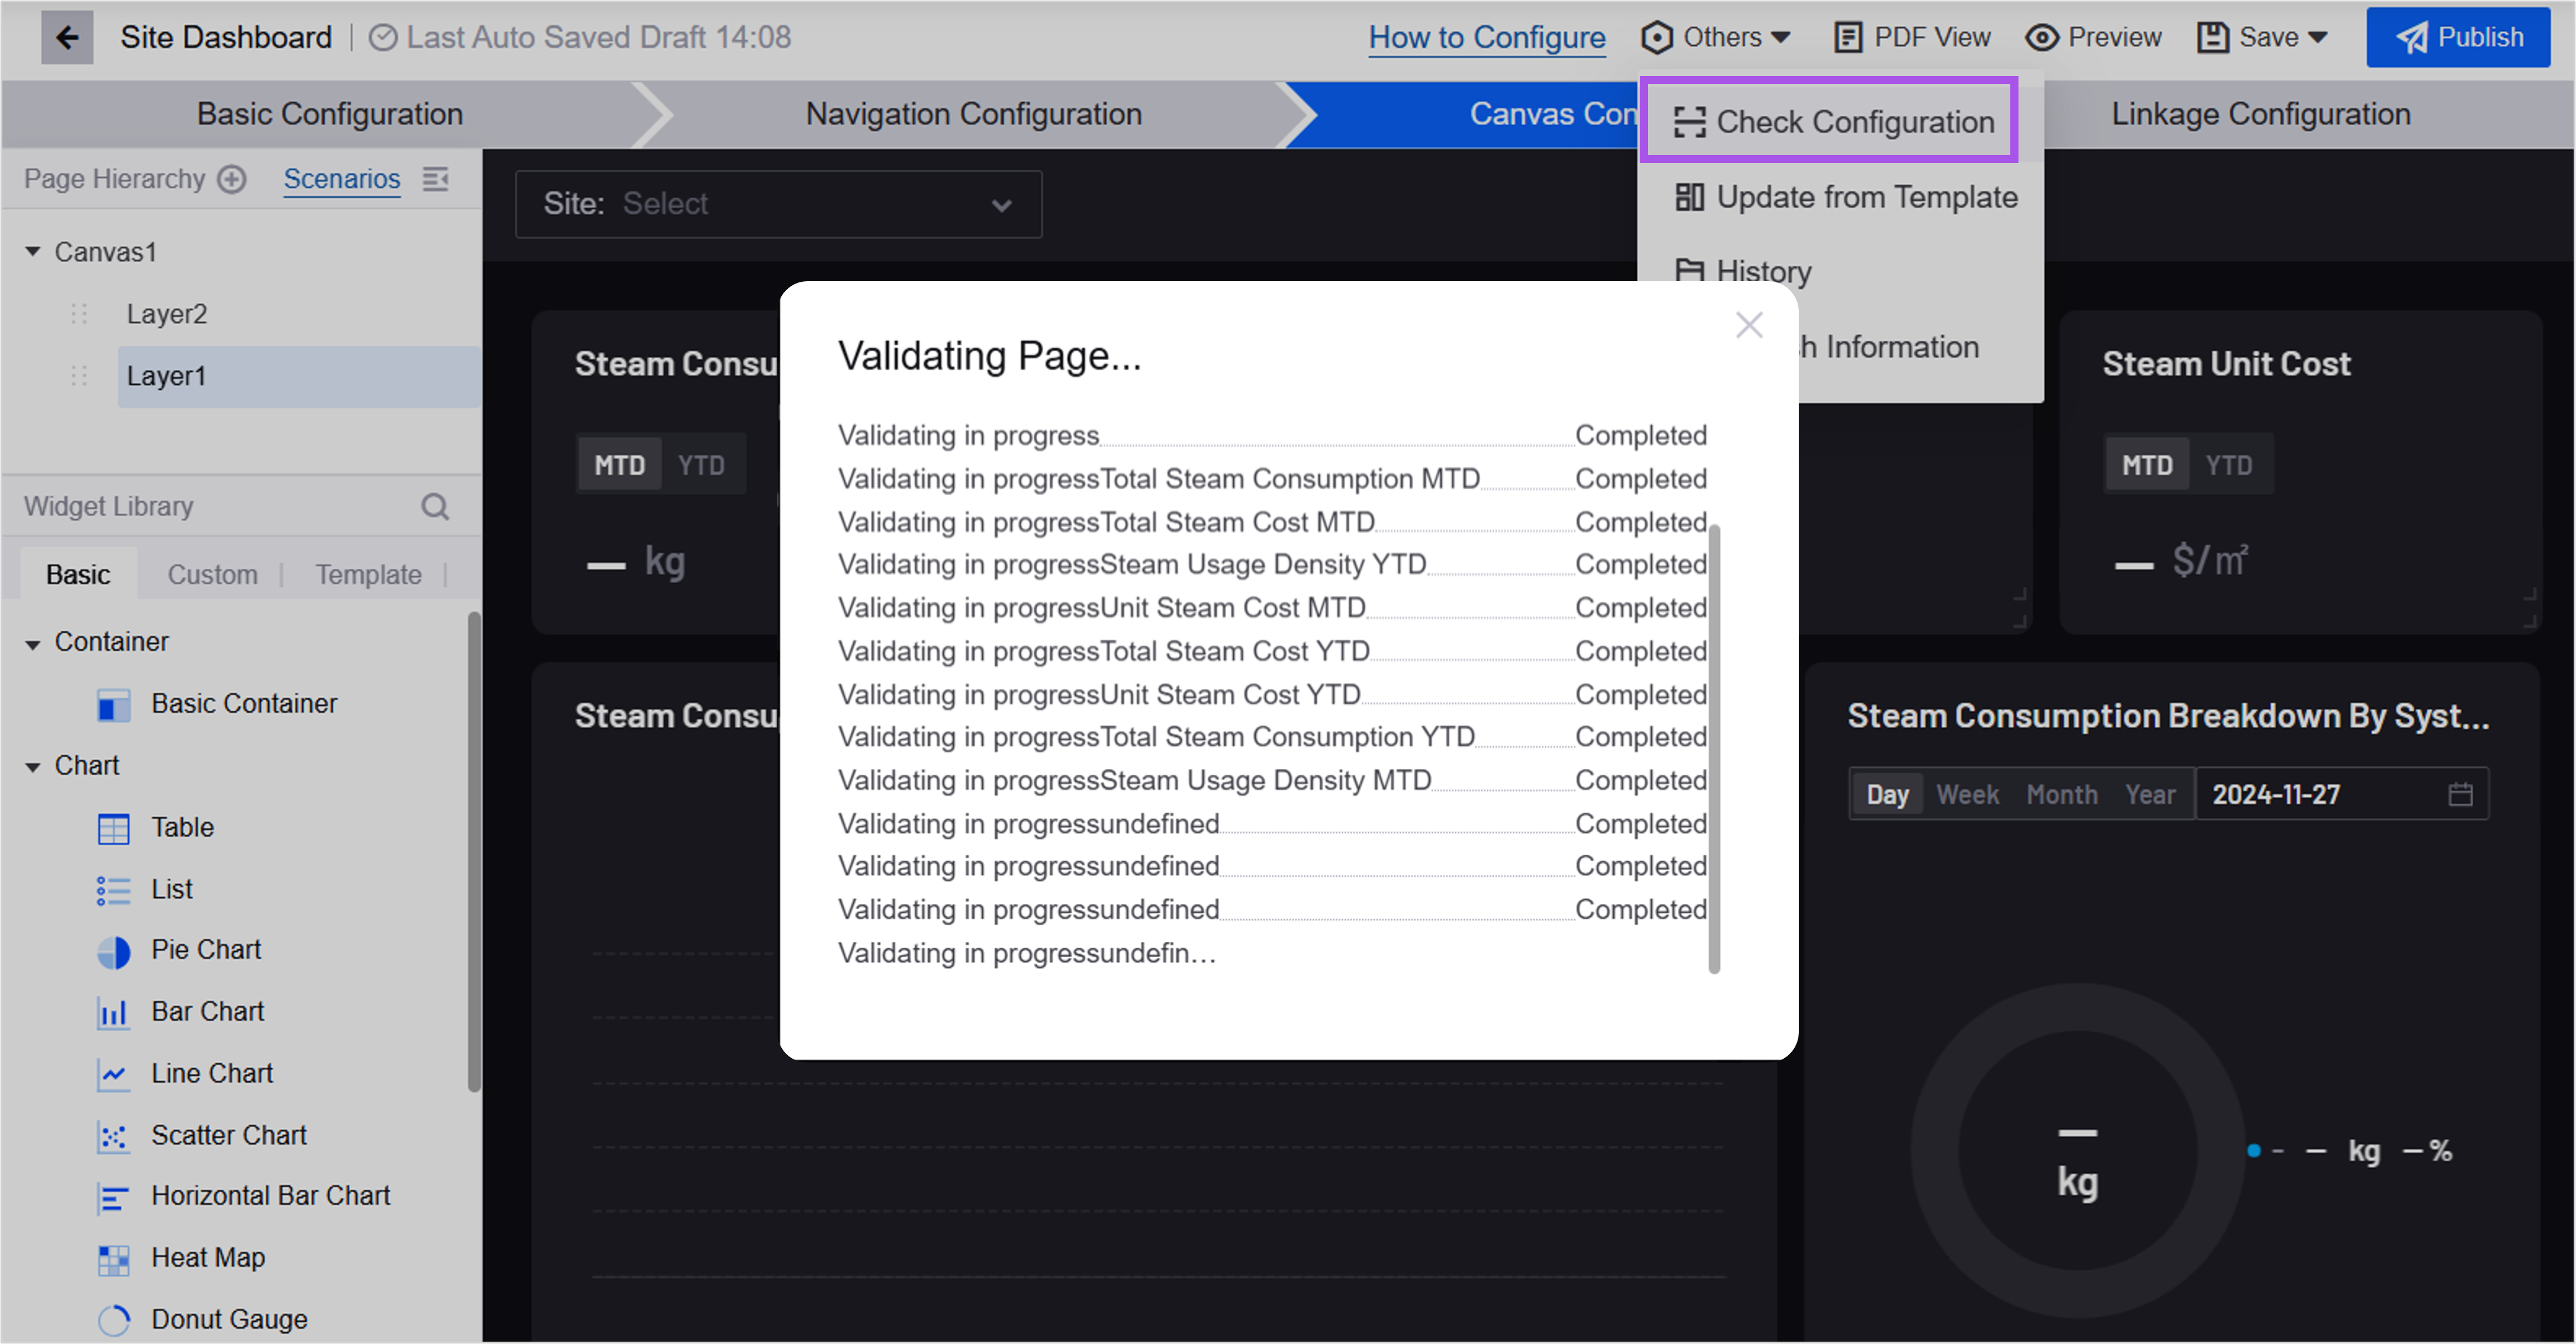
Added Check Configuration for Single-Page Applications. Before publishing the page, application creators can click to check whether the data-related configuration in the page is complete and valid, improving the configuration efficiency of the page.
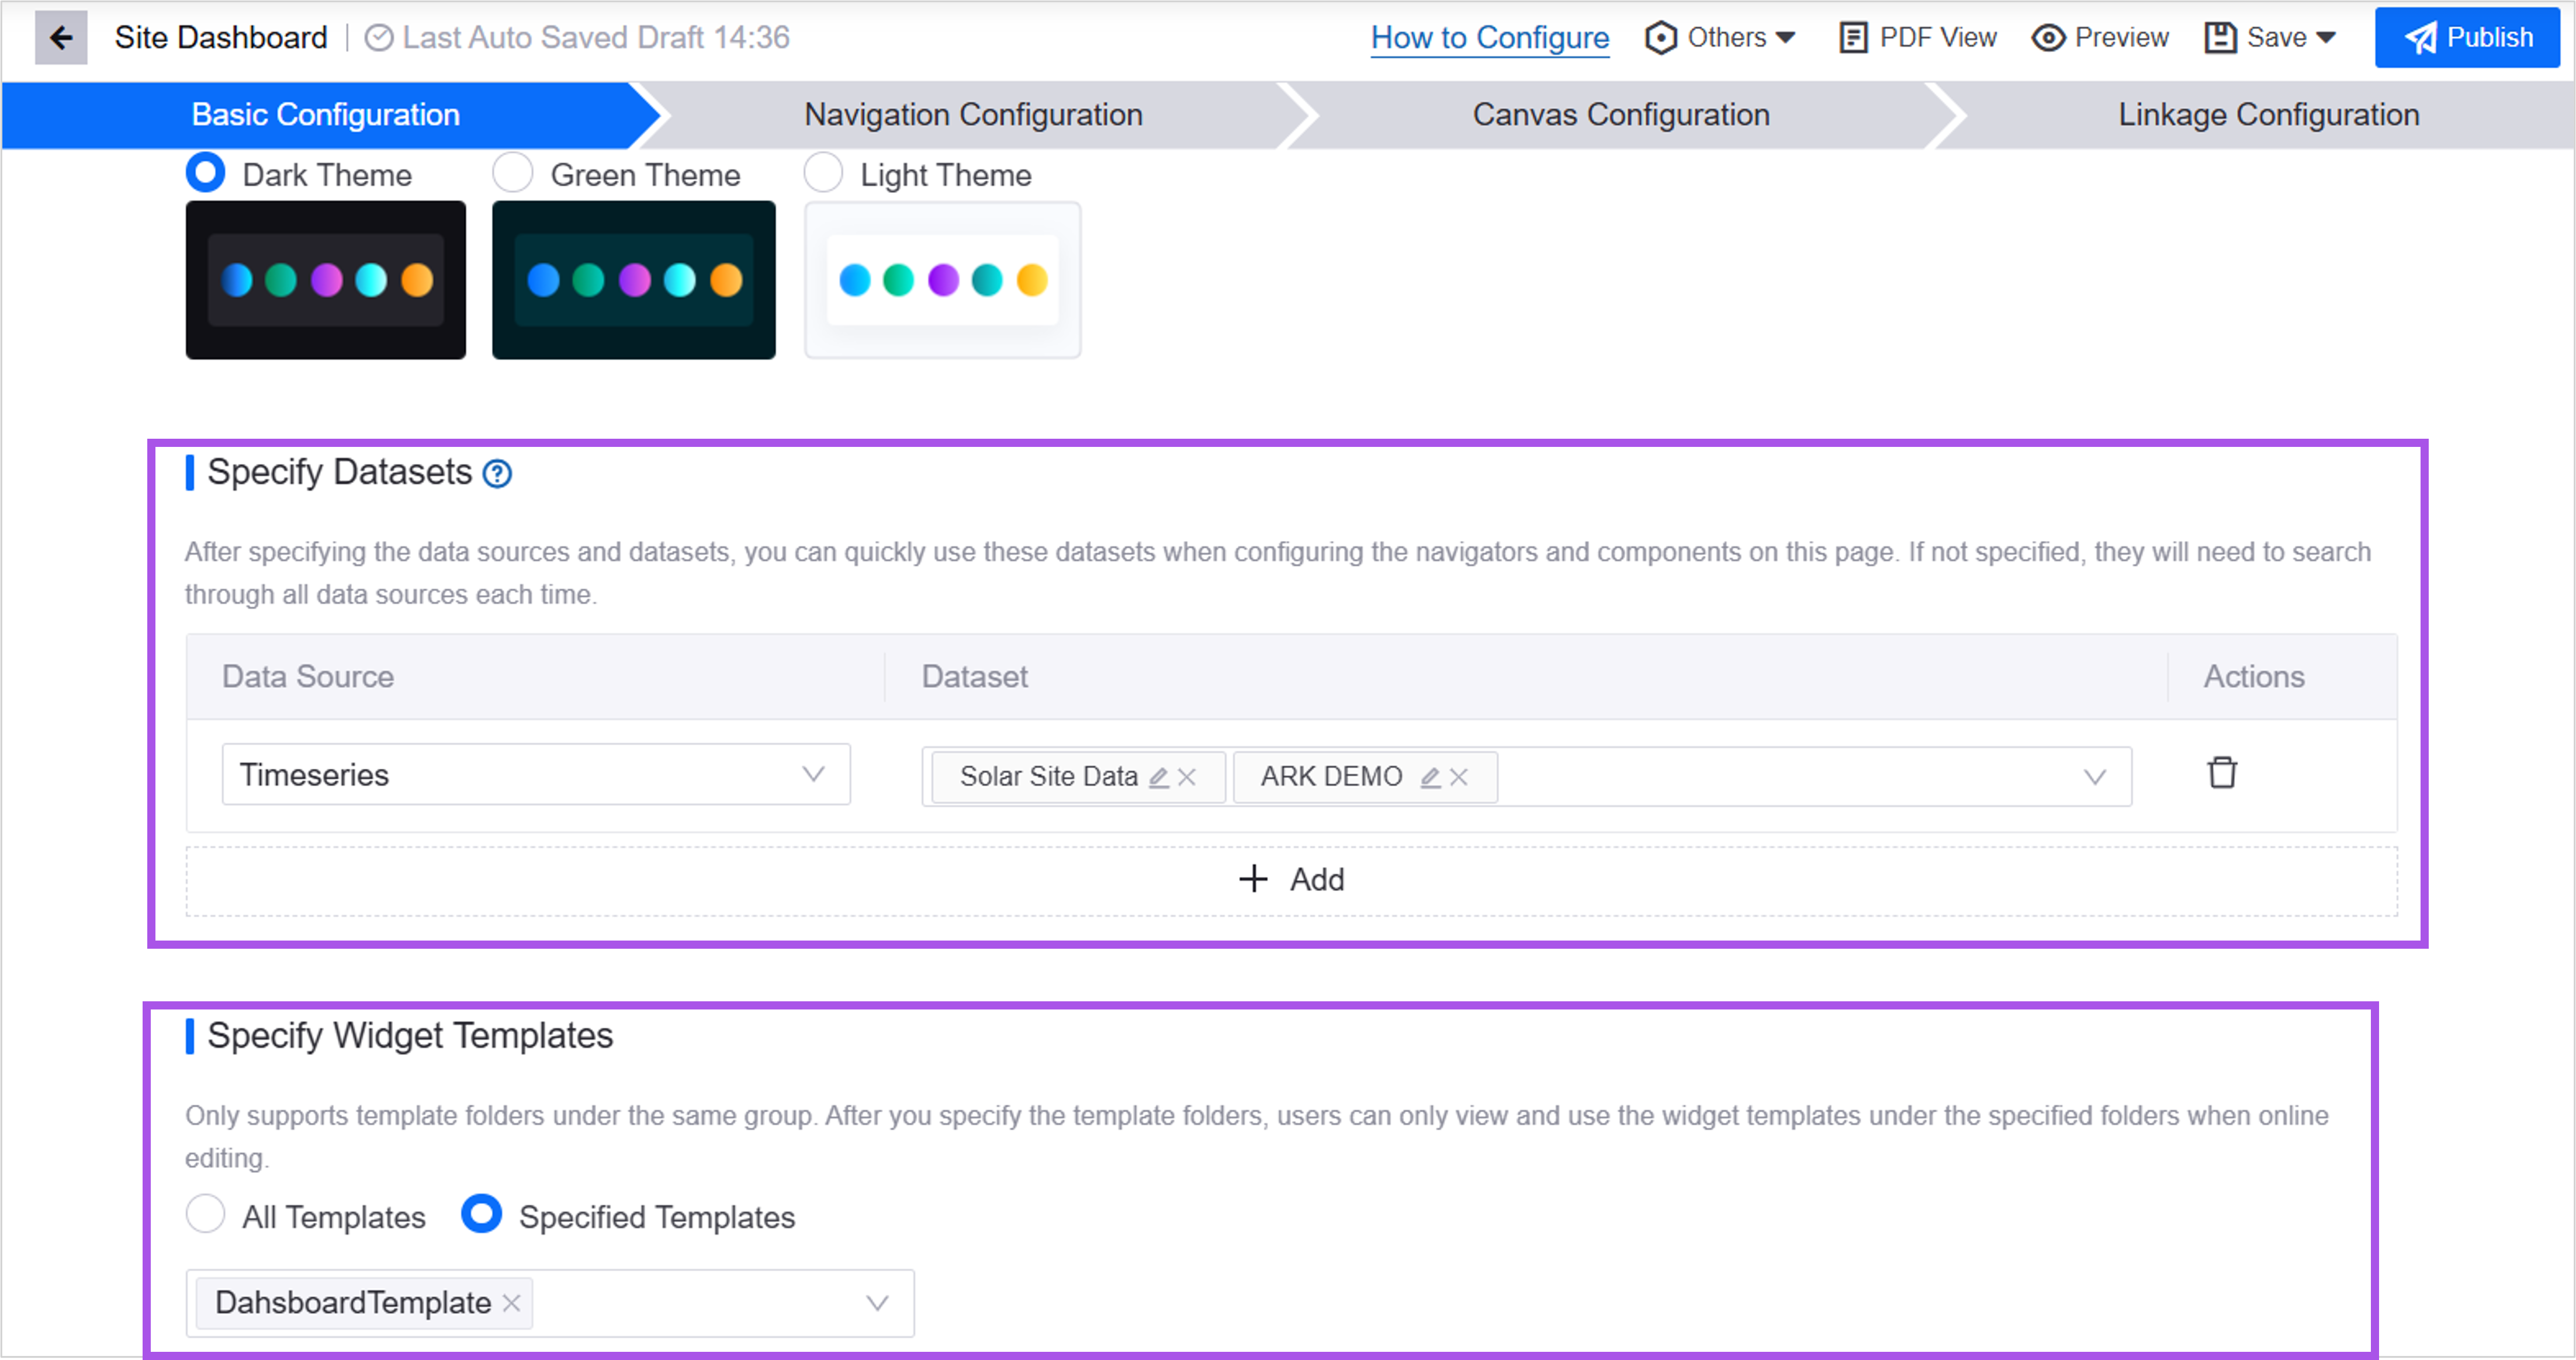
When creating Single Page Applications, application creators can pre-define the default datasets used by the page, as well as specify the widget template folders available for the page. When configuring the navigators and widgets, application creators can quickly select the pre-defined datasets, reducing the need for repetitive configuration steps. When users add widgets from the template library online, they can only view and use the widget templates in the specified folders, which controls the visibility range of templates for the users.
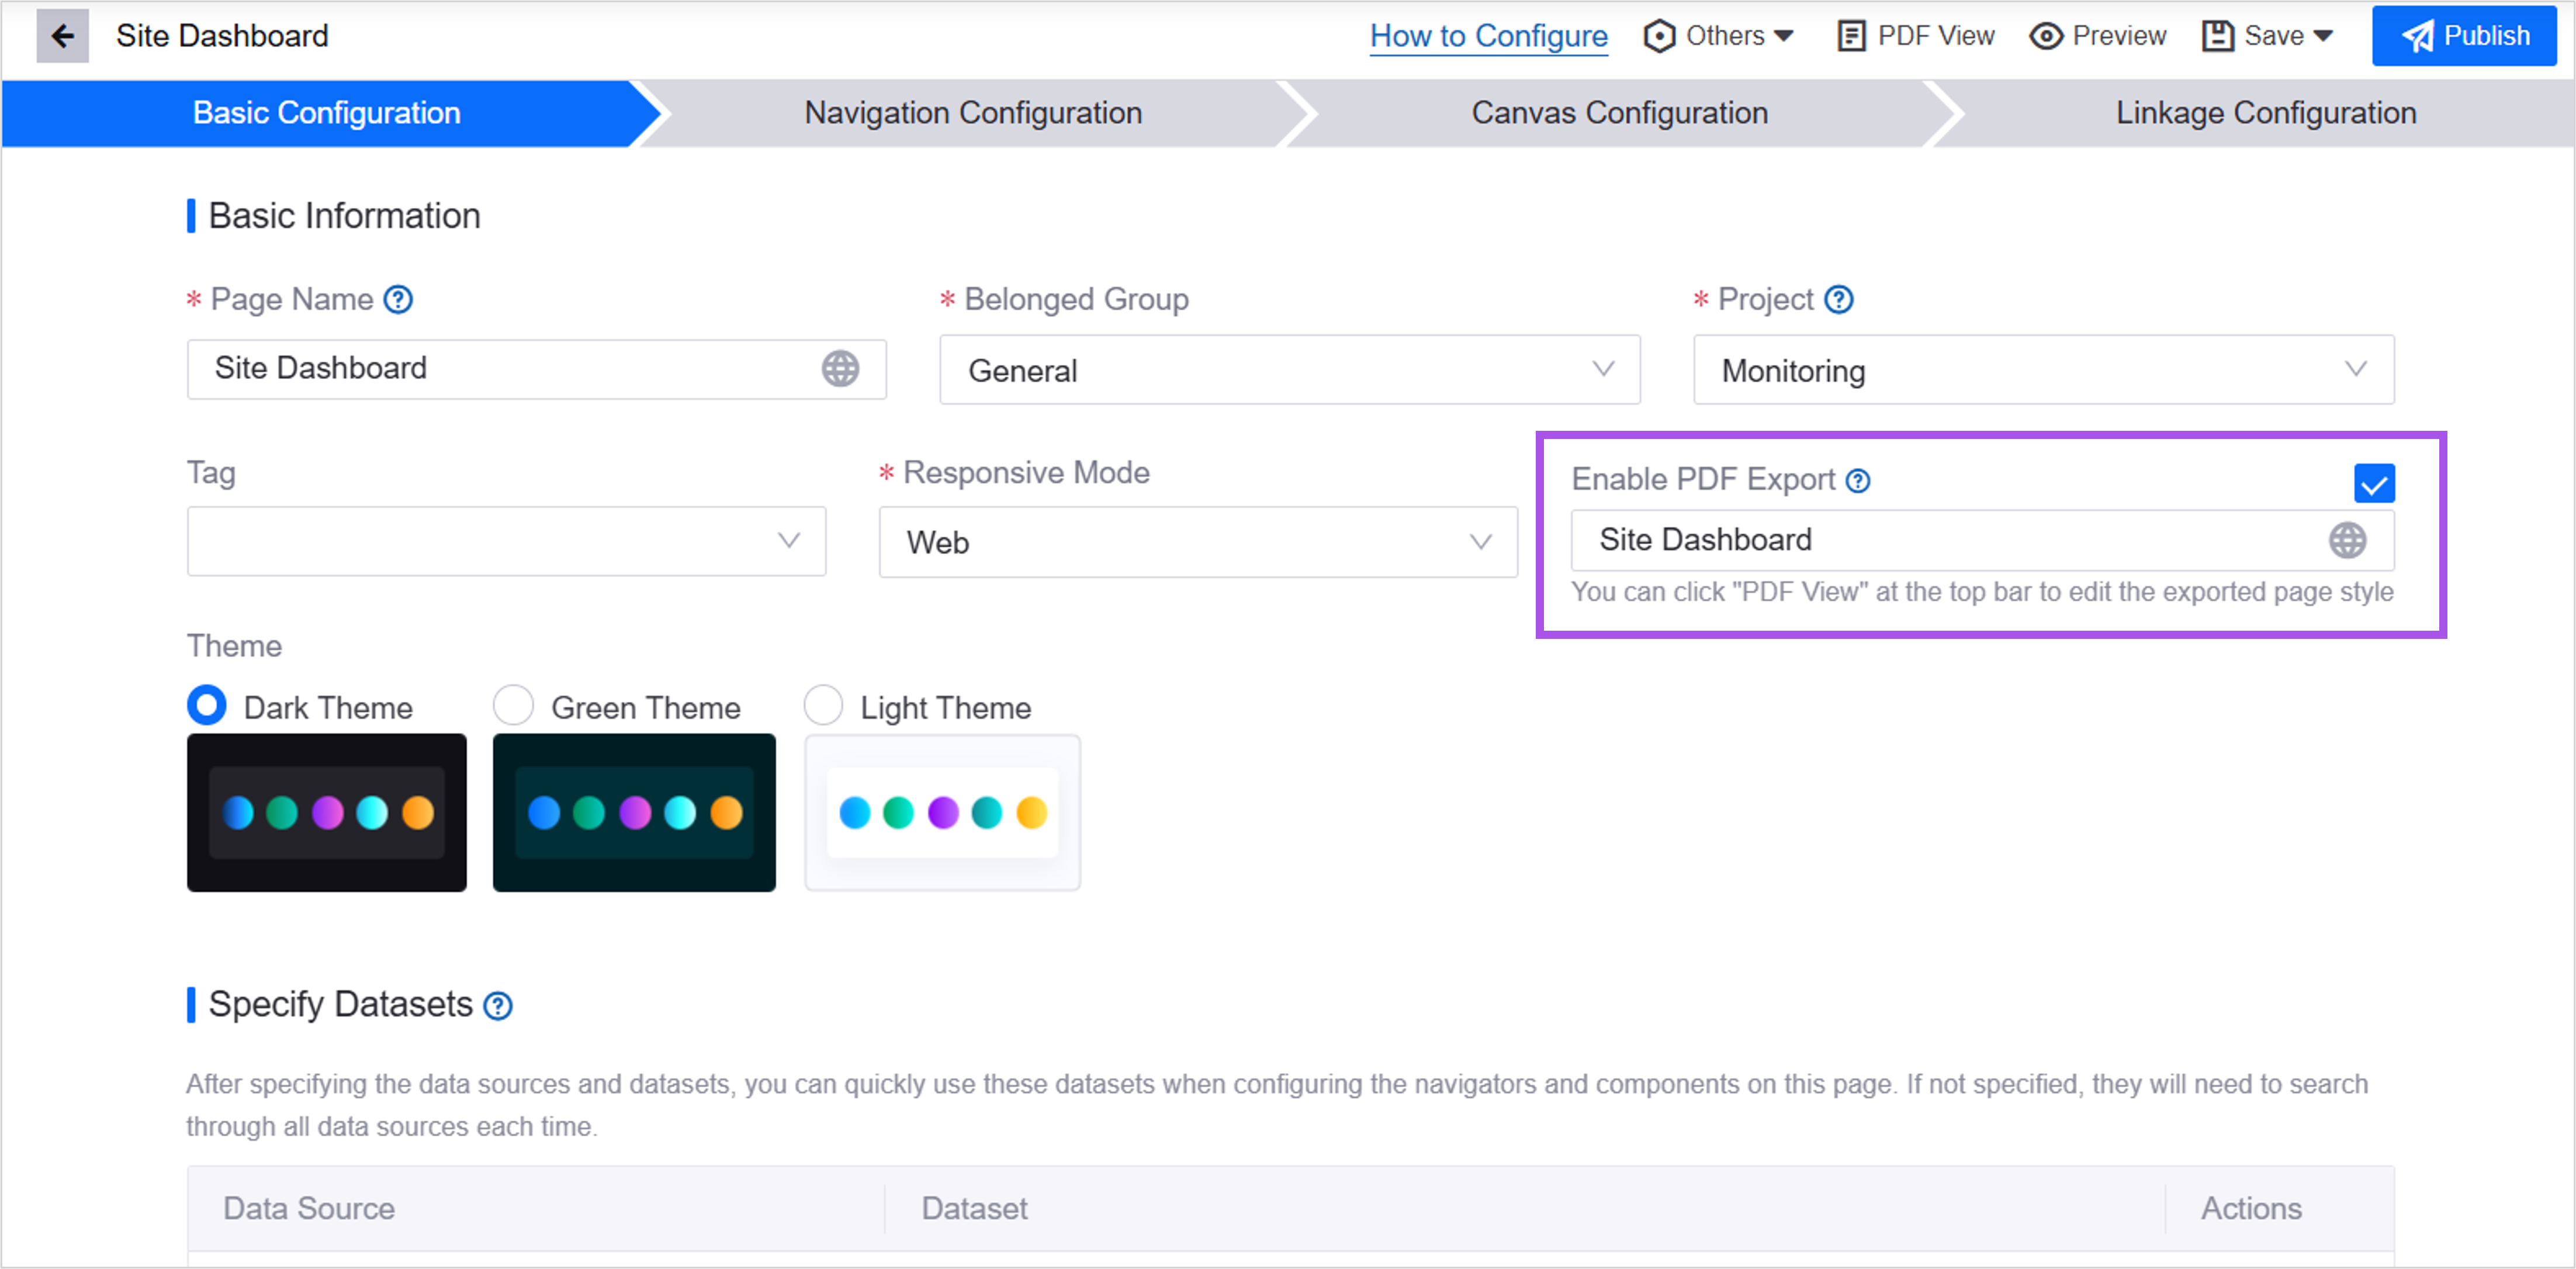
Added Enable PDF Export for Single-Page Applications. Application creators can style PDF views and define default names for PDF files. Users can export the single-page application page to a PDF file to view the page offline.
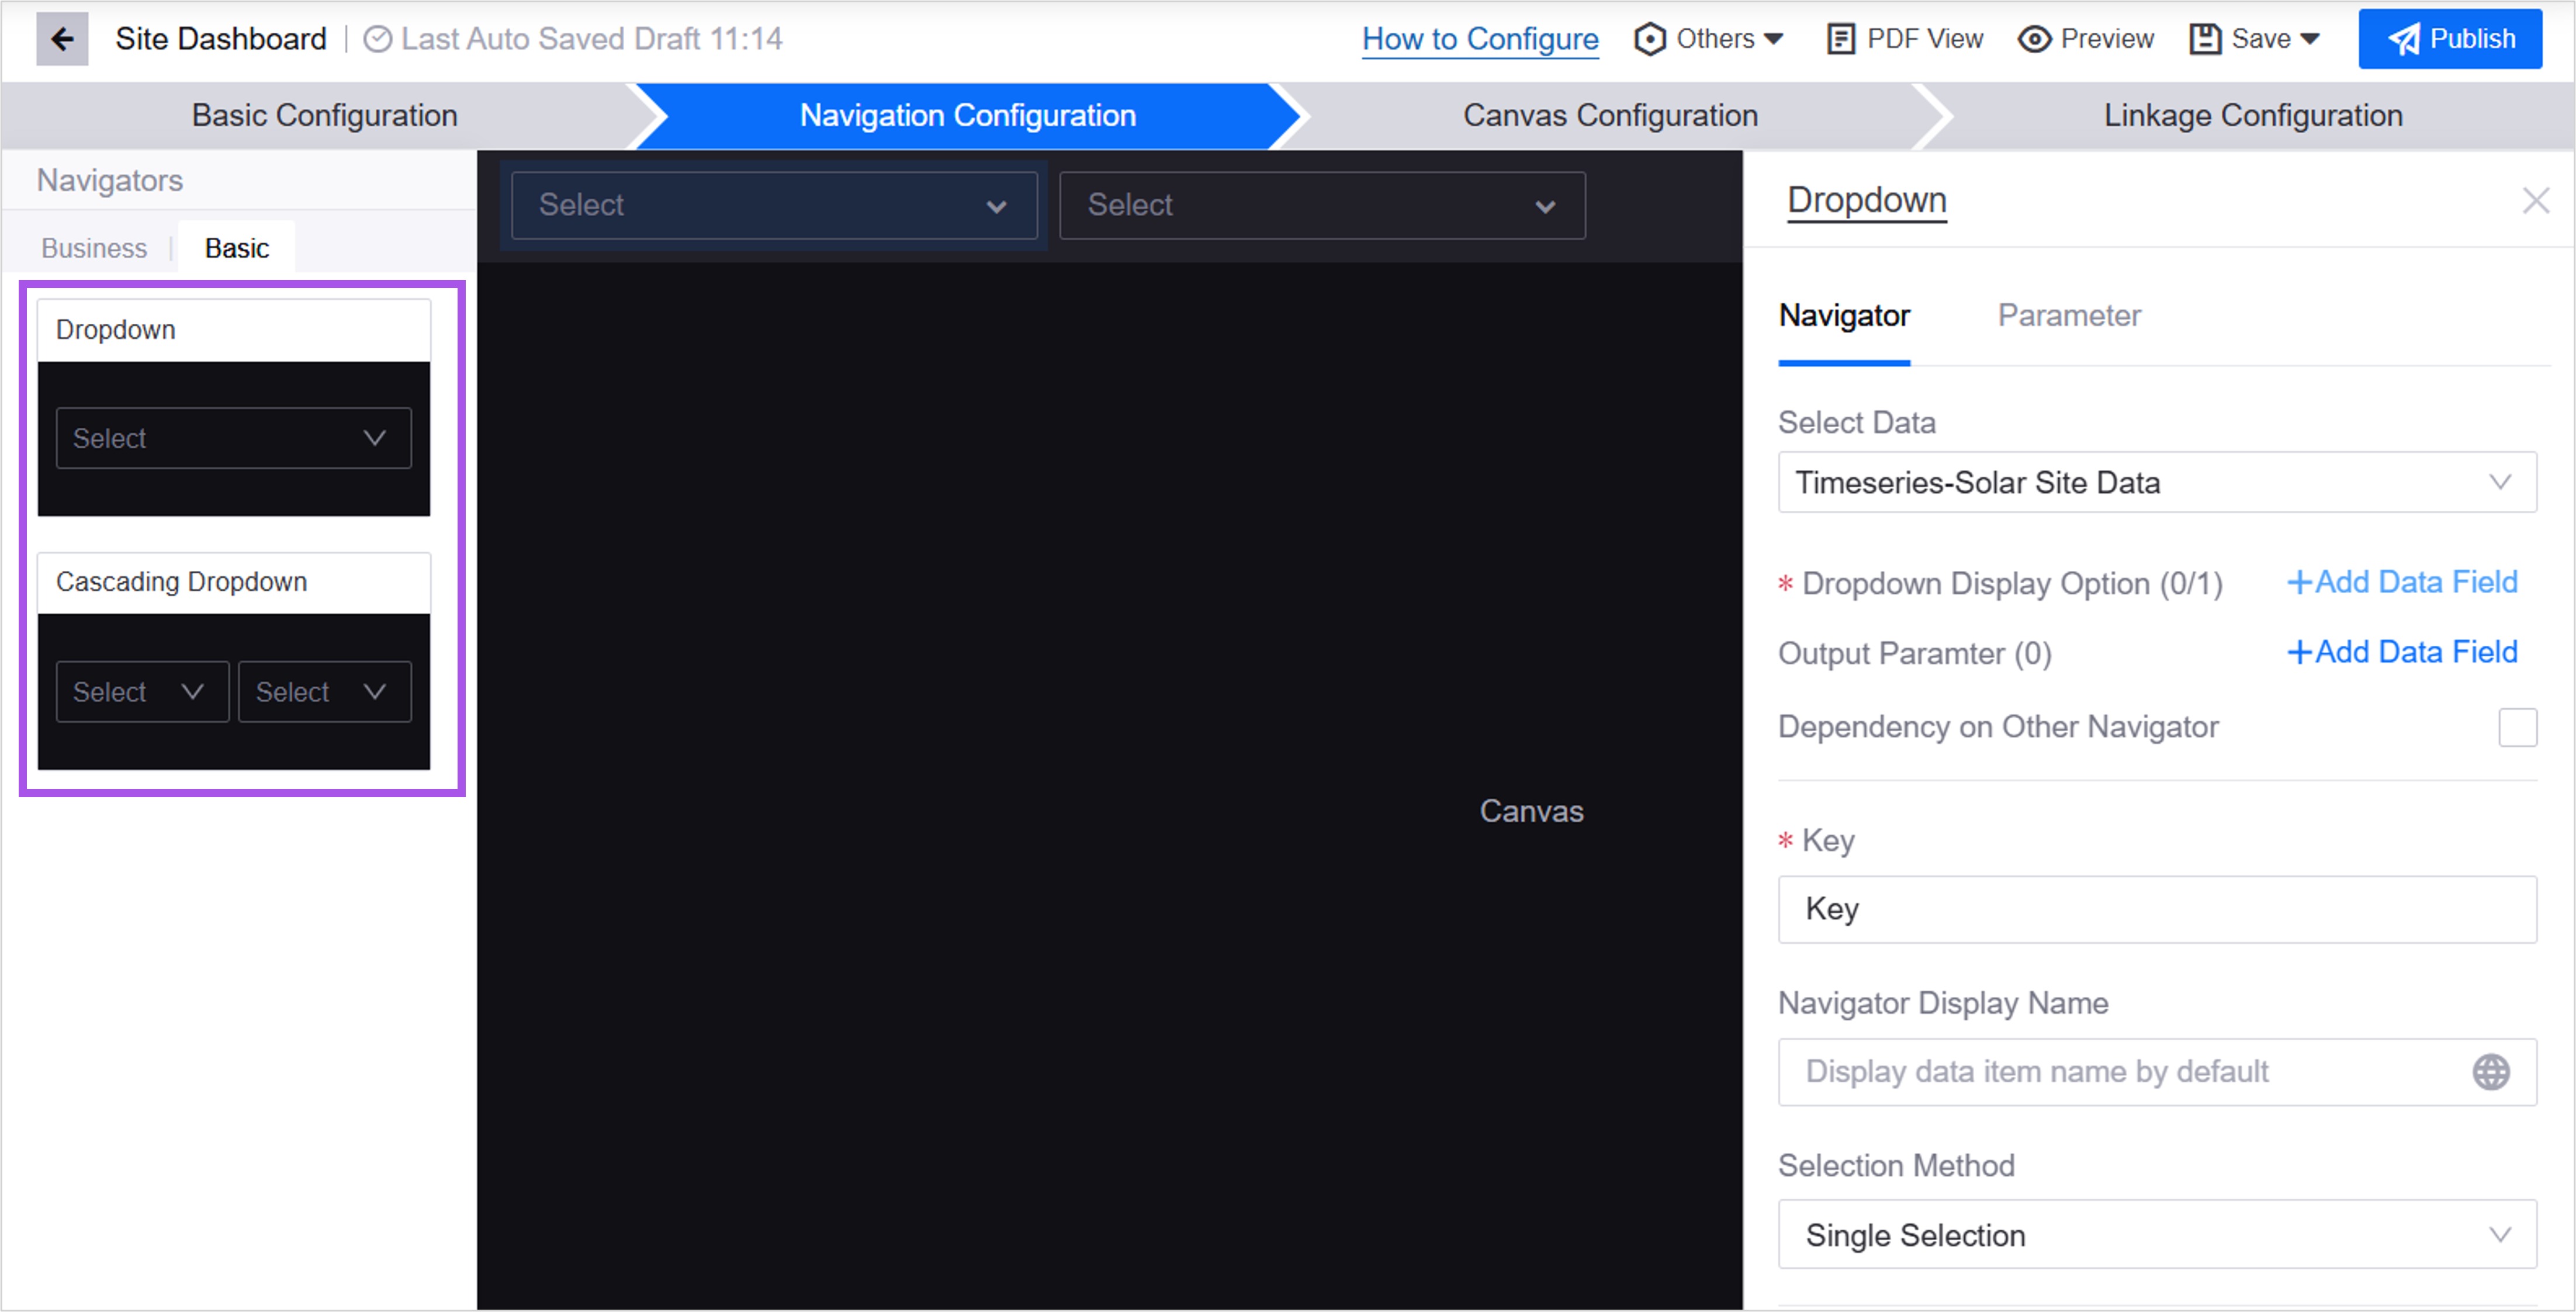
Added the Dropdown and Cascading Dropdown filters for Single-Page Applications. Application creators can configure the data sources, display options, and output parameters for the filters. When users switch the filters, the widget data in the page that meets the conditions can be switched at the same time.
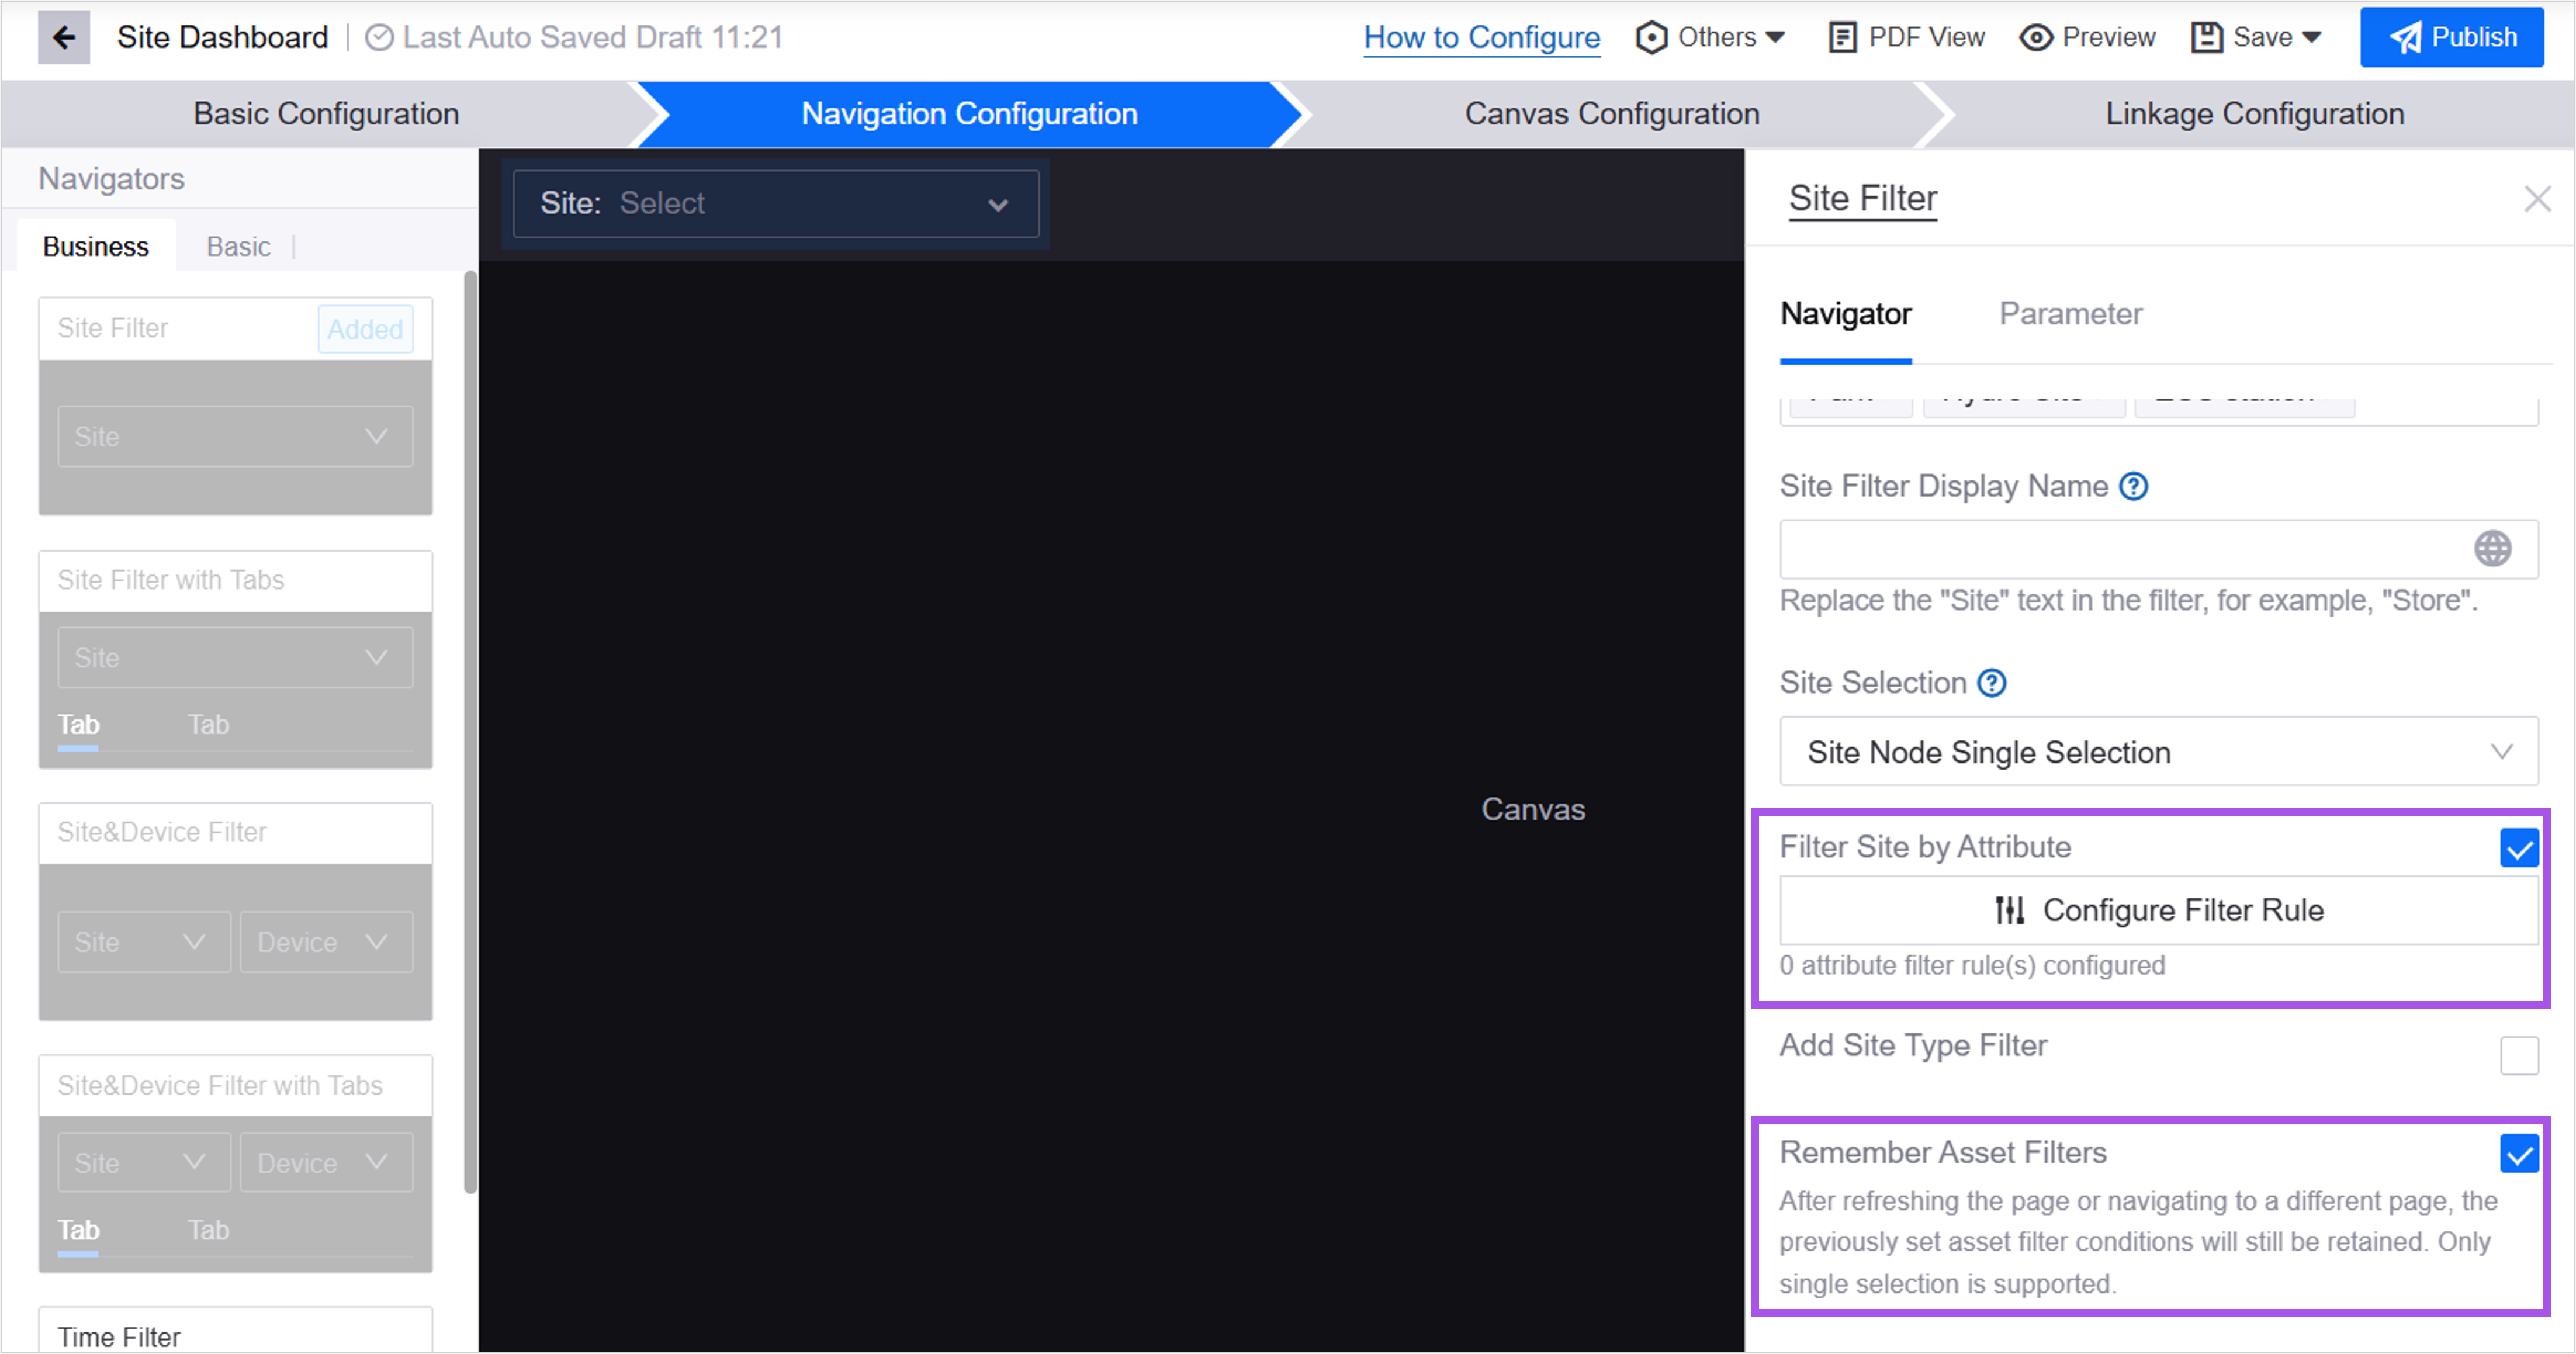
Application creators can specify attribute values as filter items in Business Navigators of Single Page Applications. After users select the filter item, the page will only display asset data with the same attribute value. Application creators can configure whether the page remembers the filter conditions for assets, time, and the current tab. When users refresh or switch the page, the page still retains the set filter conditions and stays on the current tab.
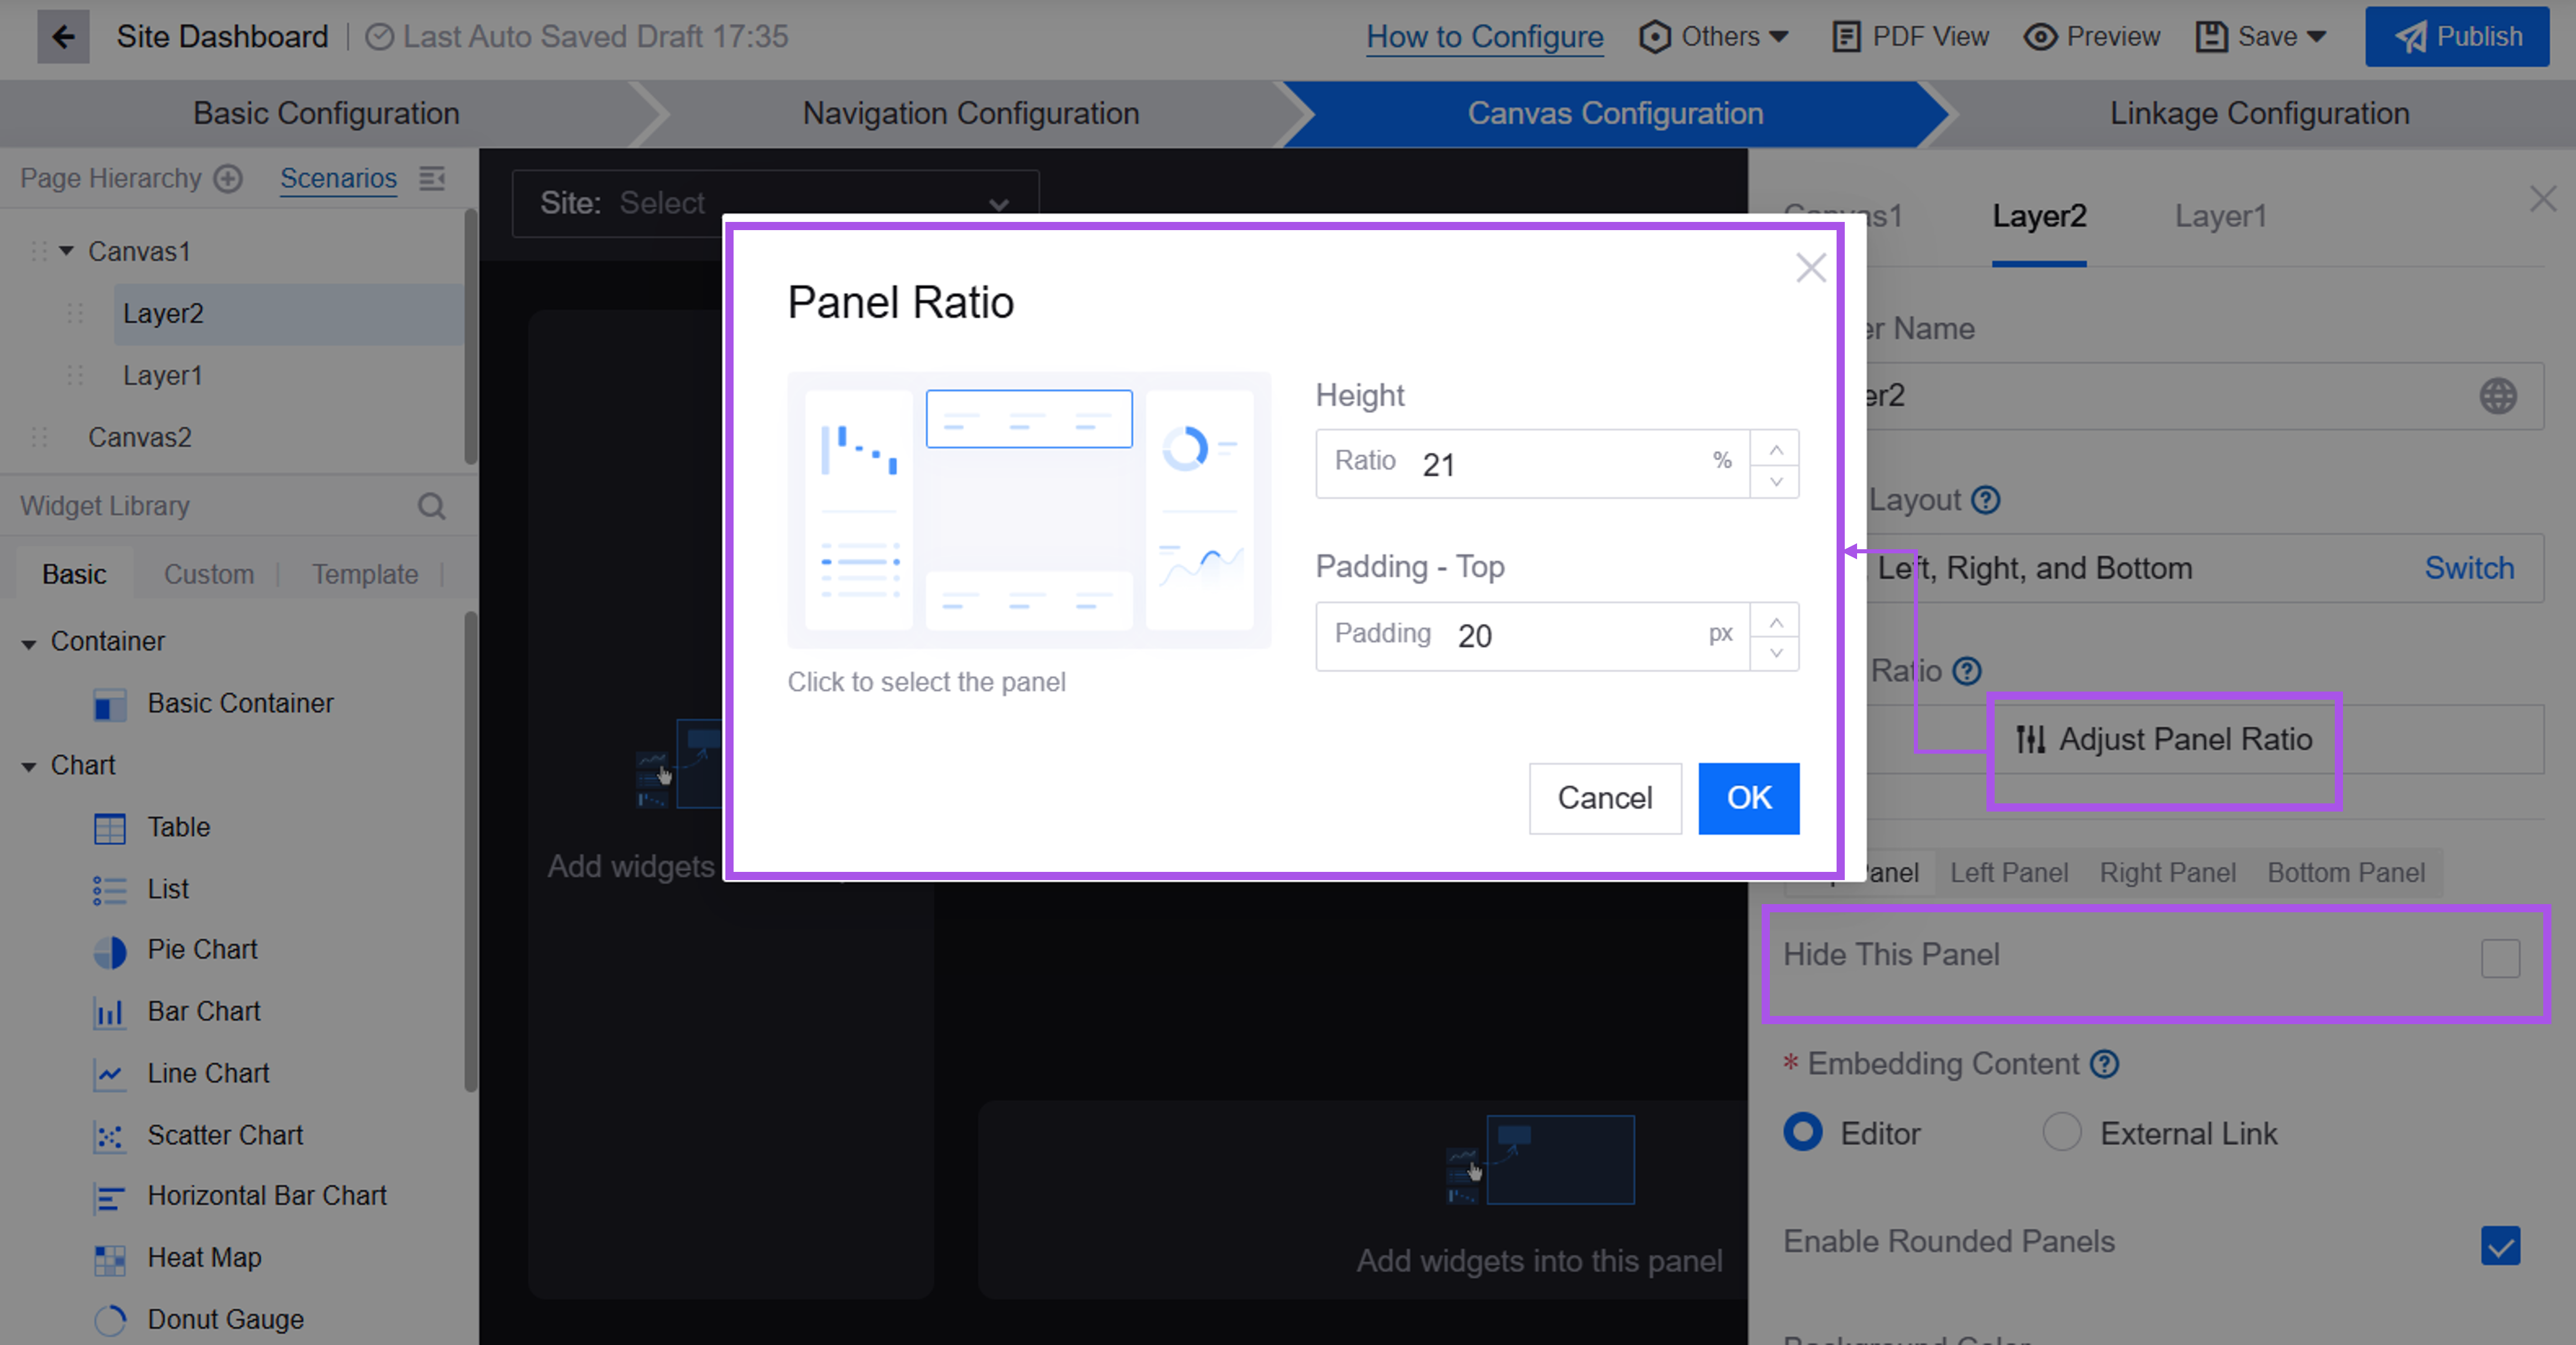
Added the upper-left-right-panel layout and all-around-panel layout in Single Page Applications. Application creators can switch layouts, adjust the width, height, and margins of each panel, or hide a panel to increase page layout flexibility.
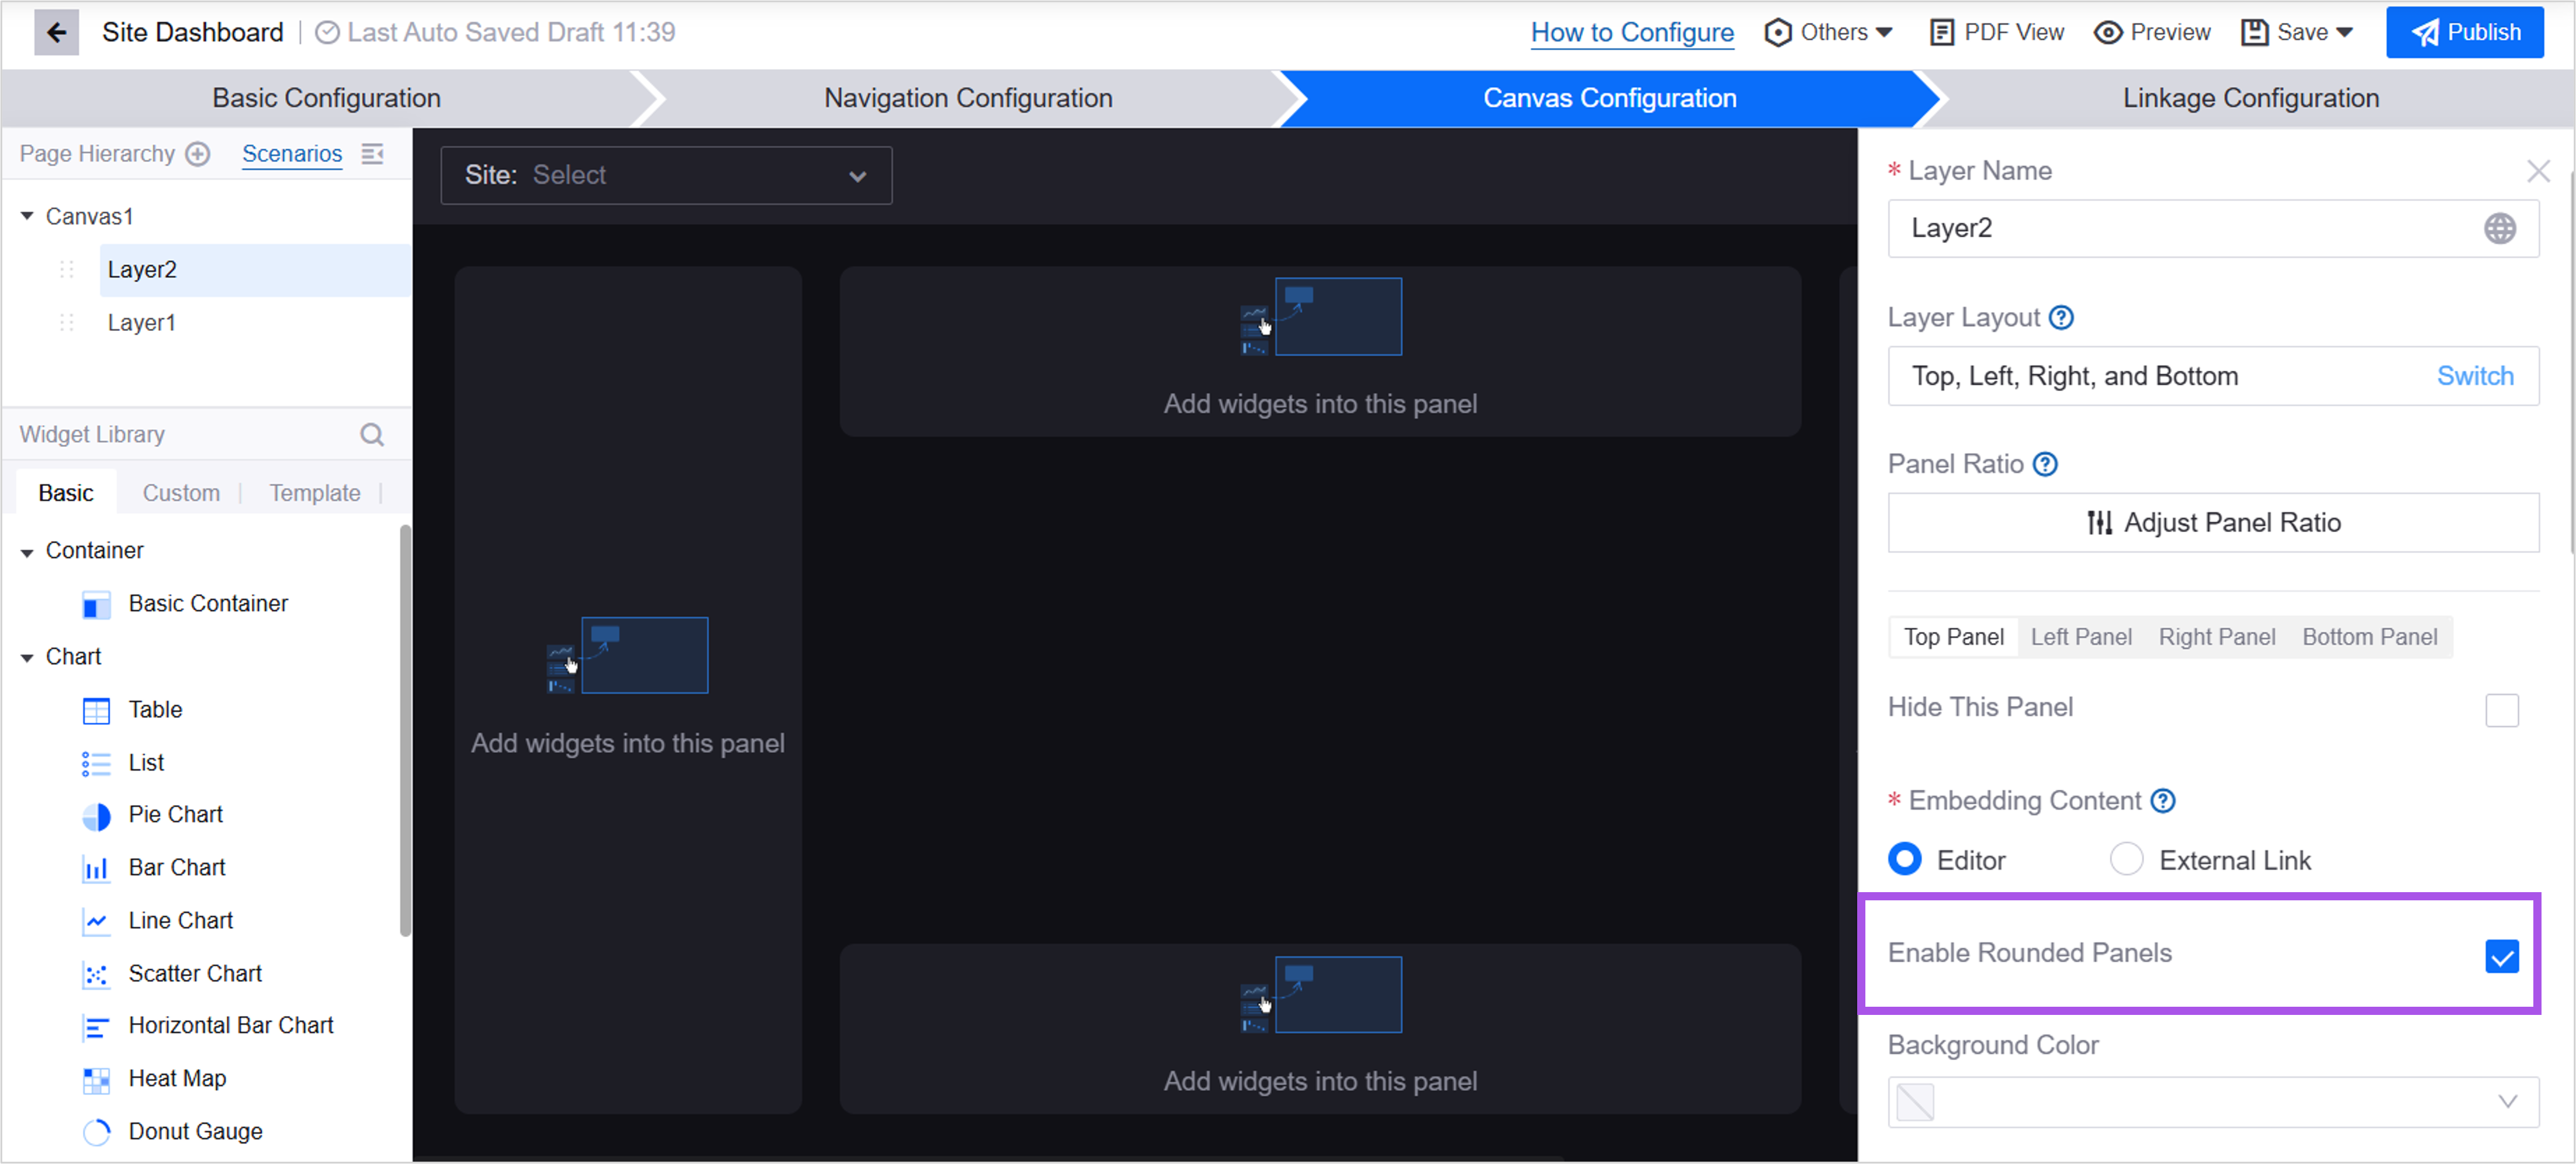
Application creators can set each panel of Single Page Applications as a rounded corner panel to enhance the overall aesthetics of the page.
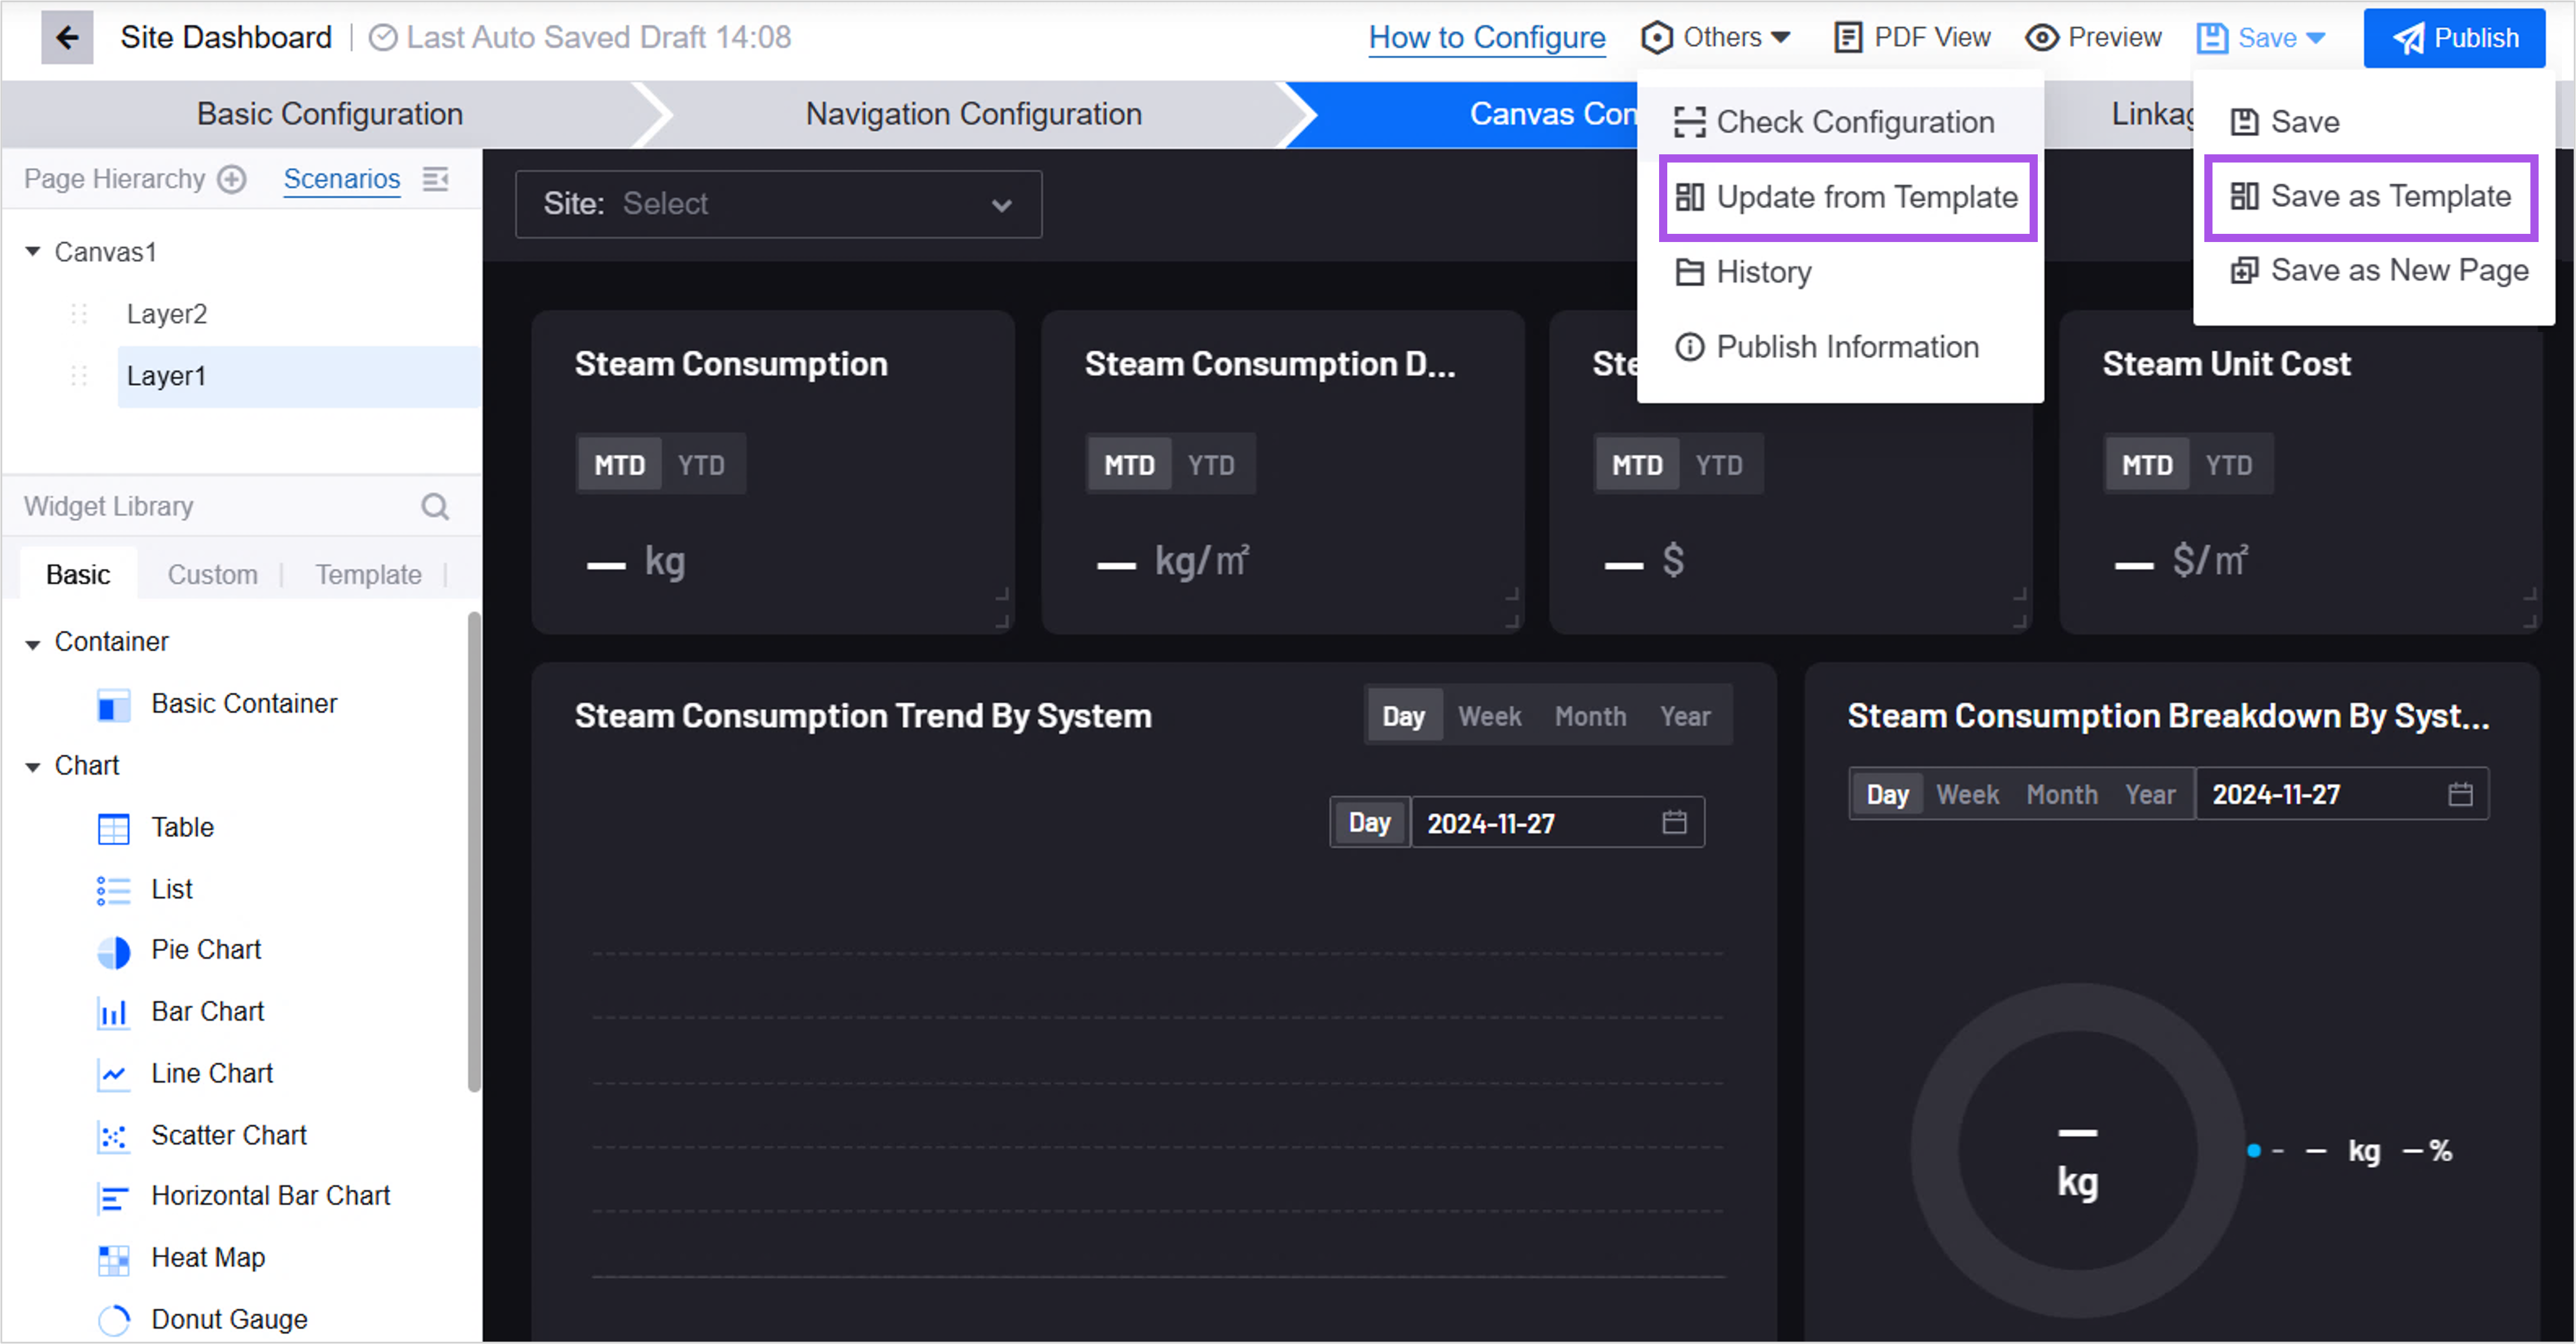
Application creators can save a Single Page Application page as a template, and use existing templates to overwrite the current page to improve the efficiency of page construction.
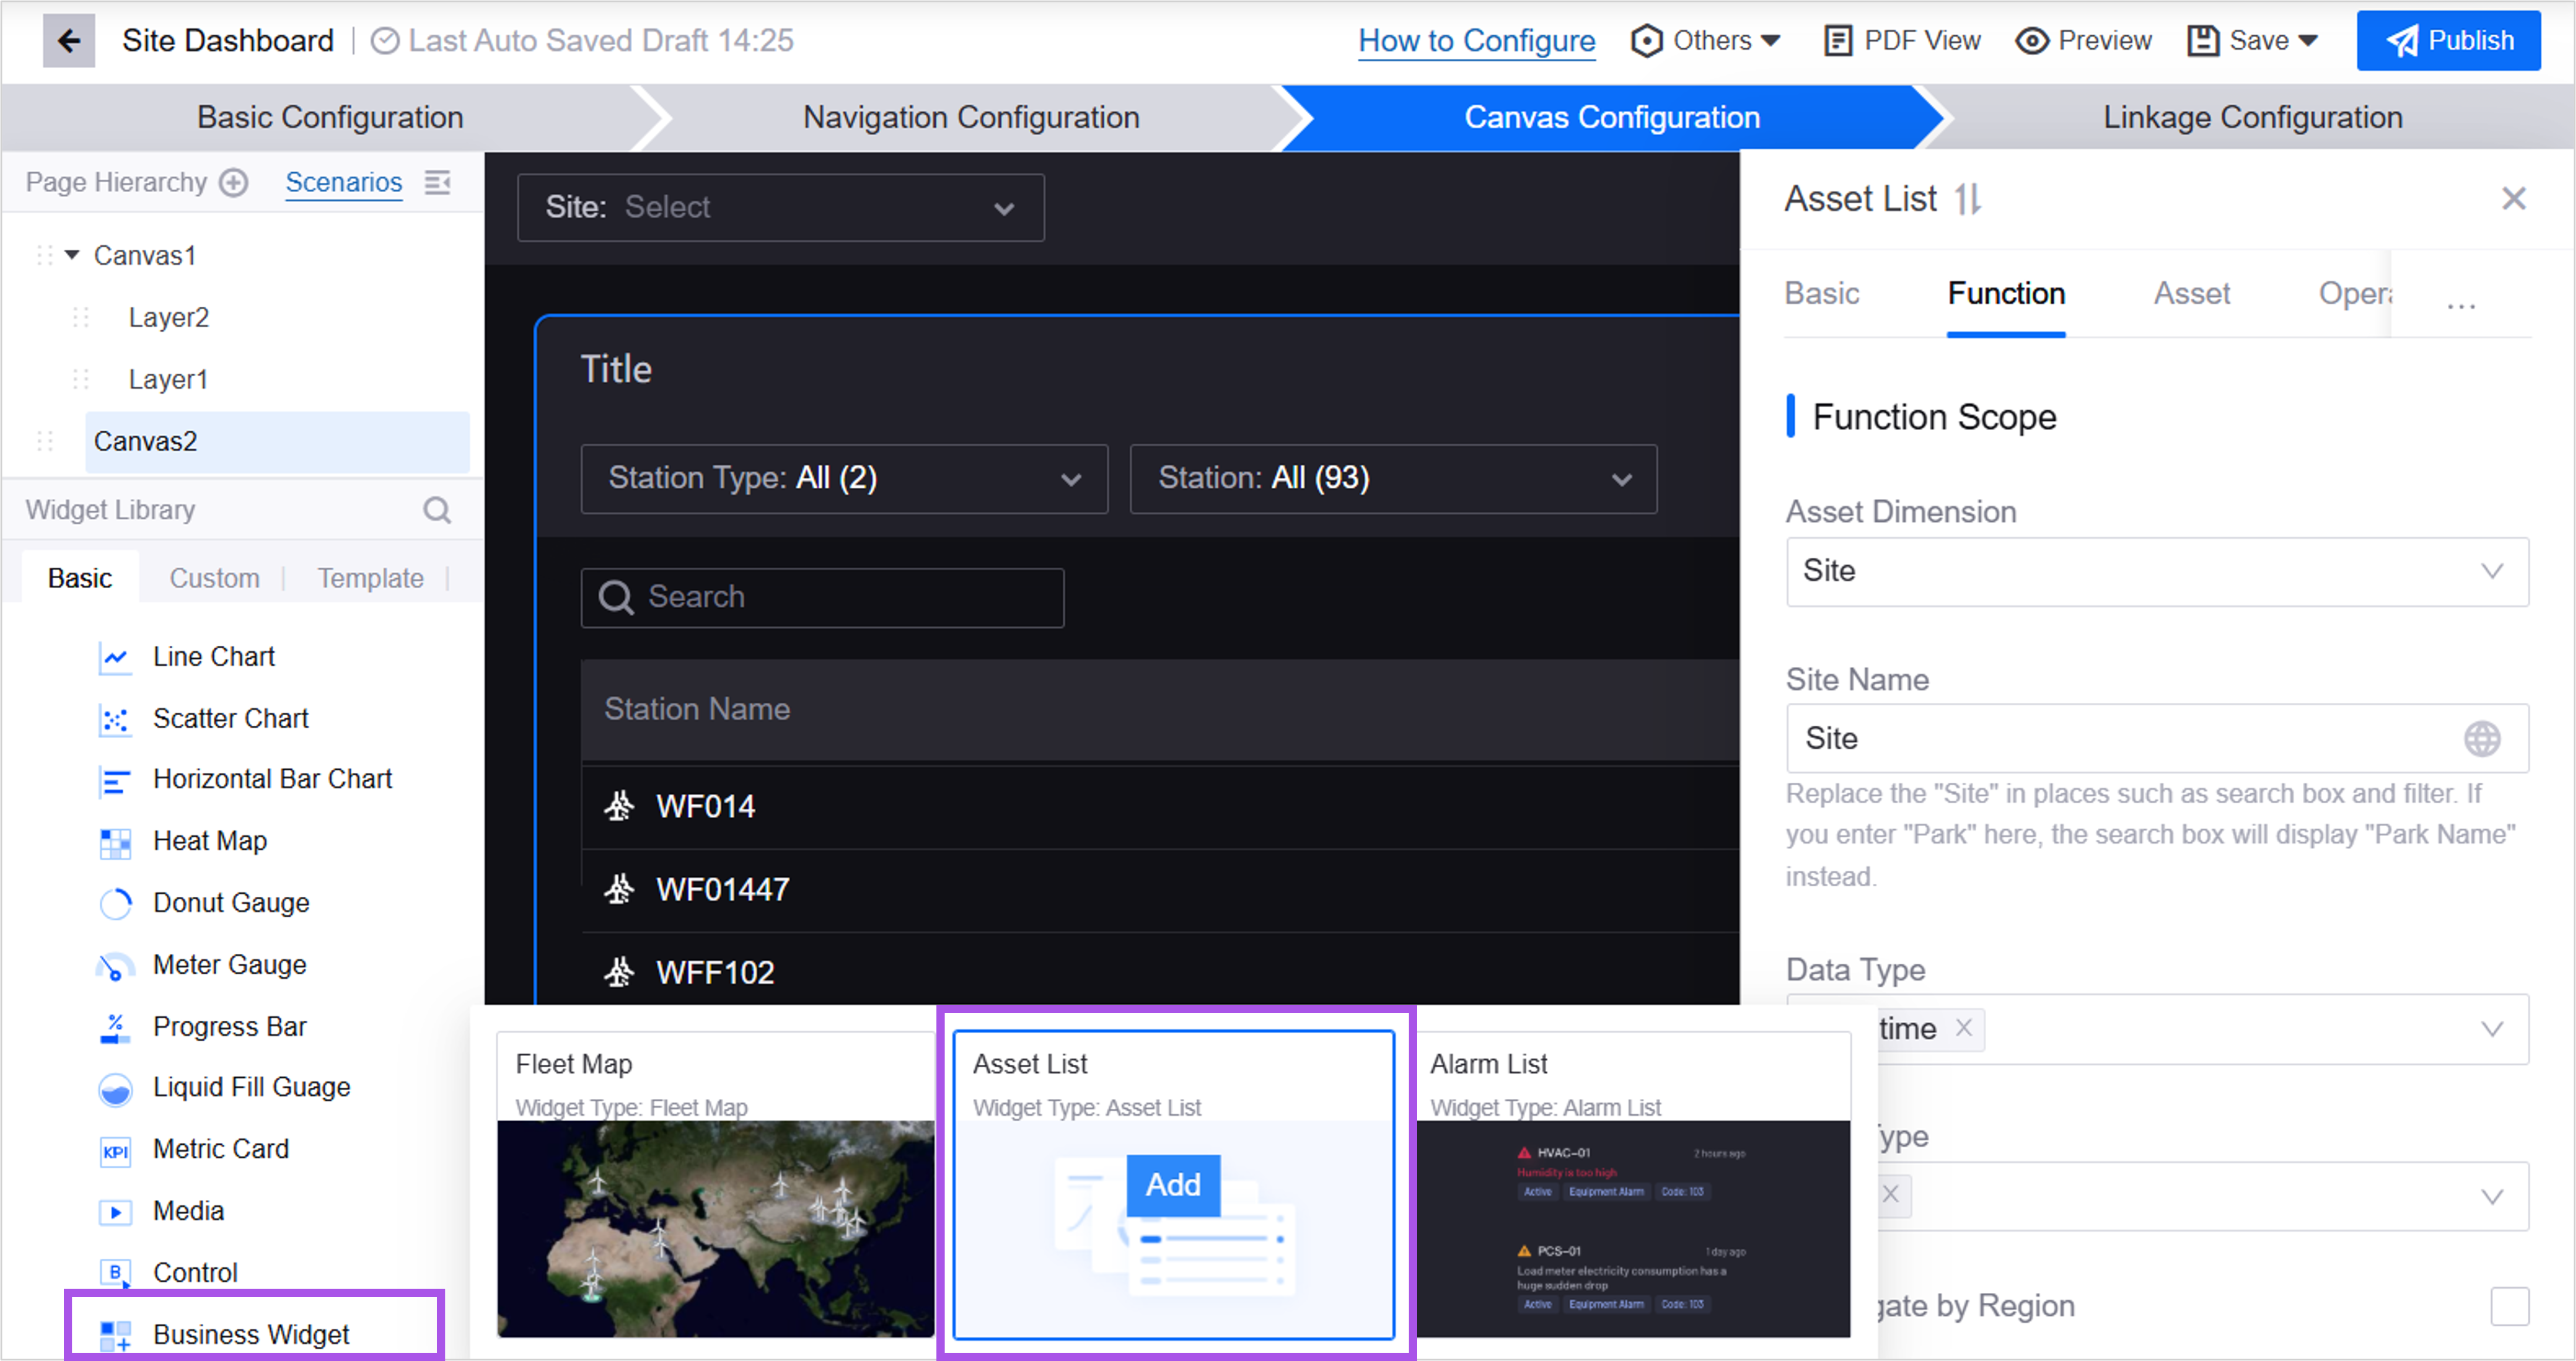
Added the Asset List widget. Application creators can configure asset scopes, function scopes, action buttons, etc in the widget to build lists of areas, sites, and devices in multiple domains. Users can centrally manage assets in various fields in the list, customize the ranking and summary of asset data, and quickly filter abnormal data.
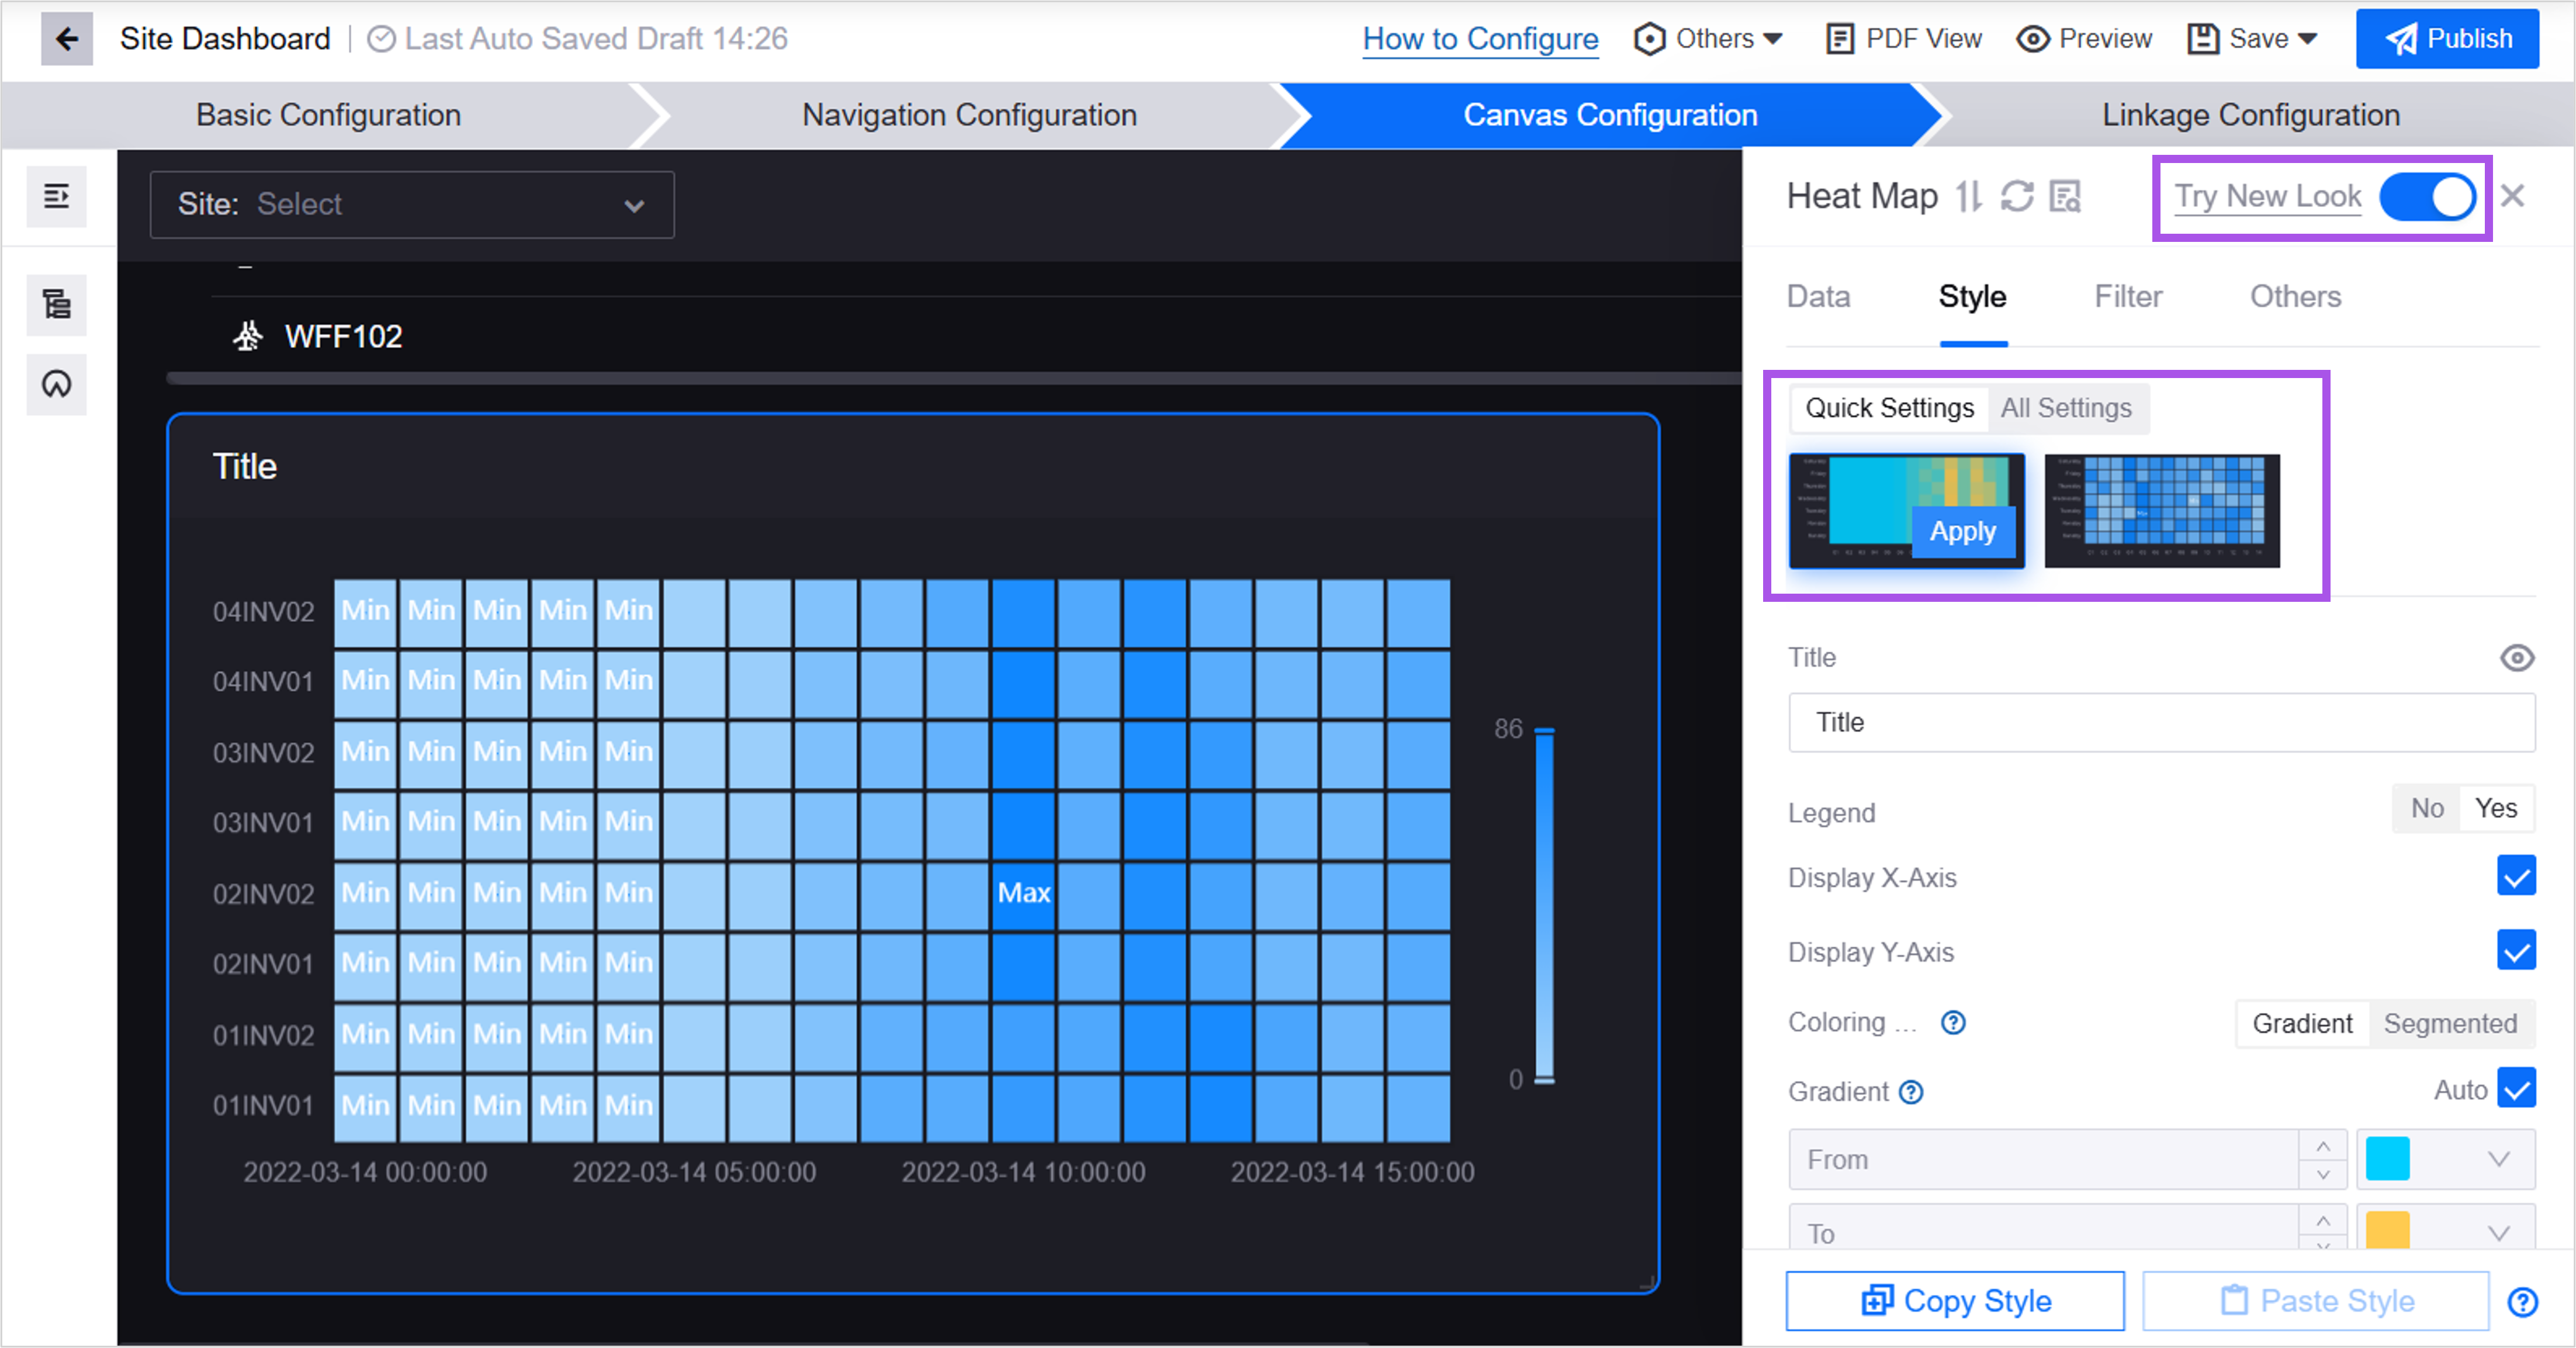
Application creators can enable a new look of the configuration panel in the Series Chart, Heat Map and List widgets and reuse component quick styles to simplify the configuration process.
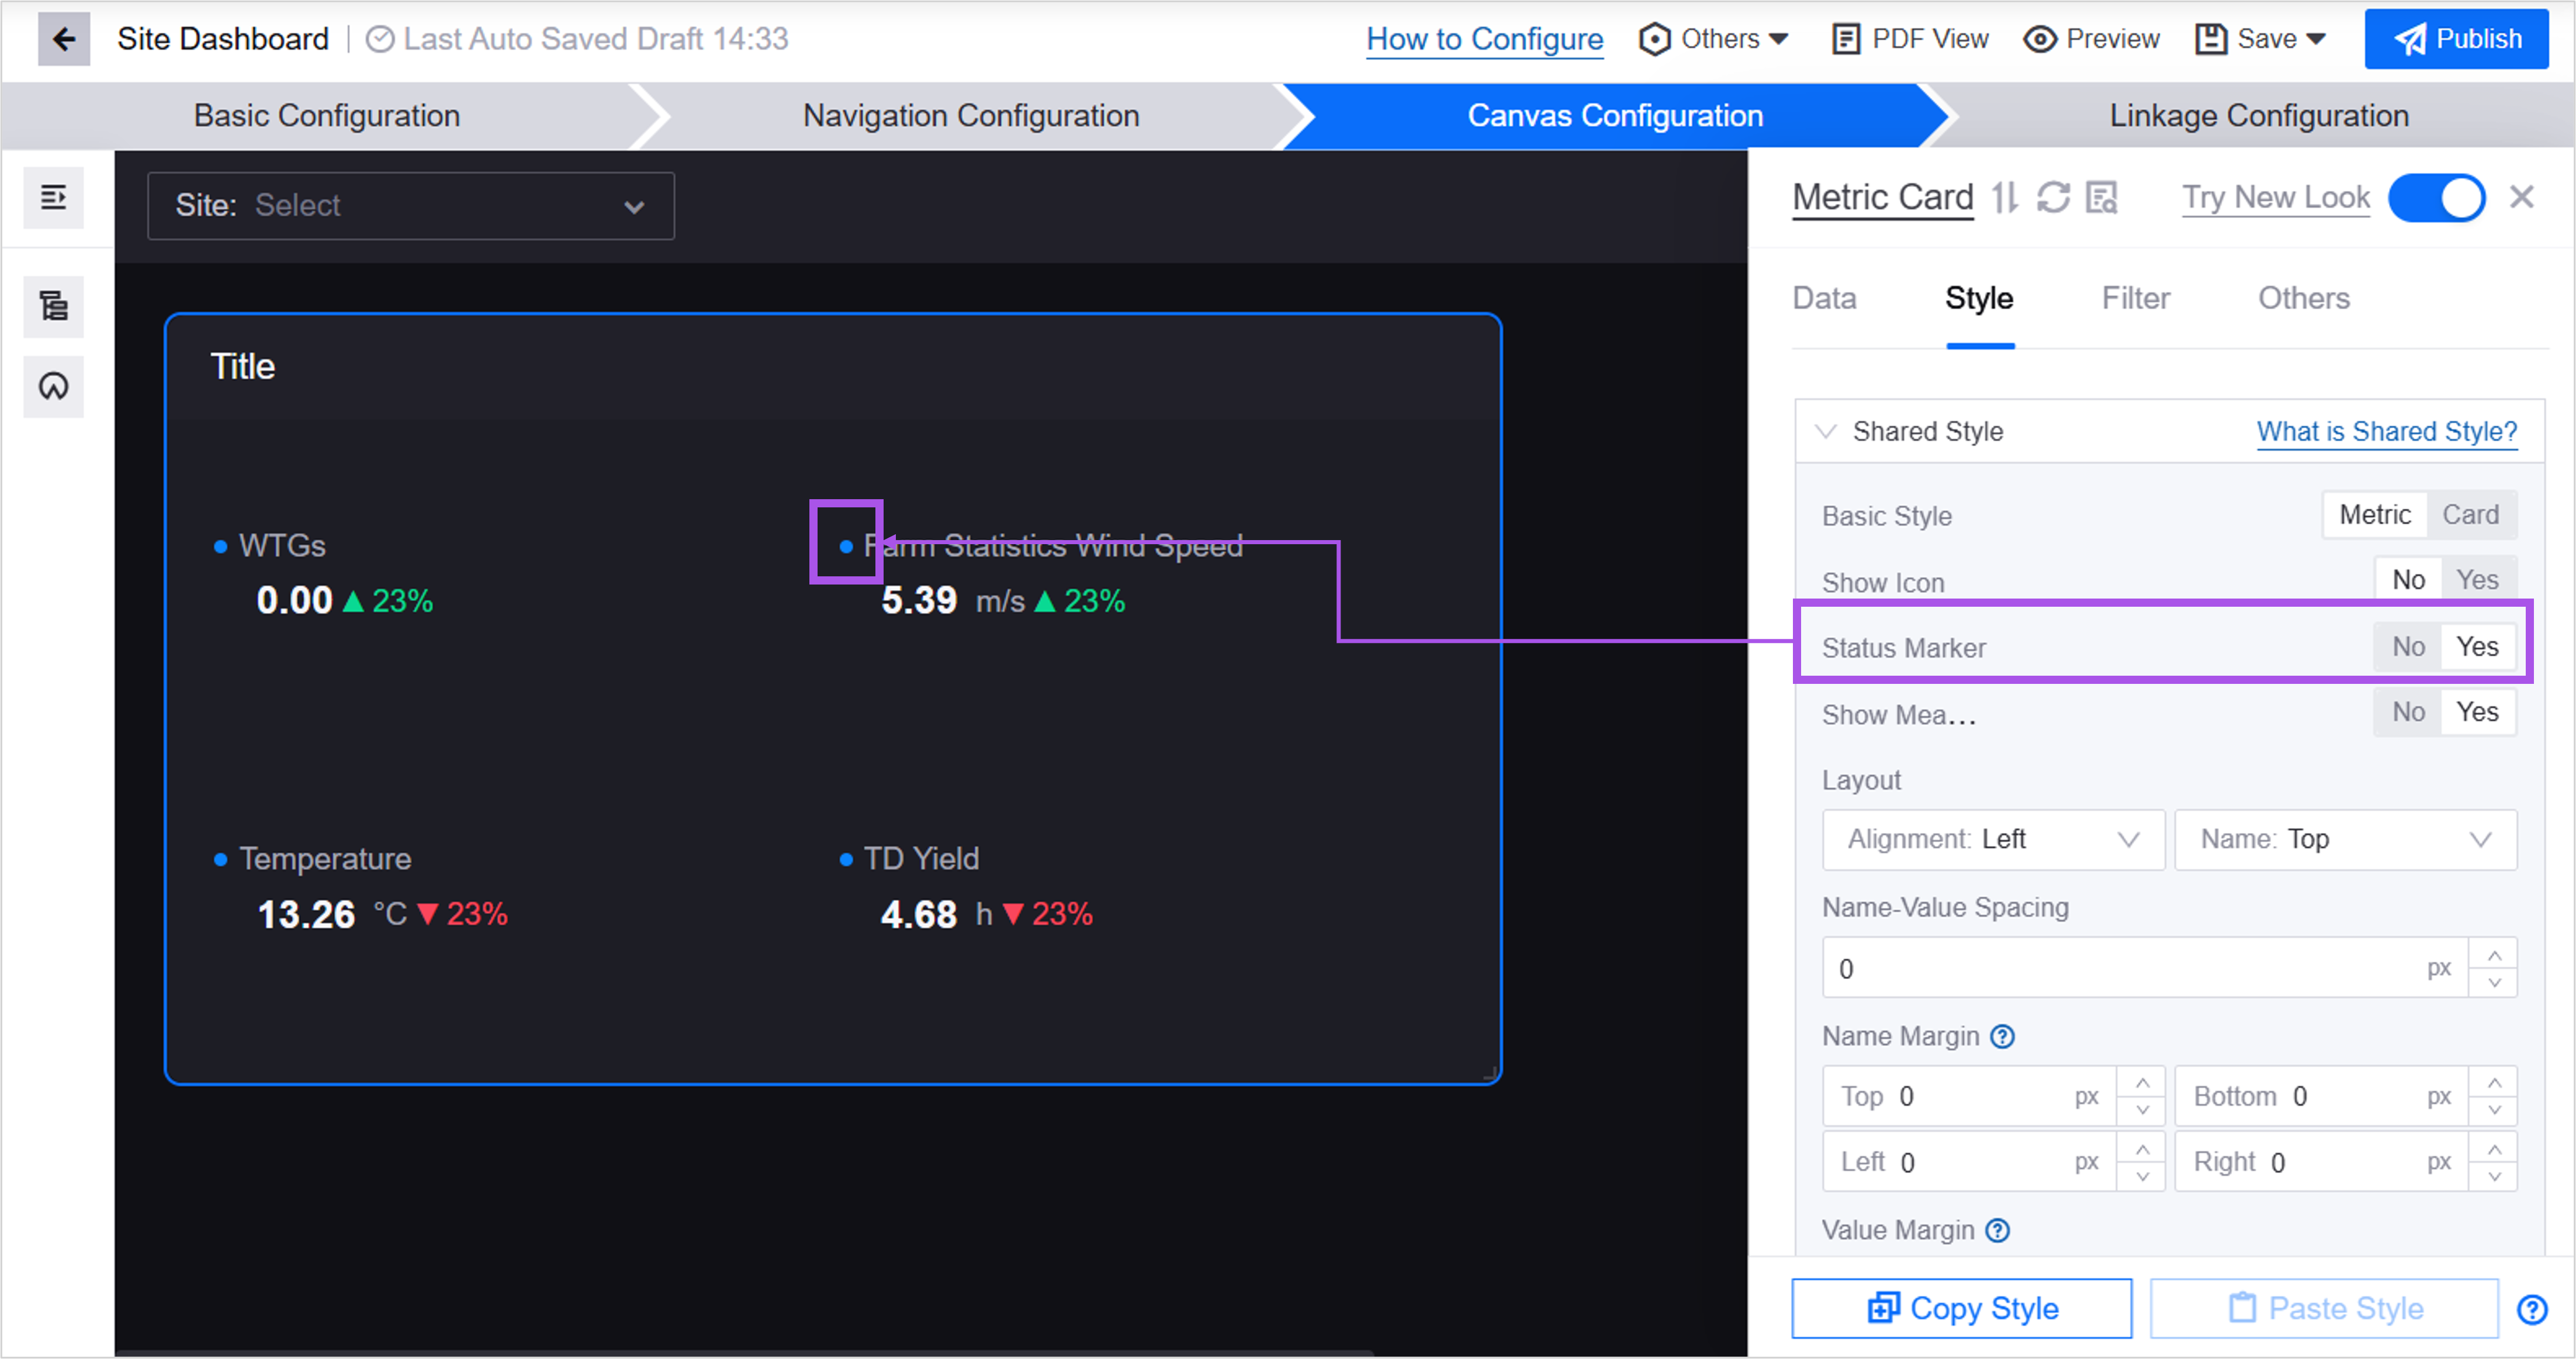
Added Status Marker to the Multi-Metric Card widgets. Application creators can configure the location and size of the marker for each metric, as well as the segmented matching rules between marker color and metric data, which will help users quickly learn about changes in metric data through color.
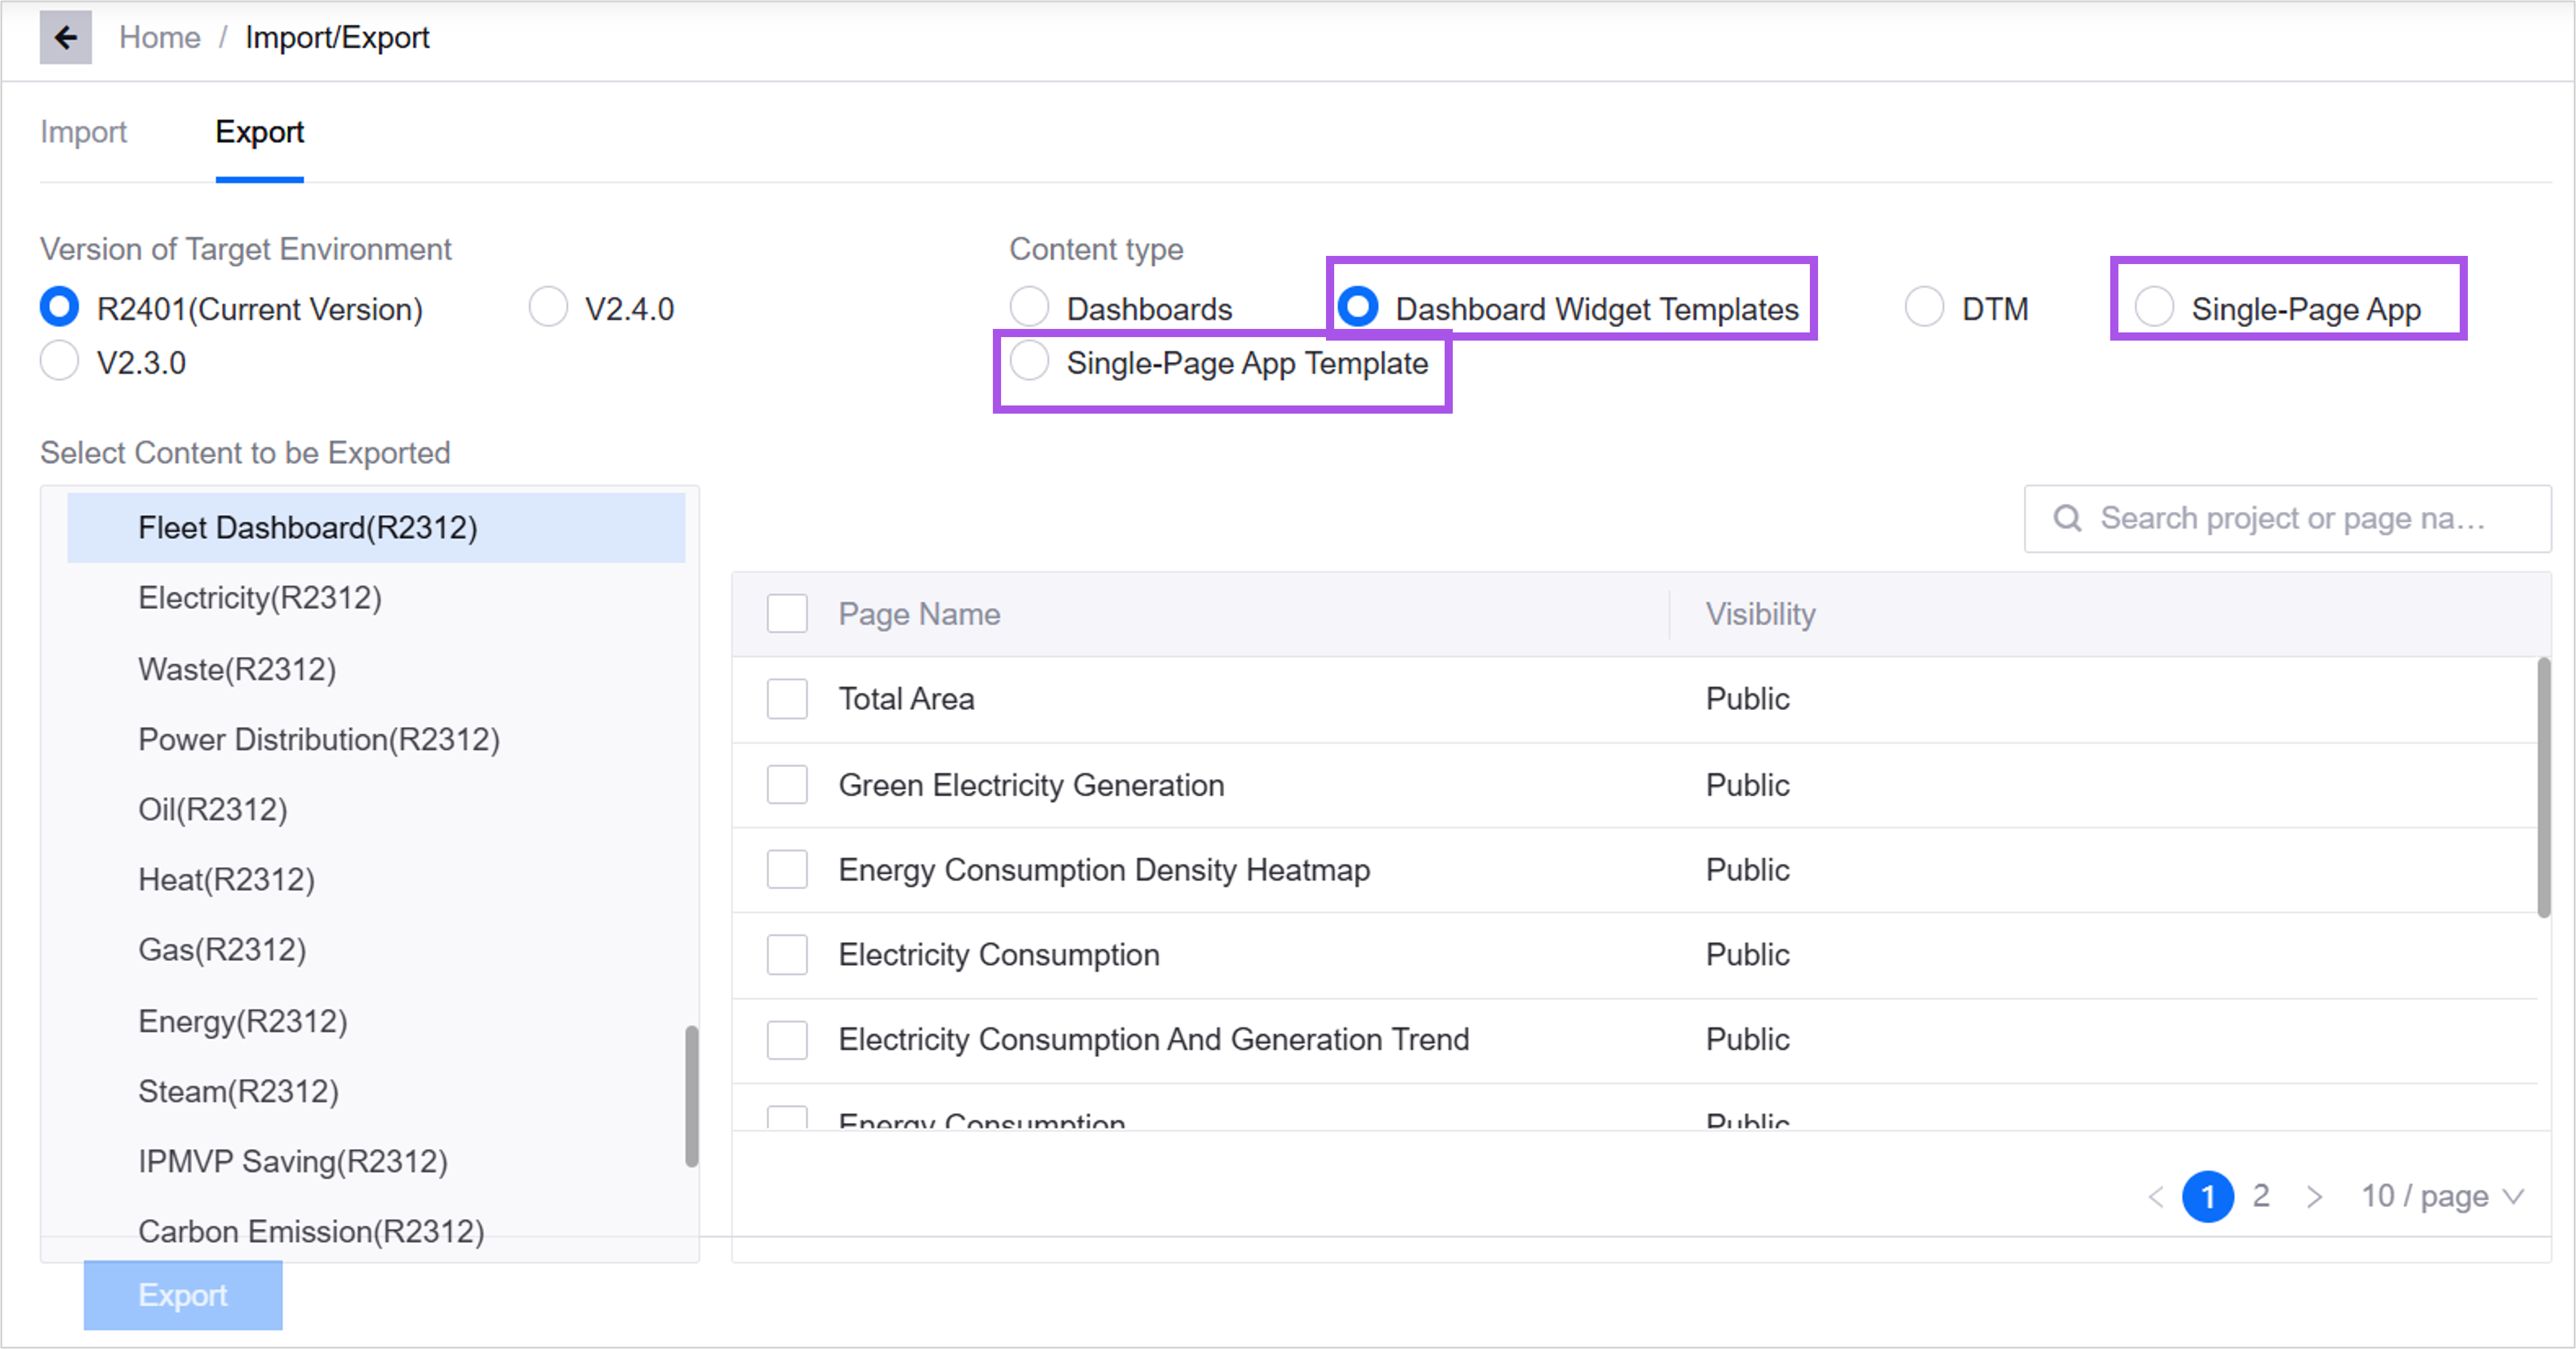
Application creators can export and import widget templates, single-page applications, and single-page application templates for easy reuse within different OUs.
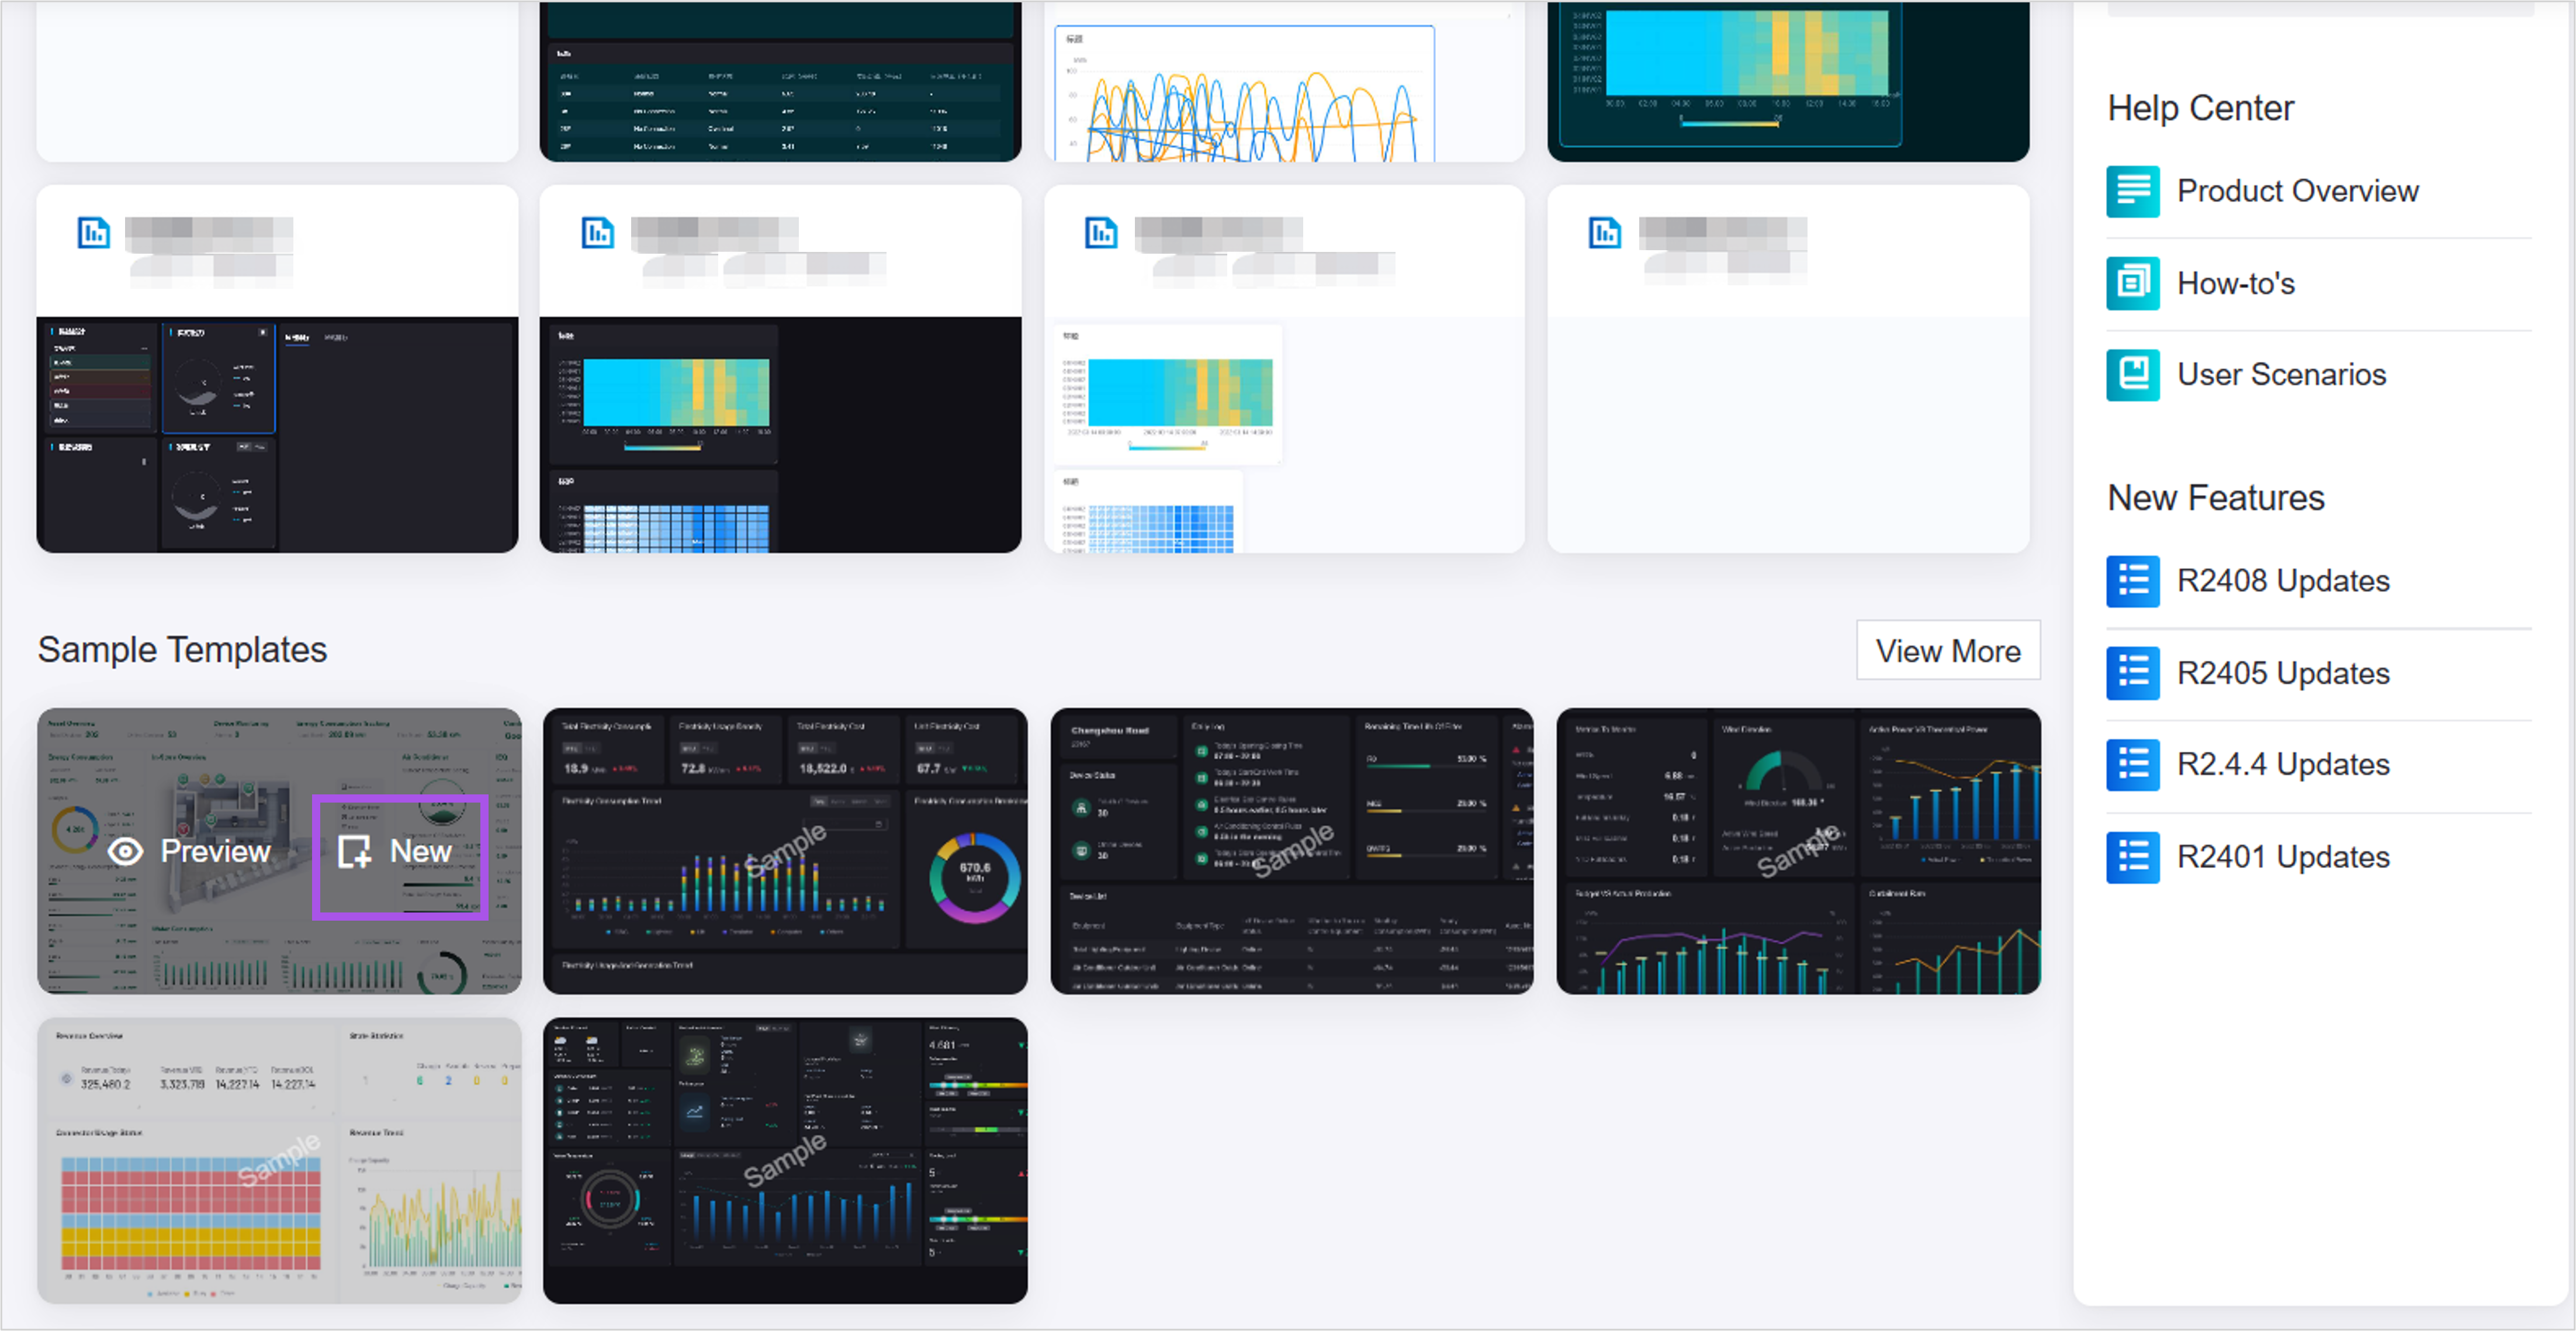
In the Sample Templates list, application creators can directly create pages based on standard templates precipitated by EnOS.
Unified Monitoring
In the Portfolio configuration page:
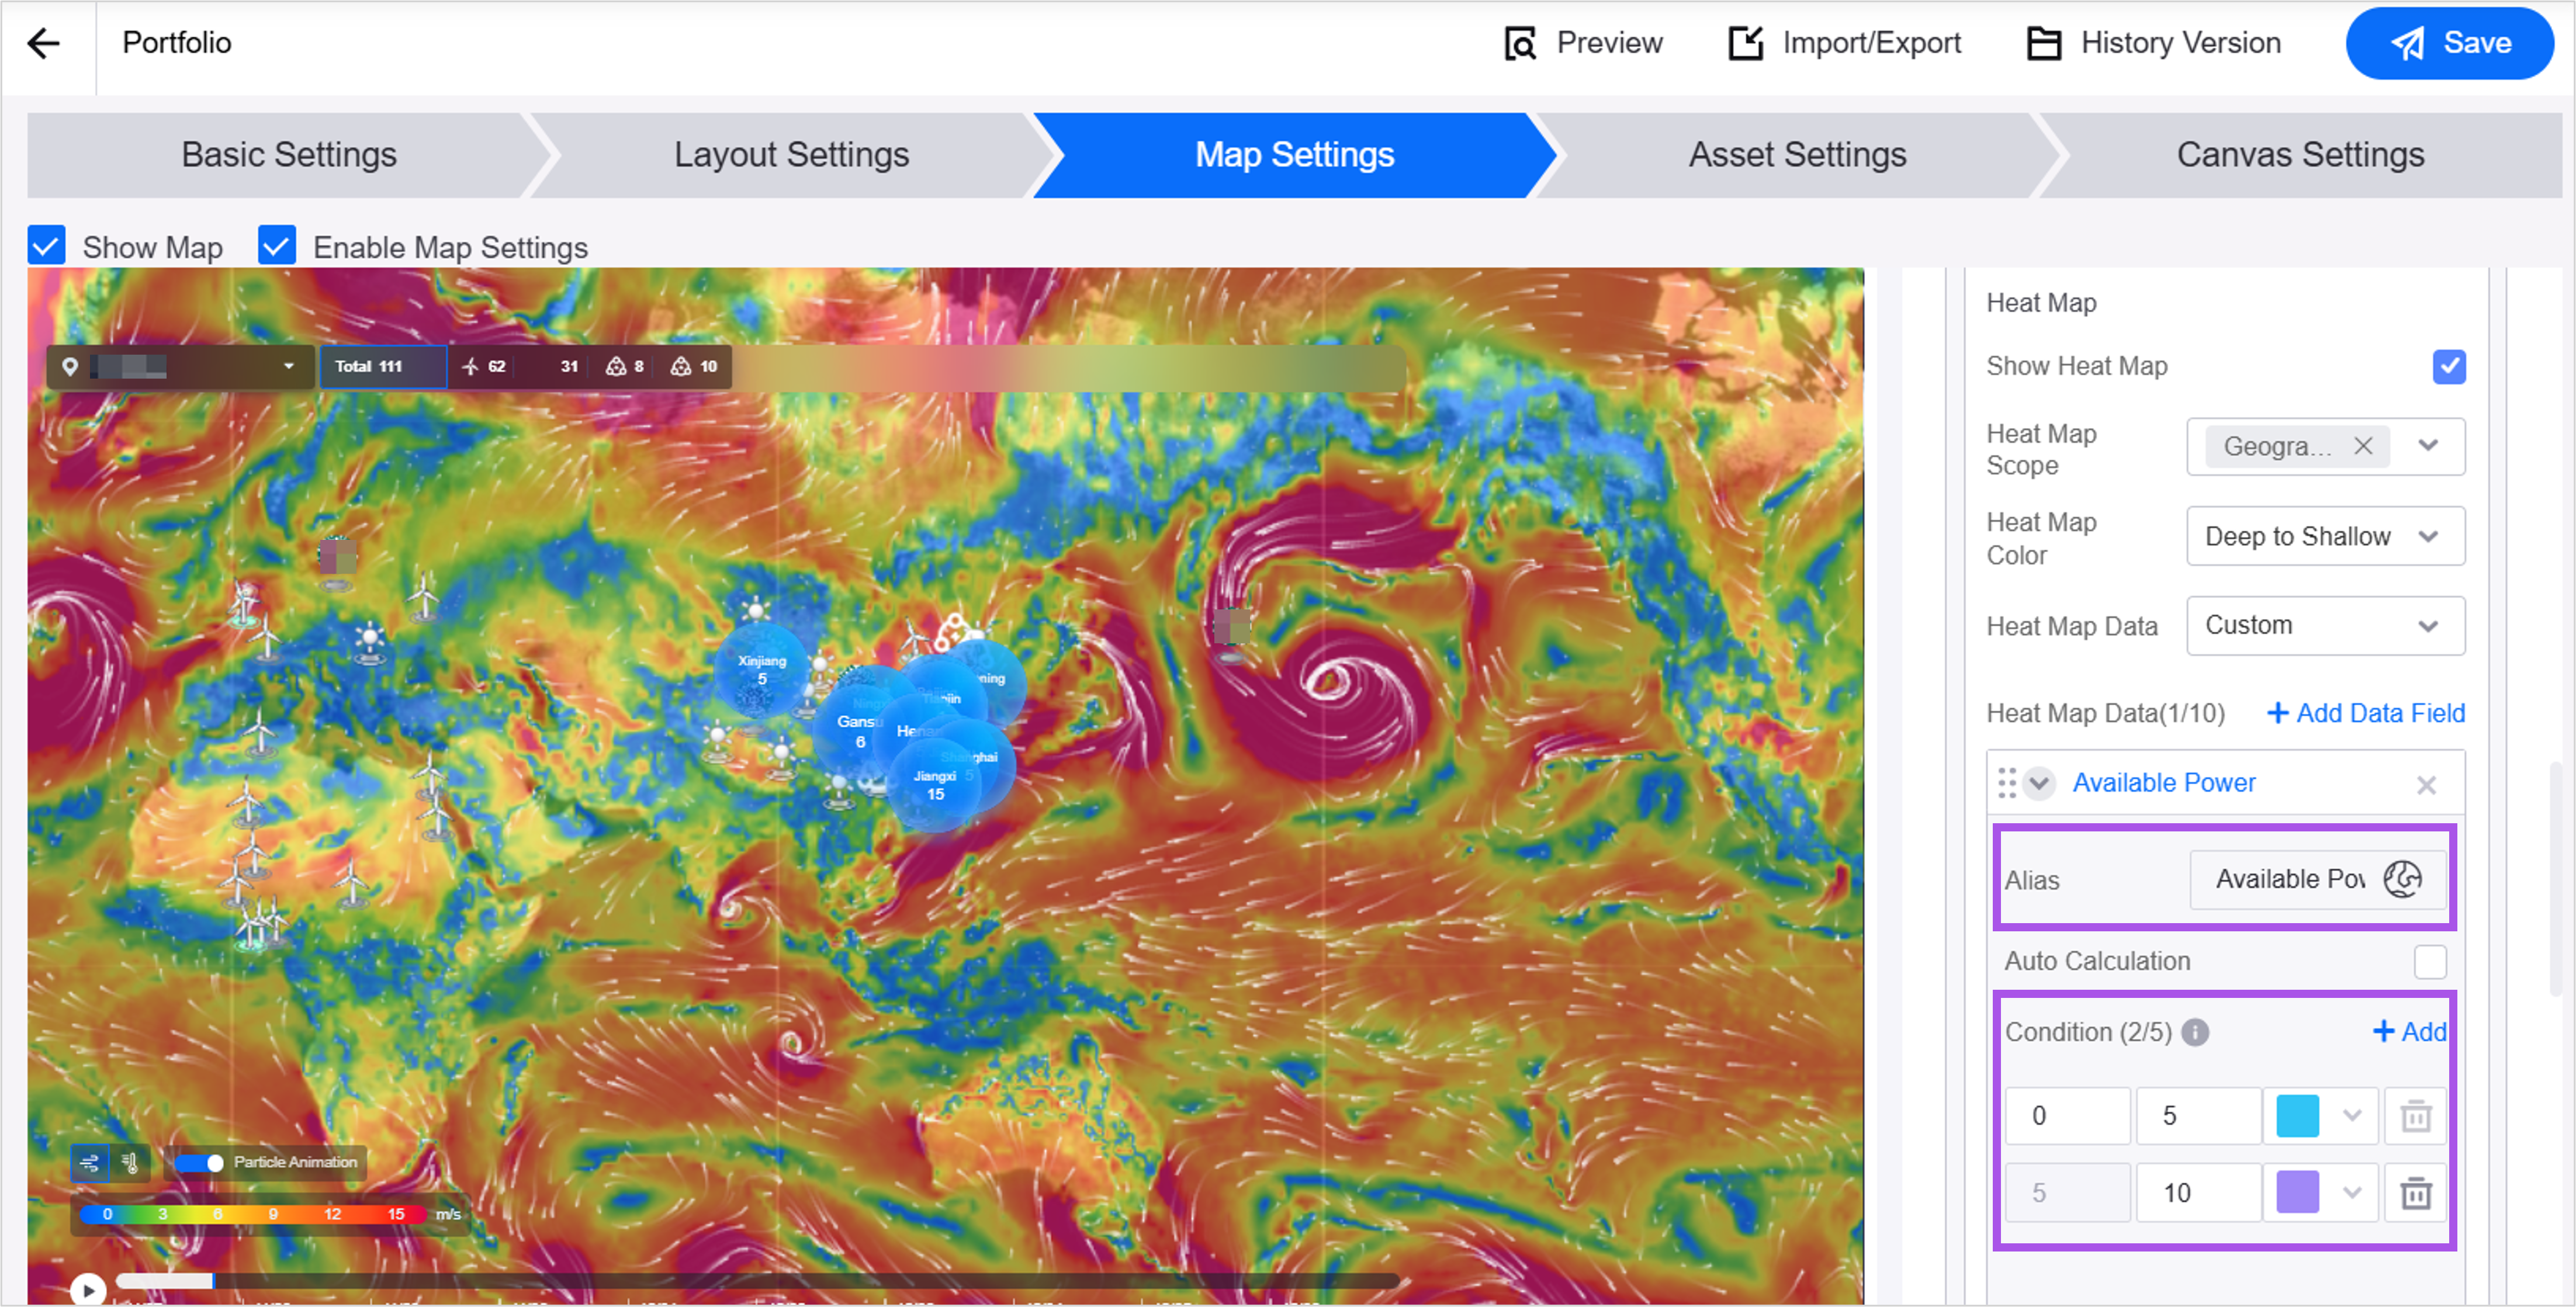
Application creators can configure Alias for the display data of the heat map, and can customize the corresponding conditions of the heat map color and value range to adapt to industry specifications in specific fields.
When configuring a custom map source, application creators can configure different map sources for pages in different languages to meet the needs of international display.
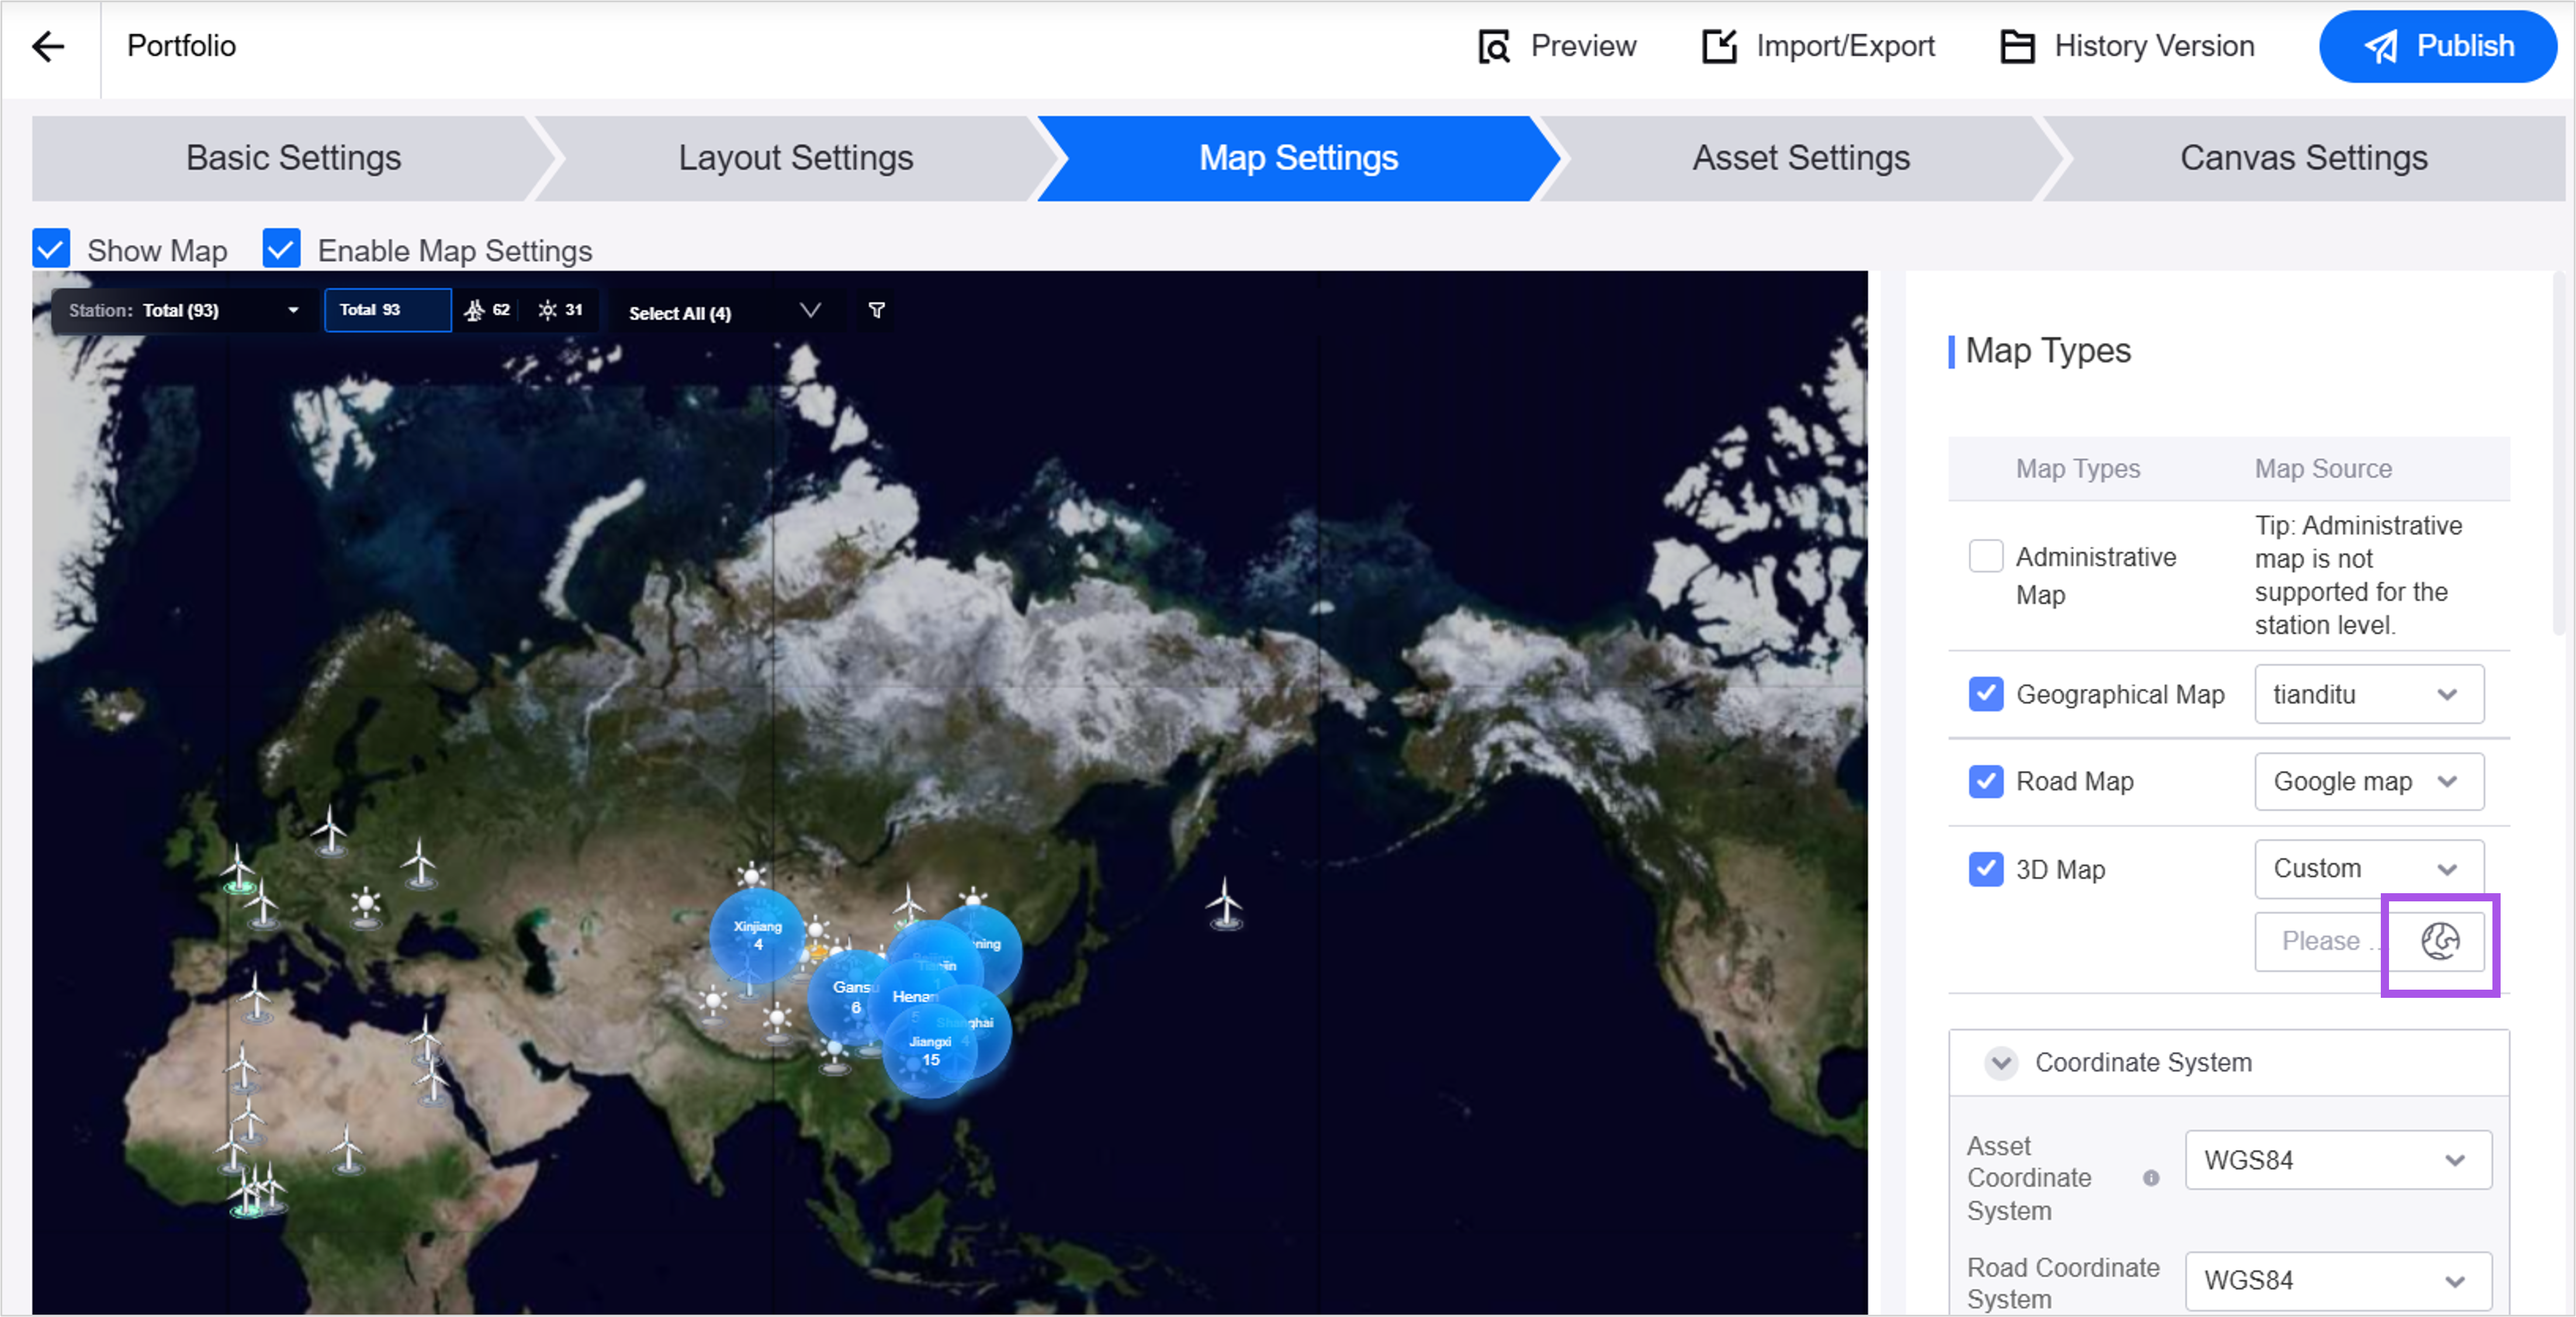
Added Asset Aggregation in the Portfolio terminal page. Users can customize whether to aggregate the asset data and display the aggregation bubbles.

Added Filter Type for the device type filters in the Asset List configuration page. Application creators can select Dropdown or Grid Button style for the filter. When there are fewer device types, the grid button style can simplify the user’s filtering operations.

In the Asset List terminal page:
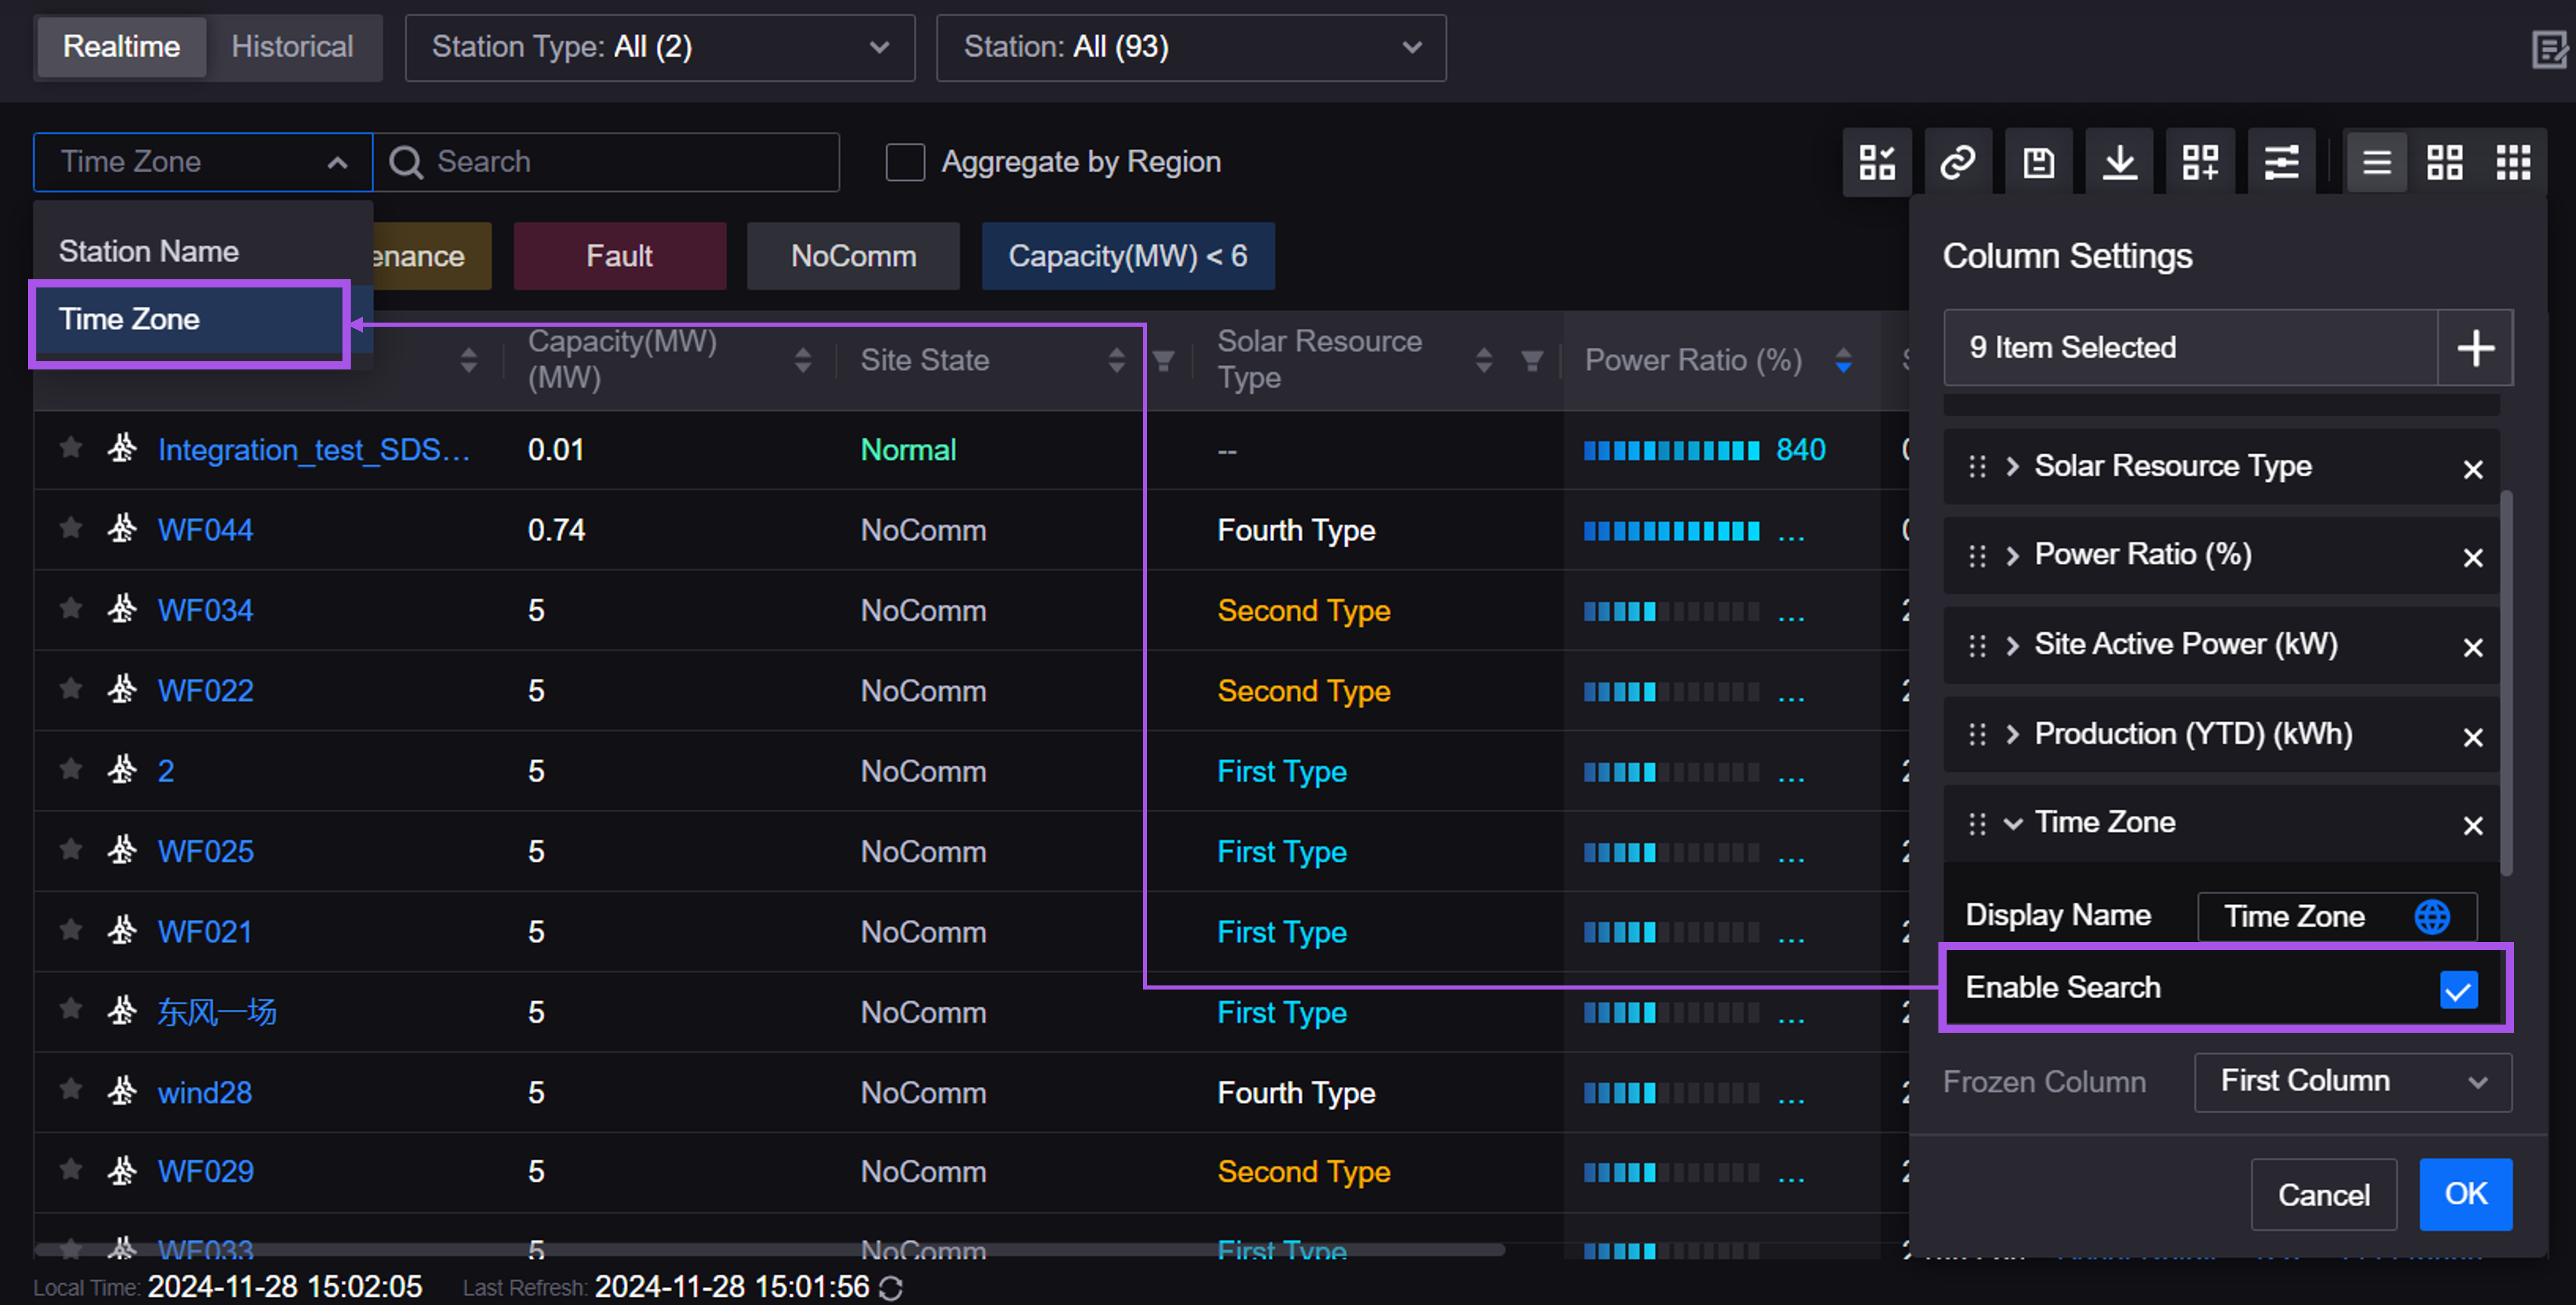
Users can enable search functions for String type fields, and filter cards by searching keywords of the fields on the page to find the information they need quickly.
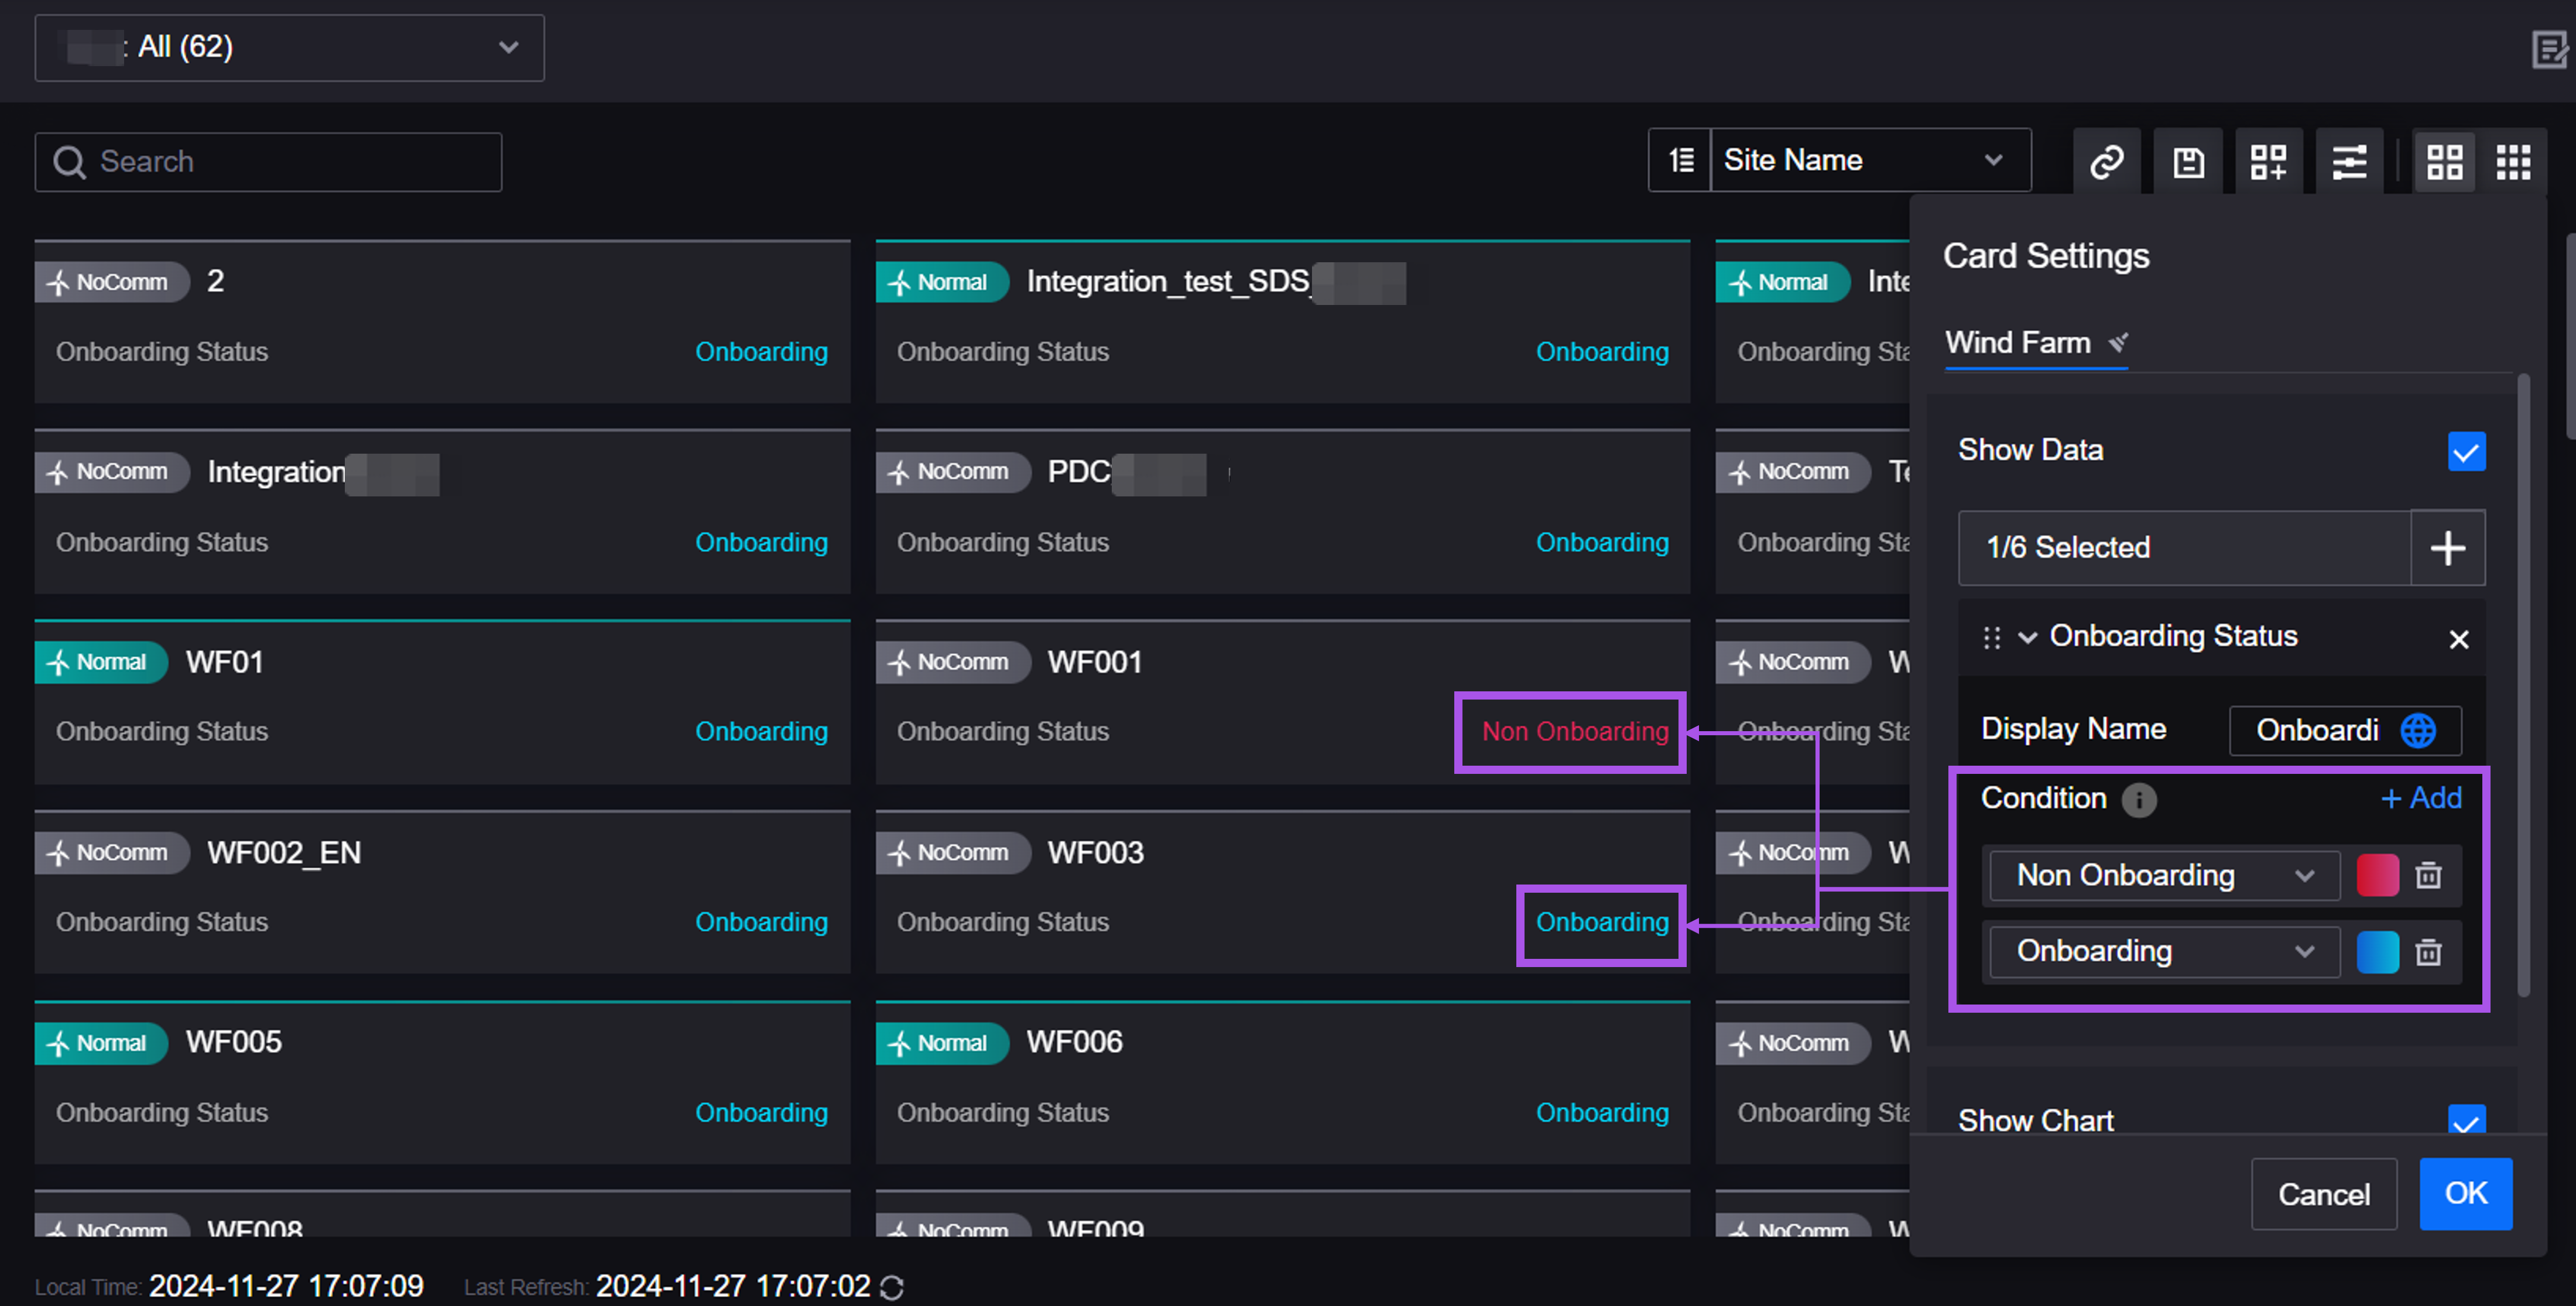
Users can customize color-value matching conditions for numeric and enumeration type data in card-style pages to identify the asset status at a glance through color coding.
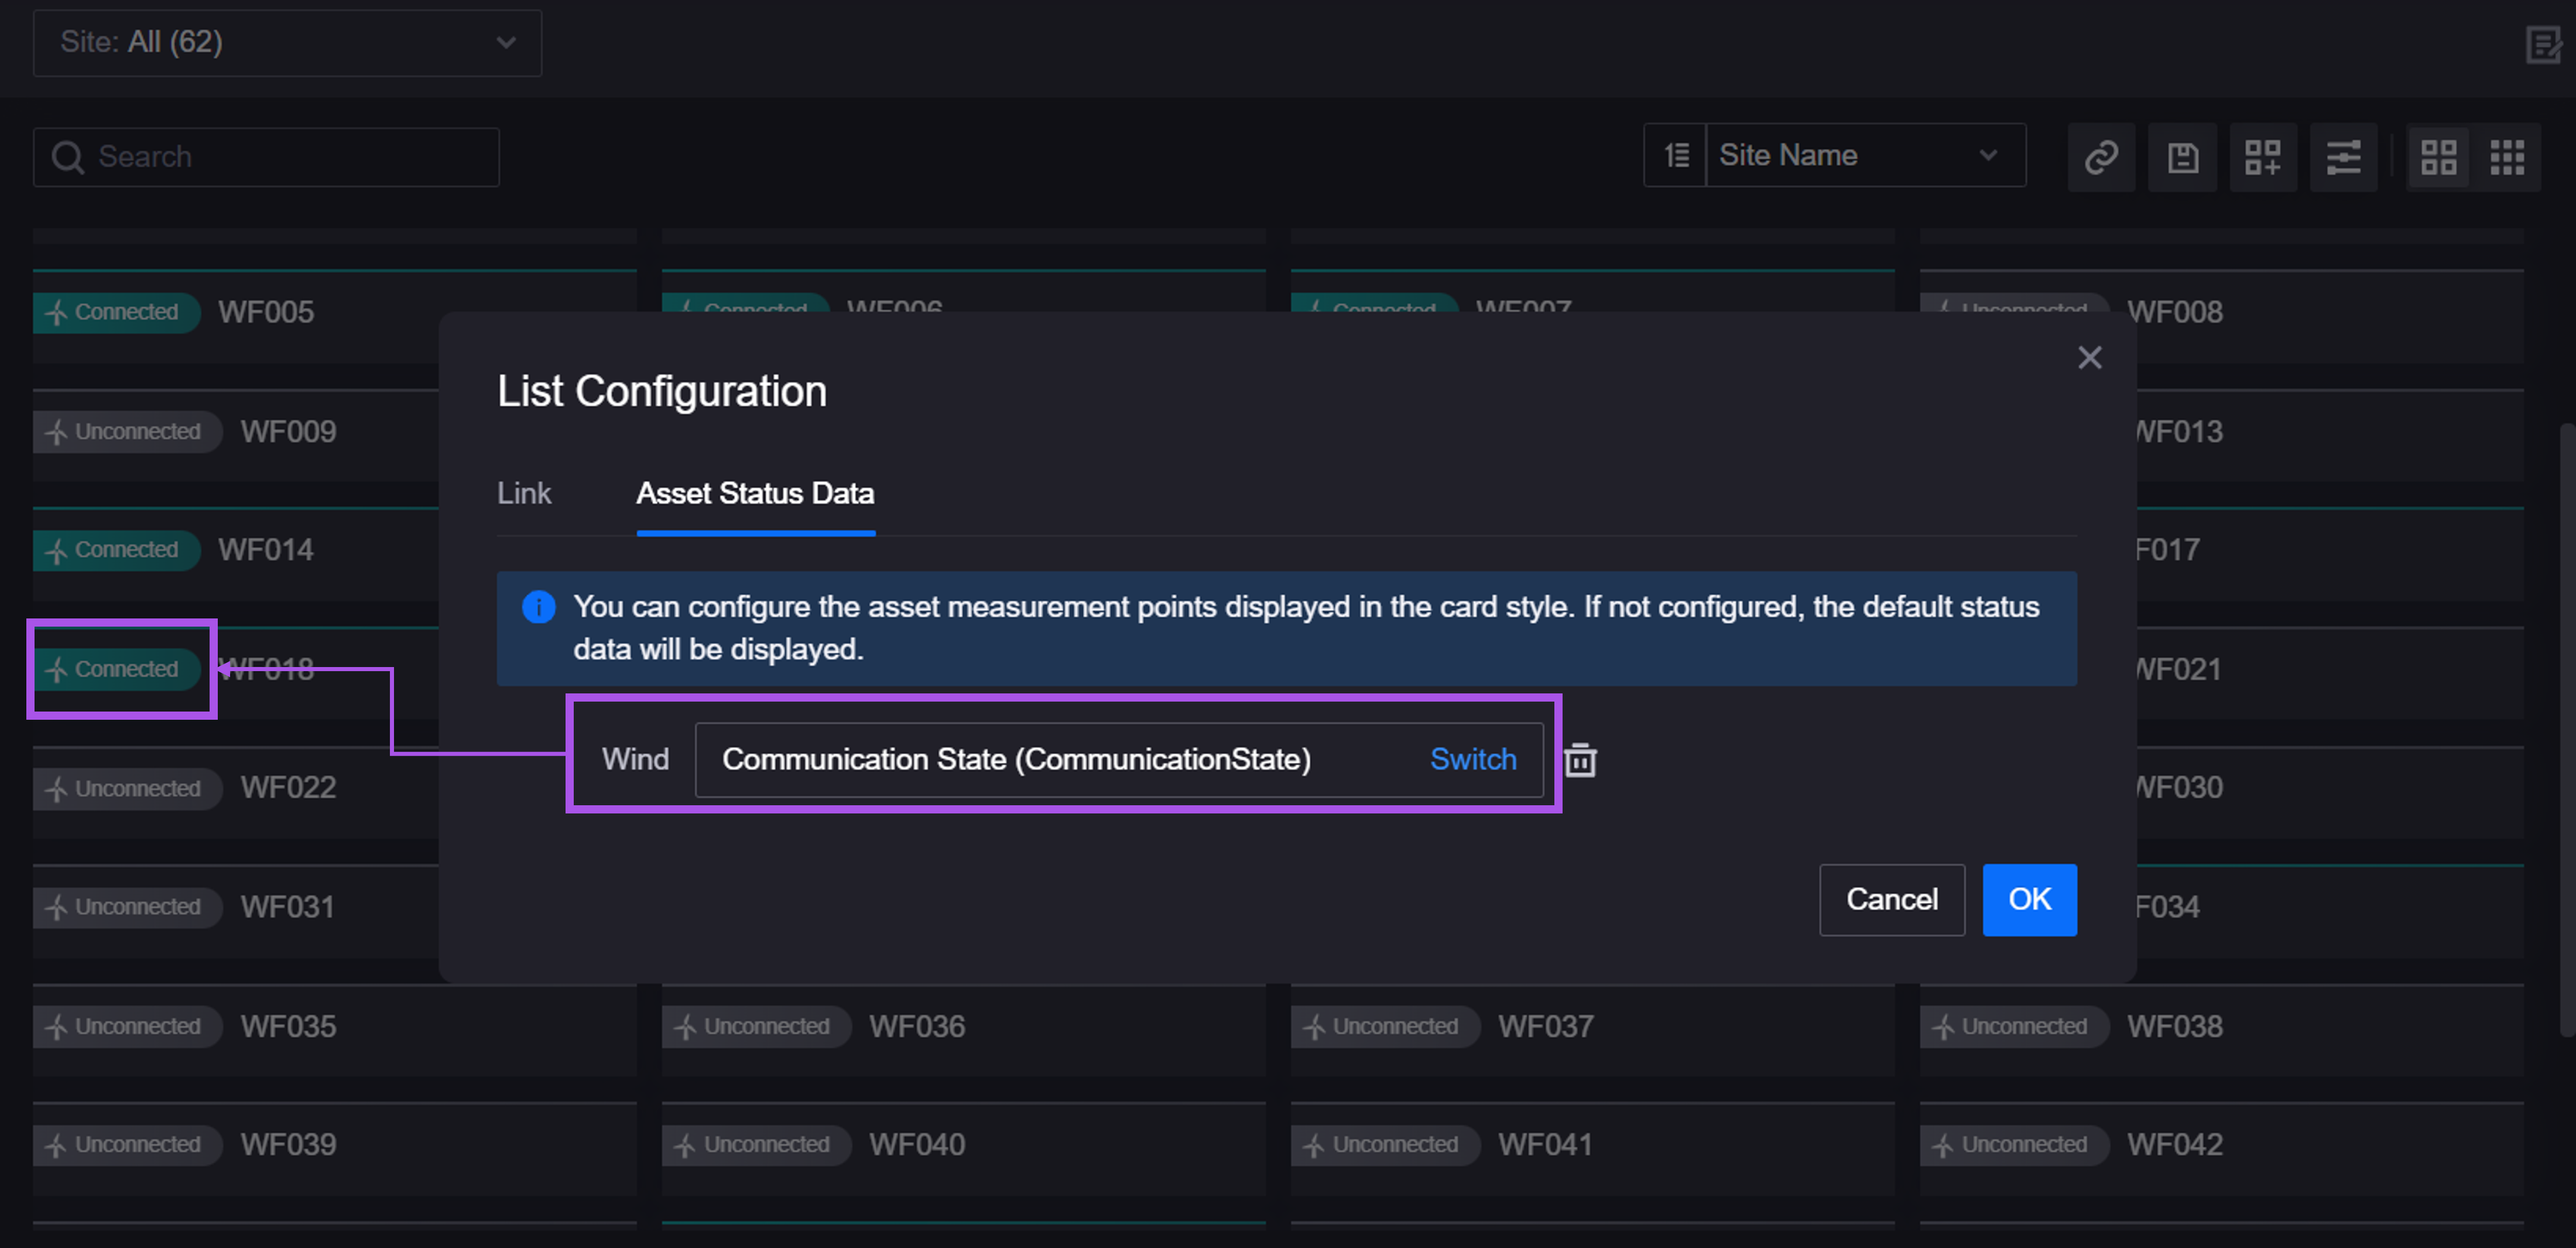
Added the Asset Status Data configuration item for users to customize the asset status measurement points displayed on different types of asset cards. If not configured, the status data will be displayed according to the visualization groups of EnOS Configuration Center.
In the Charting Tool configuration page:
Added the YoY Filter configuration item. When it is enabled, users can choose whether to display data for the same period last year on the page when filtering the time range.

Added the Time Aggregation Filter configuration item. When it is enabled, users can specify the time aggregation method for measurement point data in the filter. If not enabled or specified, the first value of each time interval will be taken by default.

Added the Timezone configuration item. When it is enabled, users can view the current timezone after the timestamps on the charts, and the timezone of the assets after the asset names. This help users to know about the inconsistent data update times in different regions.

Added the Show DI Raw Value configuration item. After it is enabled, when users query or export DI points, they can view the original value and mapped value of DI points at the same time. If not enabled, only the mapped value will be displayed, and if there is no mapped value, the original value will be displayed.

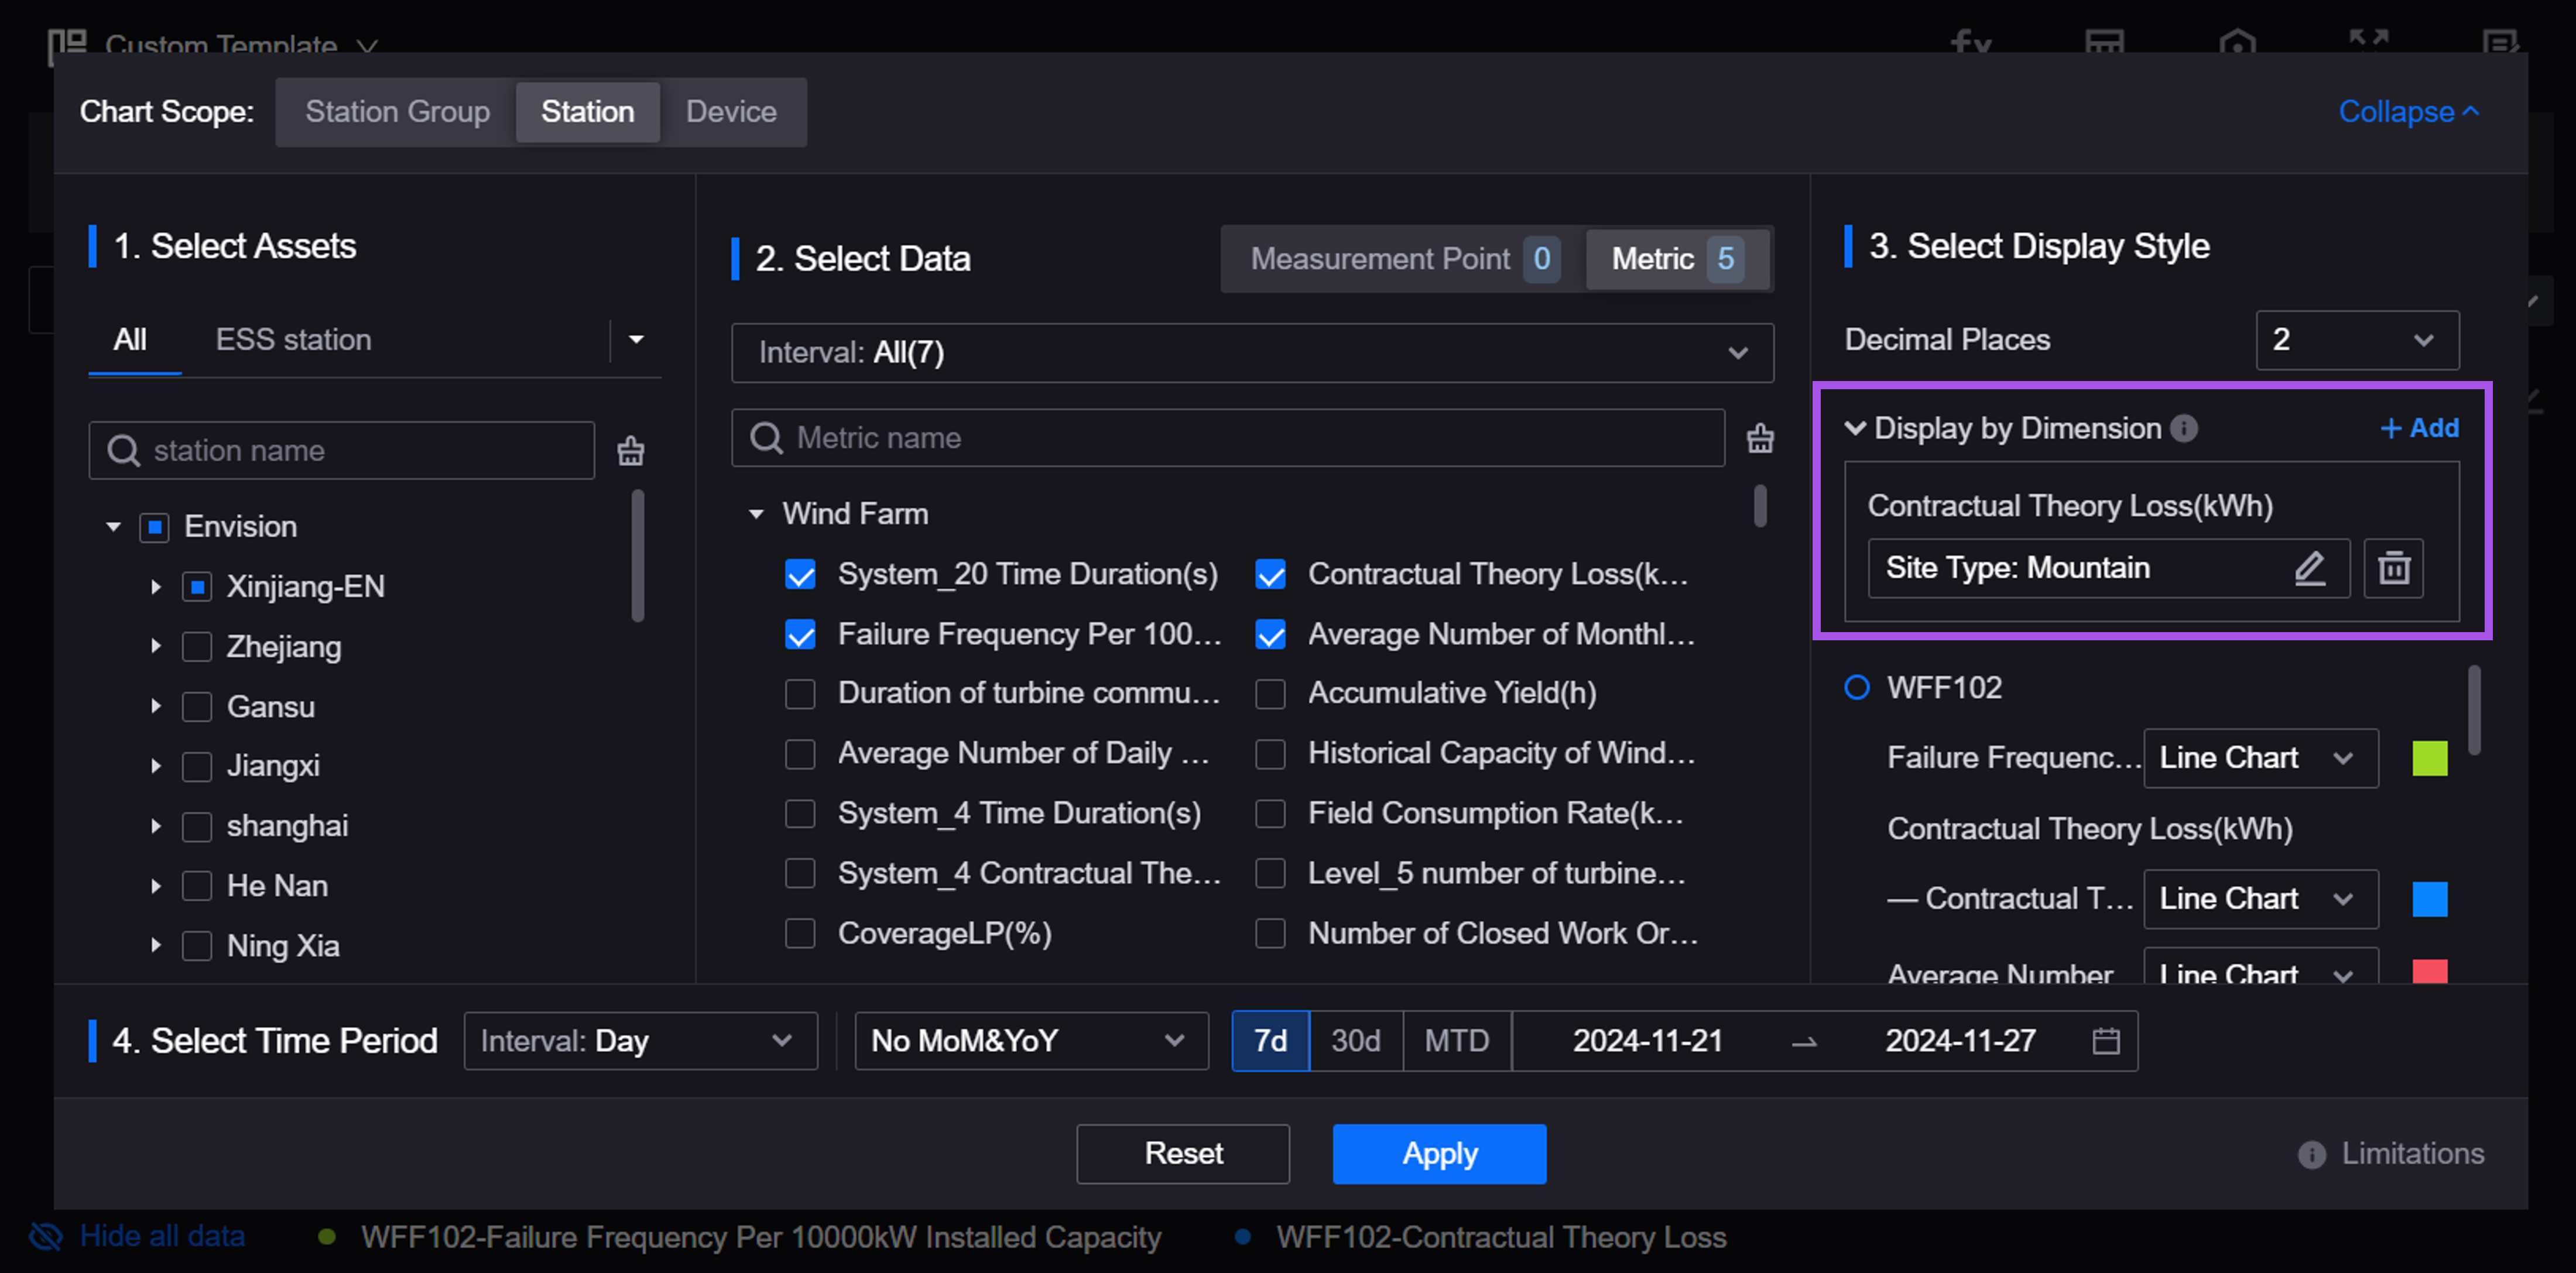
Added Display by Dimension in the Charting tool terminal page. When users select a metric that supports dimensional query, they can specify the dimension types and dimension values registered in EnOS Common Data Service. The page will query and display multiple data of metrics according to the dimensions.
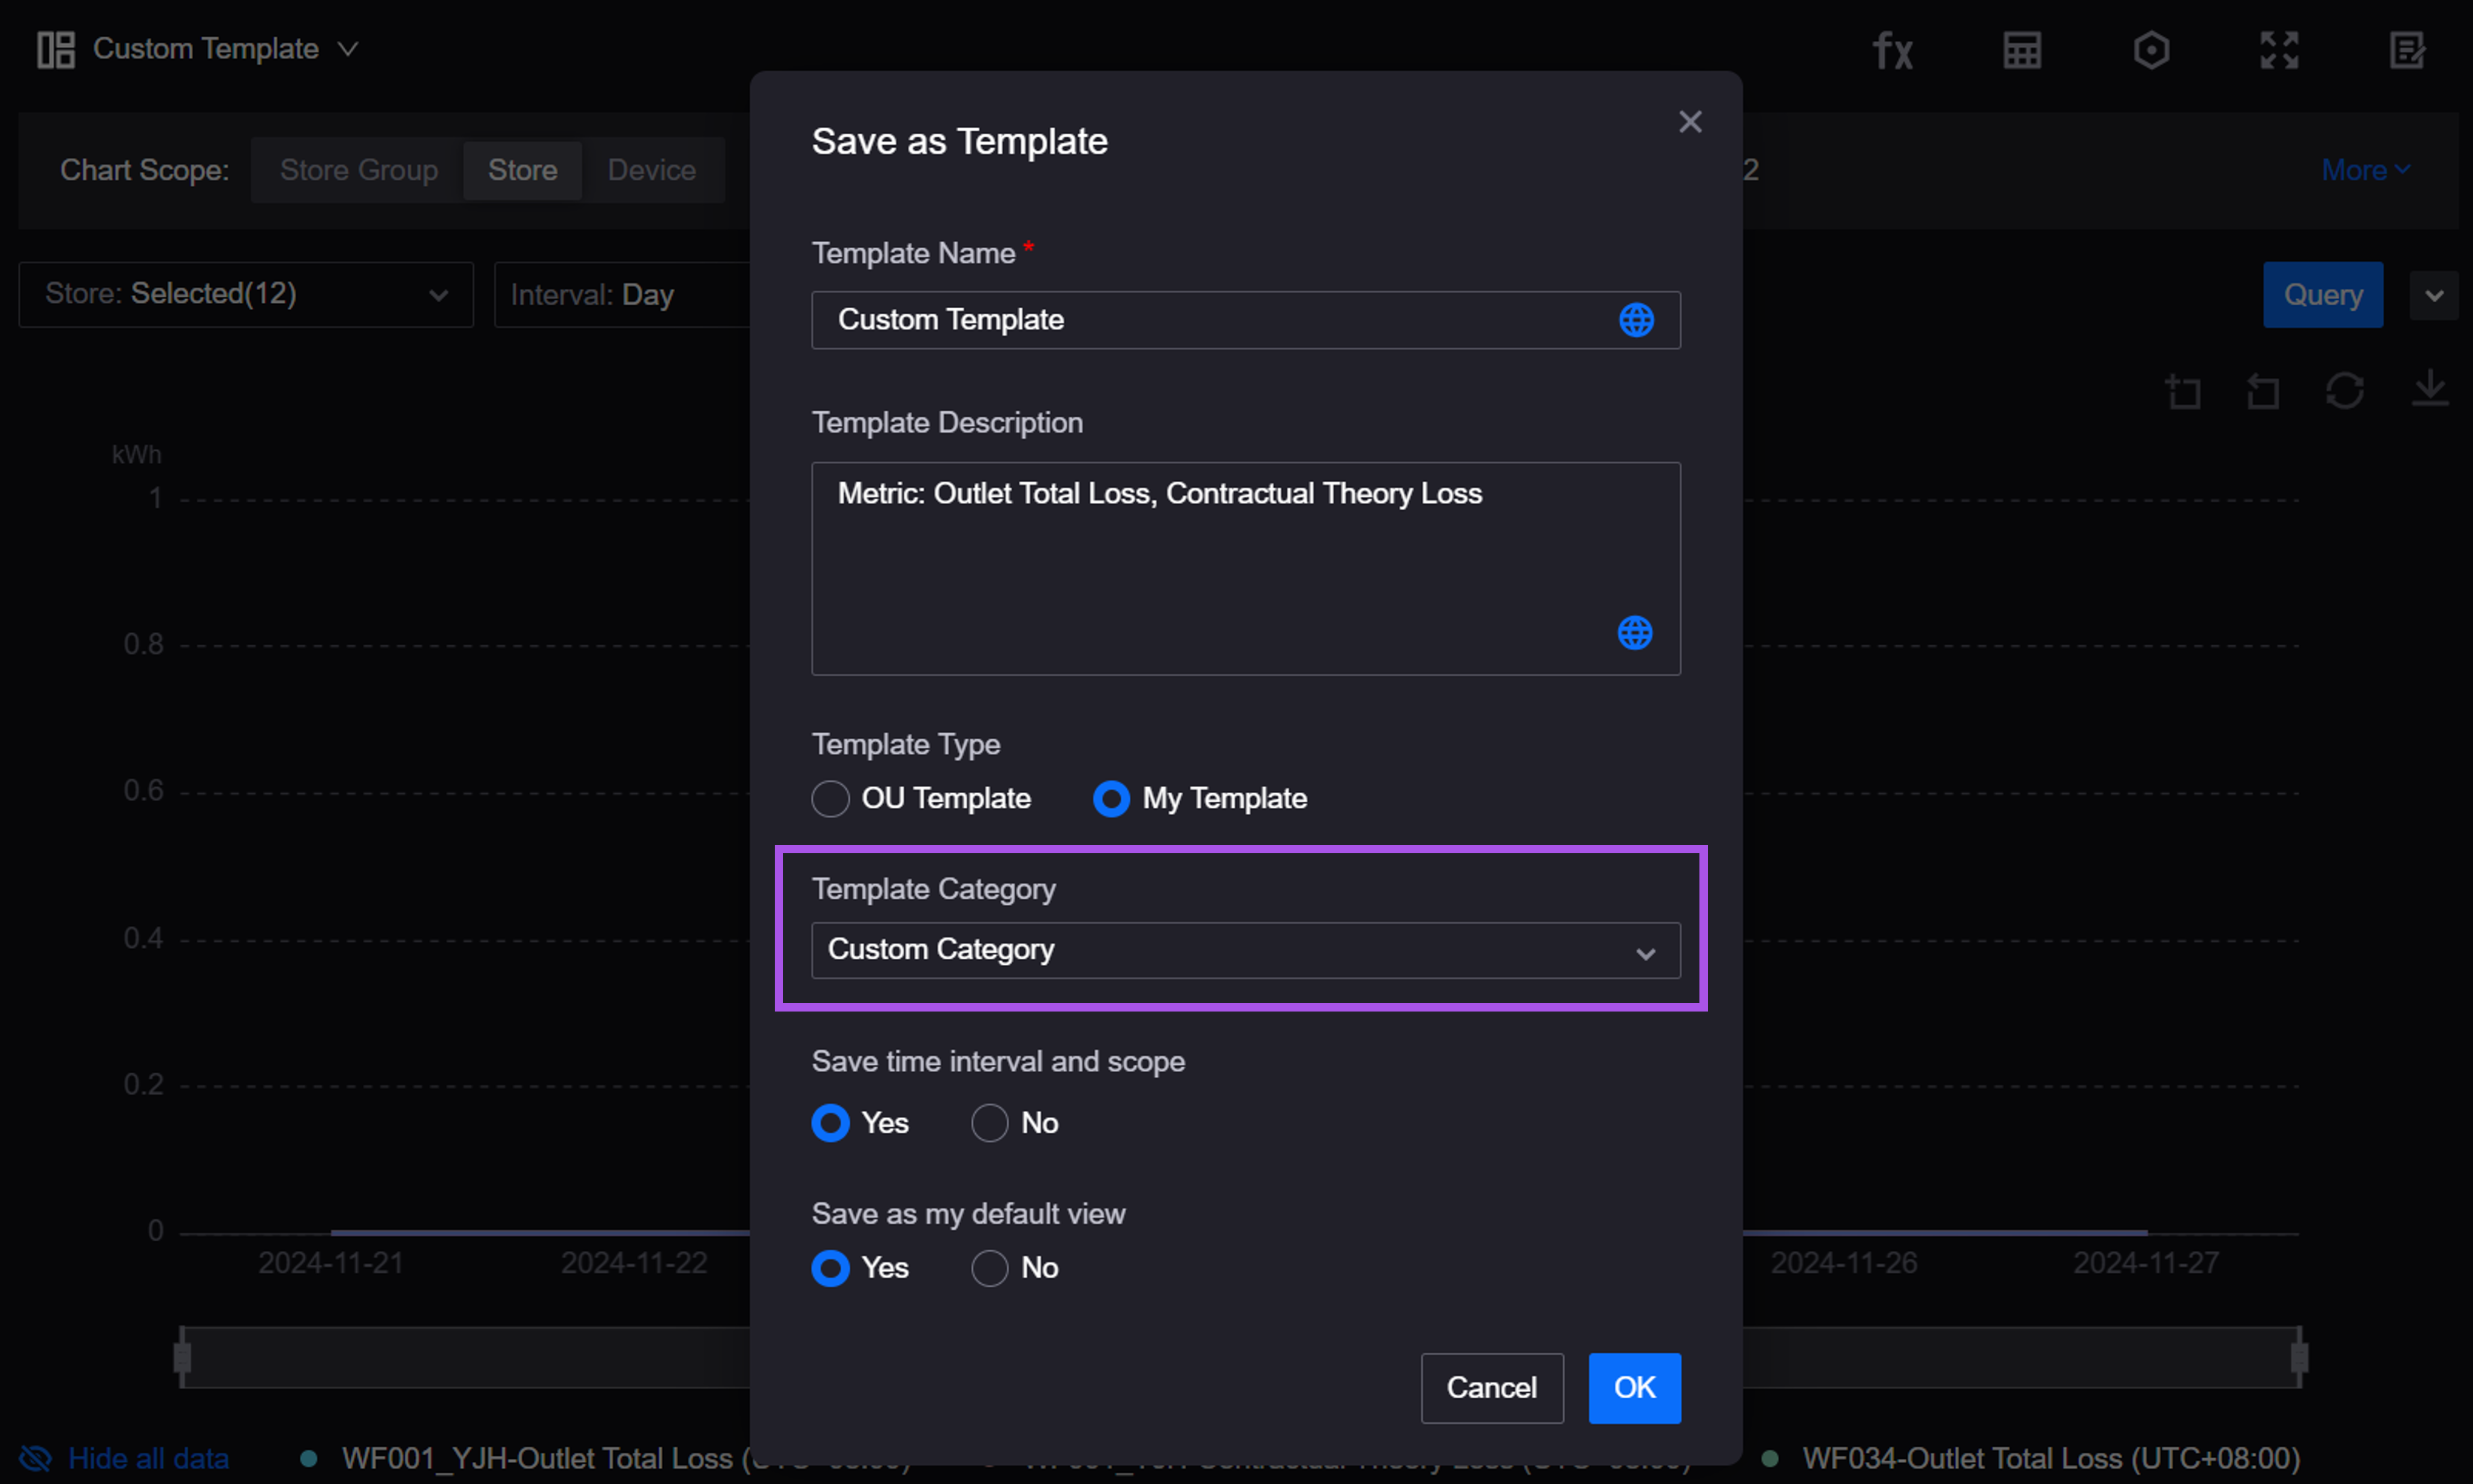
In the Charting tool and Common KPI Inquiry terminal pages, users can add My Templates to a category to manage personal templates by grouping.
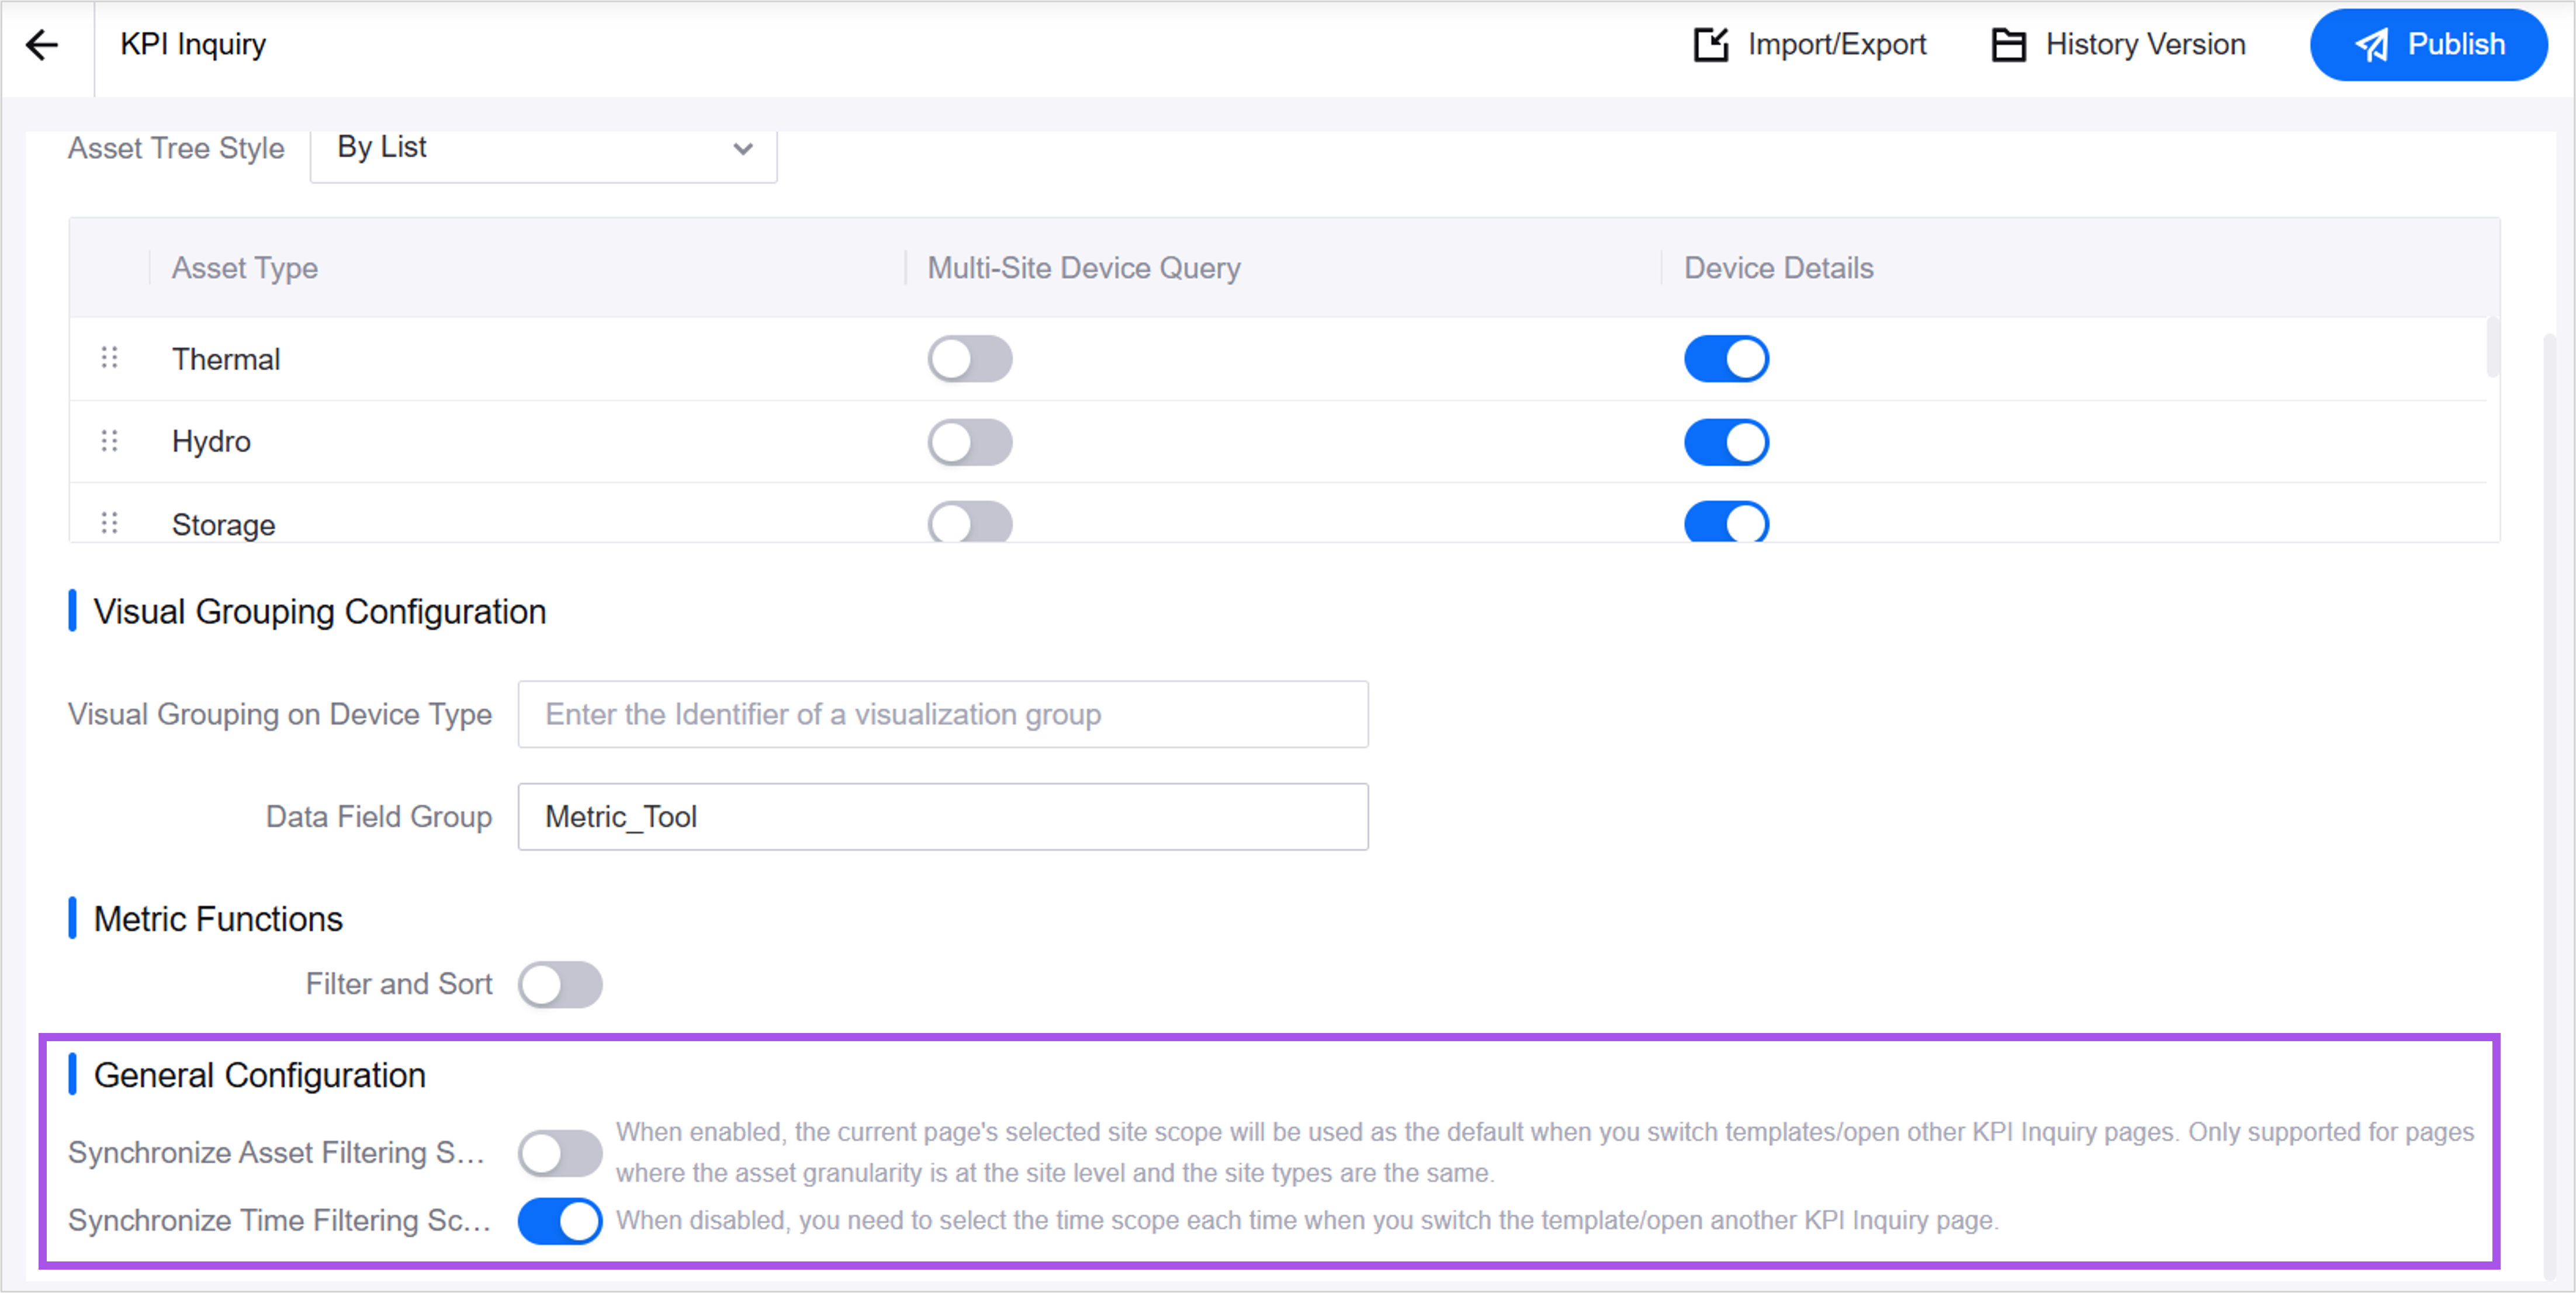
Added the Synchronize Asset Filtering Scope and Synchronize Time Filtering Scope configuration items to the Common KPI Inquiry configuration page. After it is enabled, when users switch the page templates or open other Common KPI Inquiry pages, the selected filter conditions of the current page will be retained.
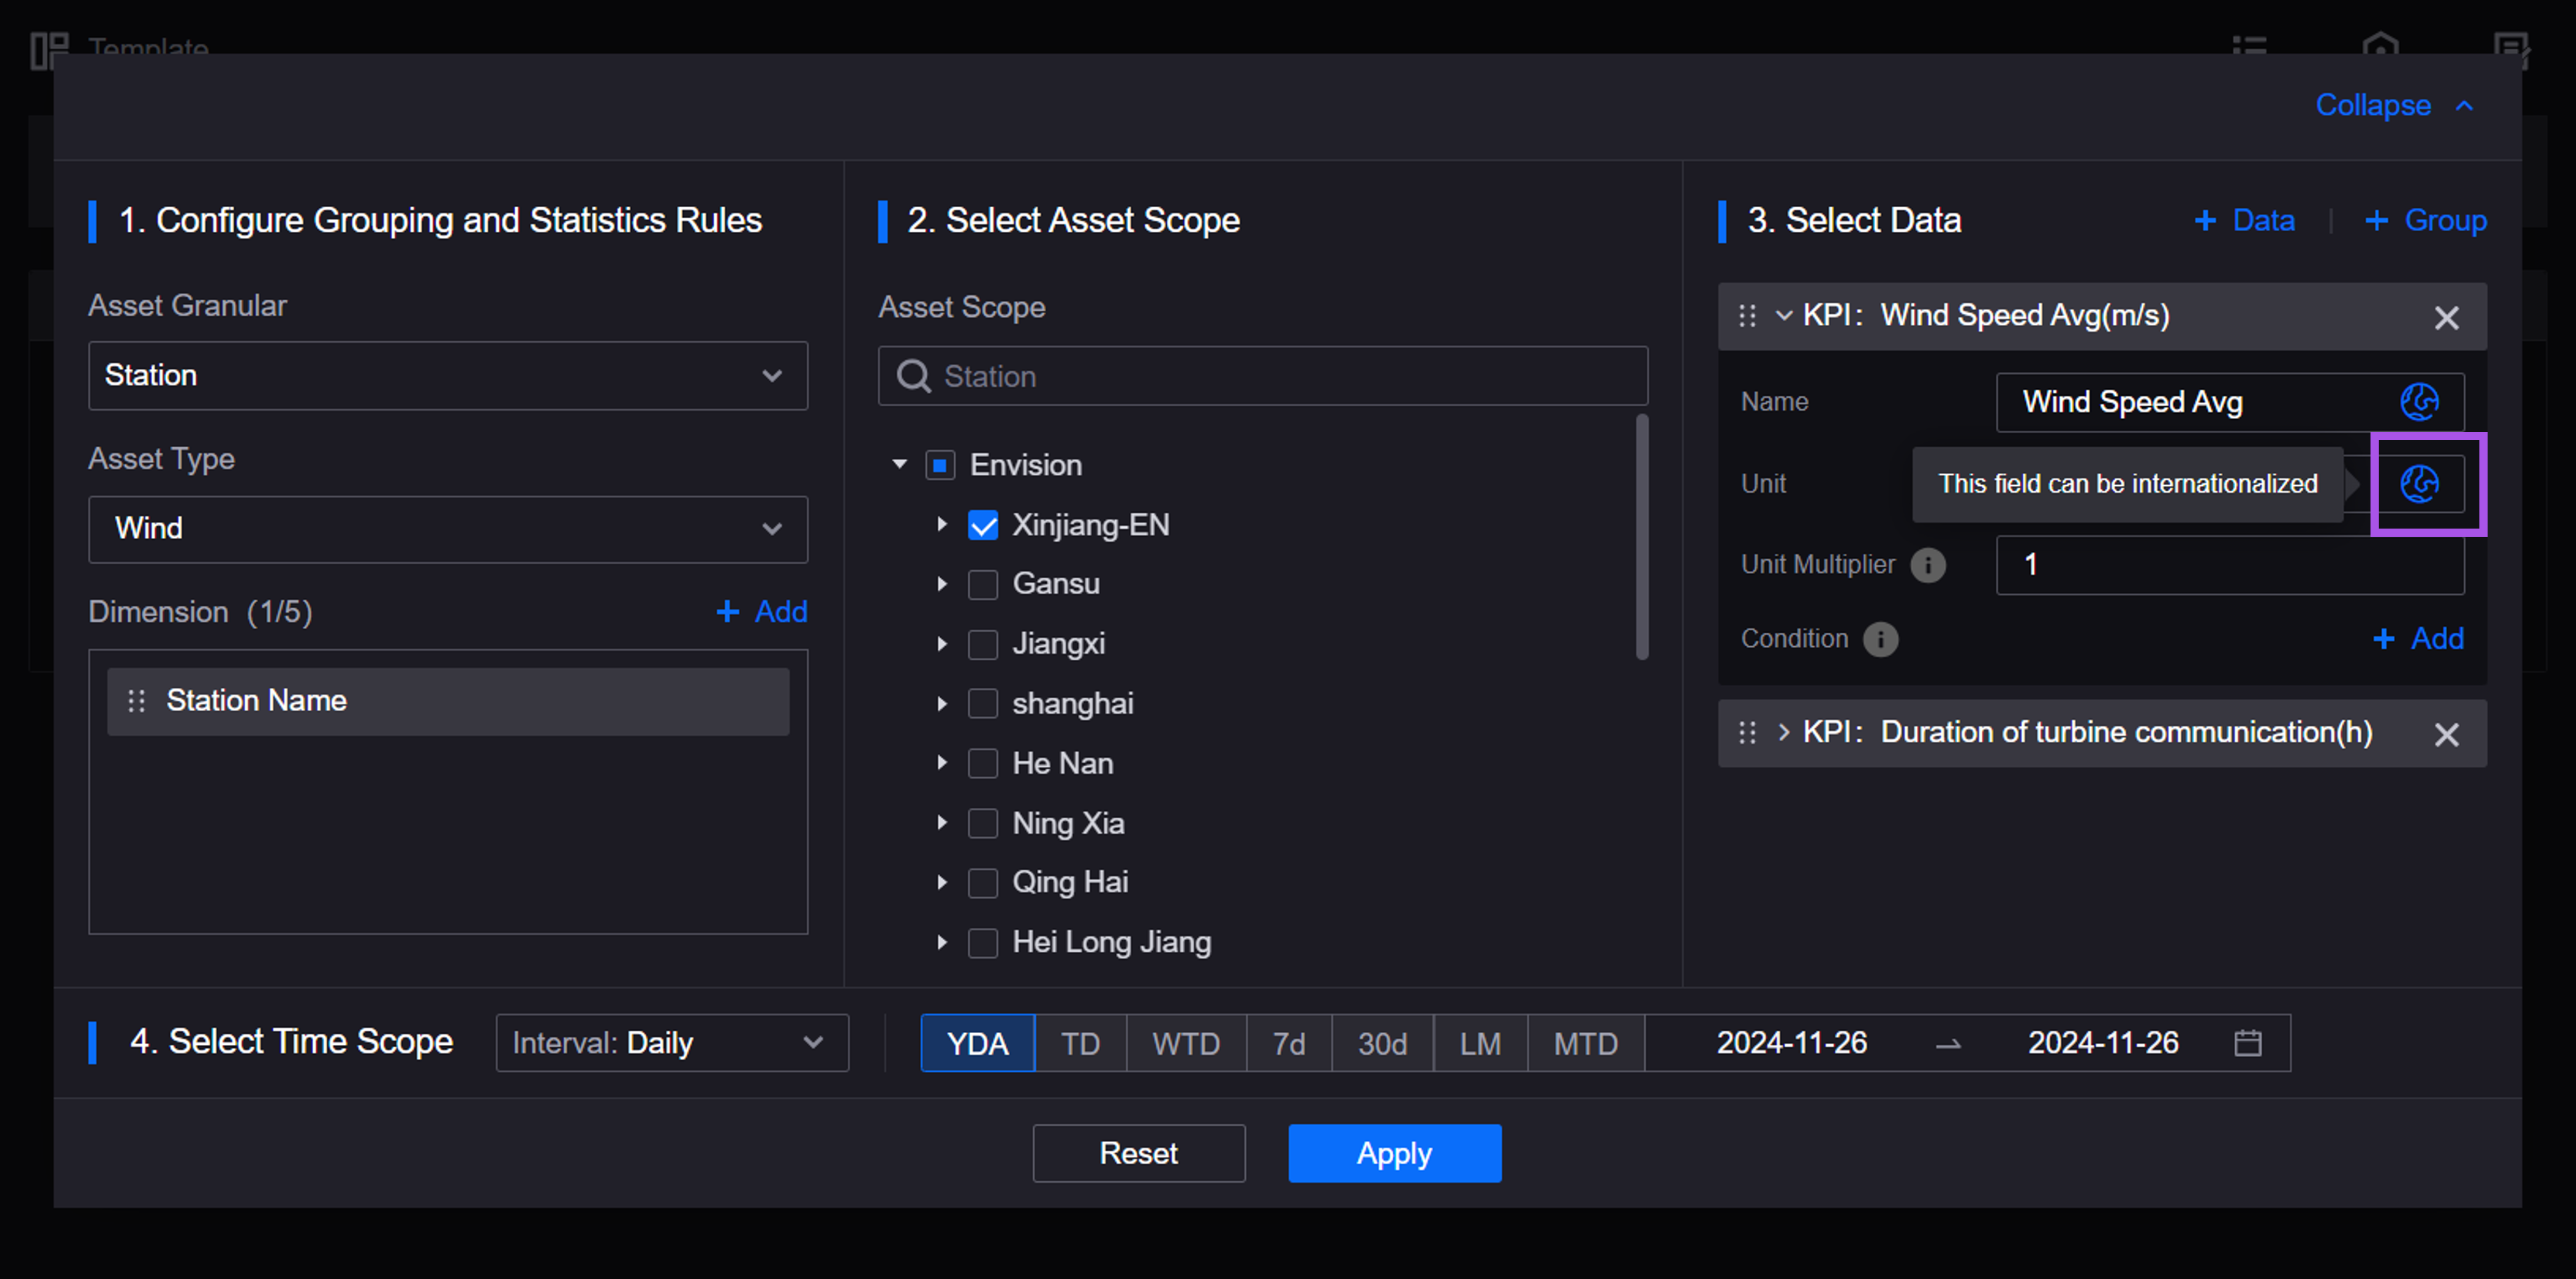
In the filter of the Common KPI Inquiry terminal page, users can configure internationalization for the units of data items to adapt to page display in different languages.
Reporting Tool
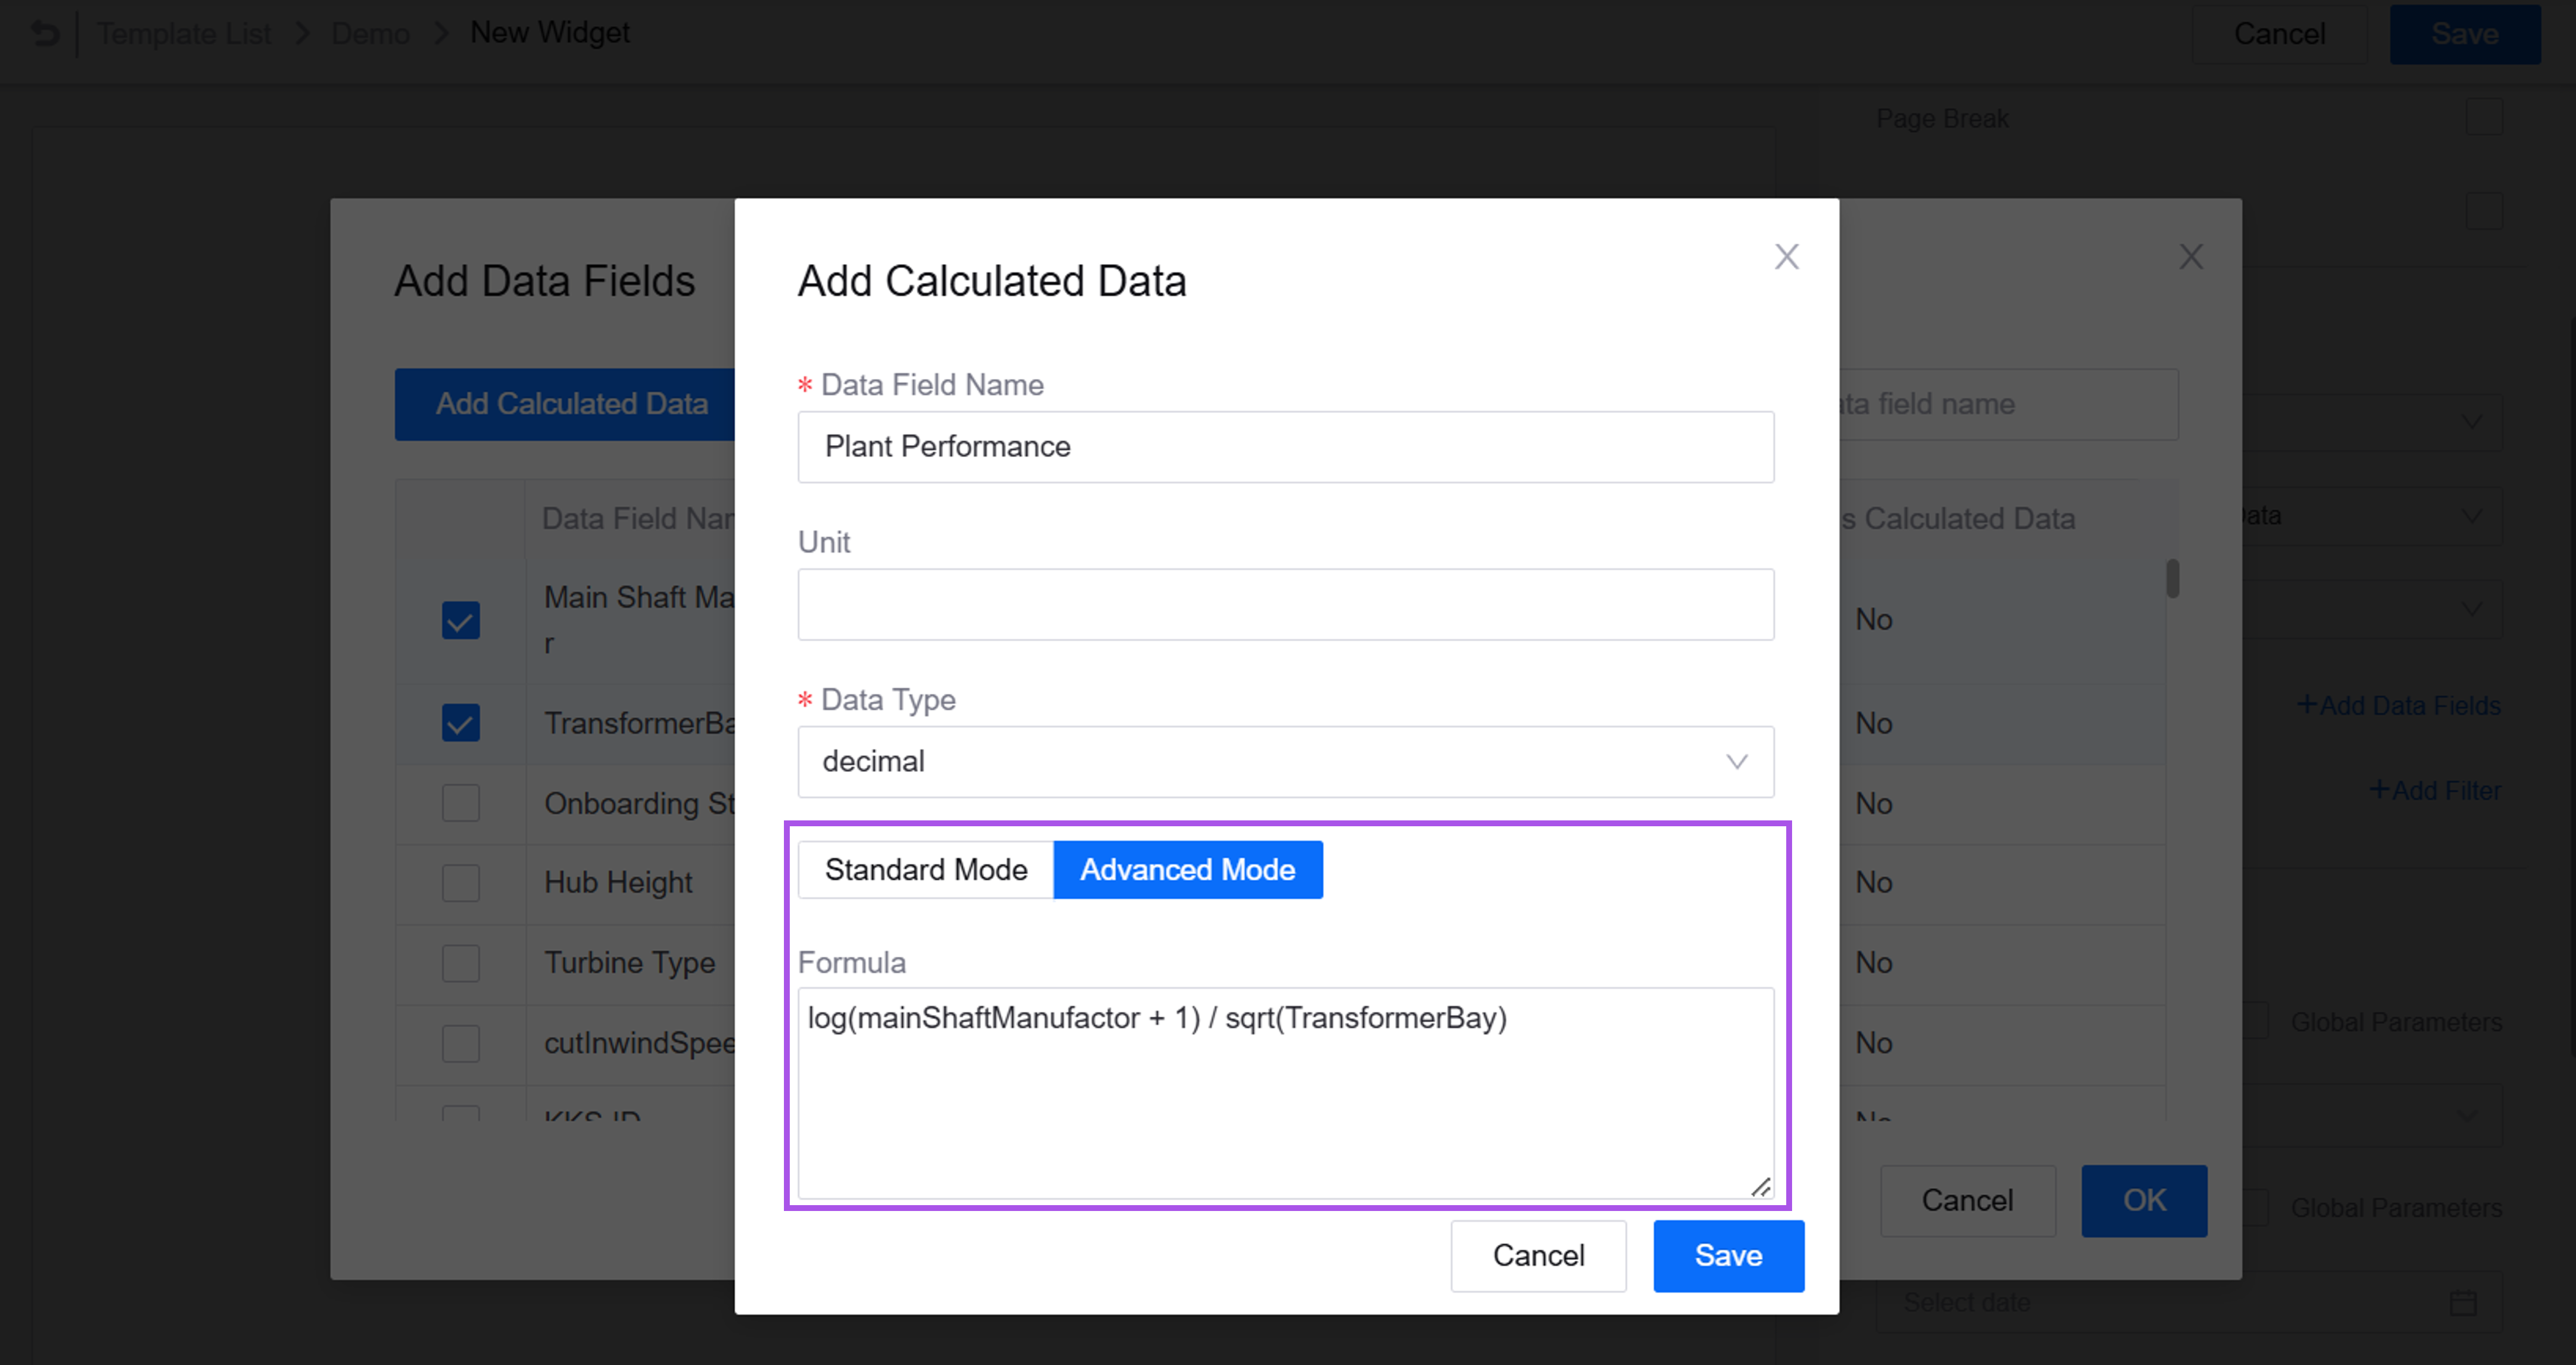
When application creators add calculated data to the widgets of the report templates in Report Template, they can flexibly define calculated data through expressions.
Work Management
Users can view, create, edit, and transfer work orders and service requests offline on the mobile terminal to update maintenance information even when the network is interrupted.
Added the Rule Type, Rule Expression and Rule Error Log columns in the form field configuration file of Work Order Settings. Application creators can configure cross-field validation rules in the work order, such as comparing the values of field A and field B. This helps users quickly identify and correct errors, improving the efficiency of work order configuration.
Metric Management
Supports data from the Open Gauss database connected via B-mode.
Device Connection
Alarm Management
Added Alarm Jump in Custom Page Configuration of Alarm Config, application creators can add jump buttons for specified types of alarms. Users can jump to the specified page to quickly view more detailed information by selecting the button.

Added alarm group permission control. OU administrators can assign permissions to users for alarm groups. Users with permissions can view, create and use alarm data within the group.
Added the Active Alarm Device Count(ID: Activealarm_Devices_Count) public metric. Application creators can query the number of devices with active alarms within a site based on the site ID using EnOS Common Data Service APIs .
Application creators can use device type as the dimension to query the Alarm Amount, Active Alarm Amount, Closed Event Amount and Confirmed Event Amount metric data using EnOS Common Data Service APIs.
Application creators can contact the system administrator to configure the sender of alarm emails and SMSs, alarm email and SMS templates, and the domain name of the links in the emails for the OU.
Application creators can contact the system administrator to migrate alarm metadata to another OU for quickly application initialization.
Alert Engine
Added the following secondary menus under Configuration Management:
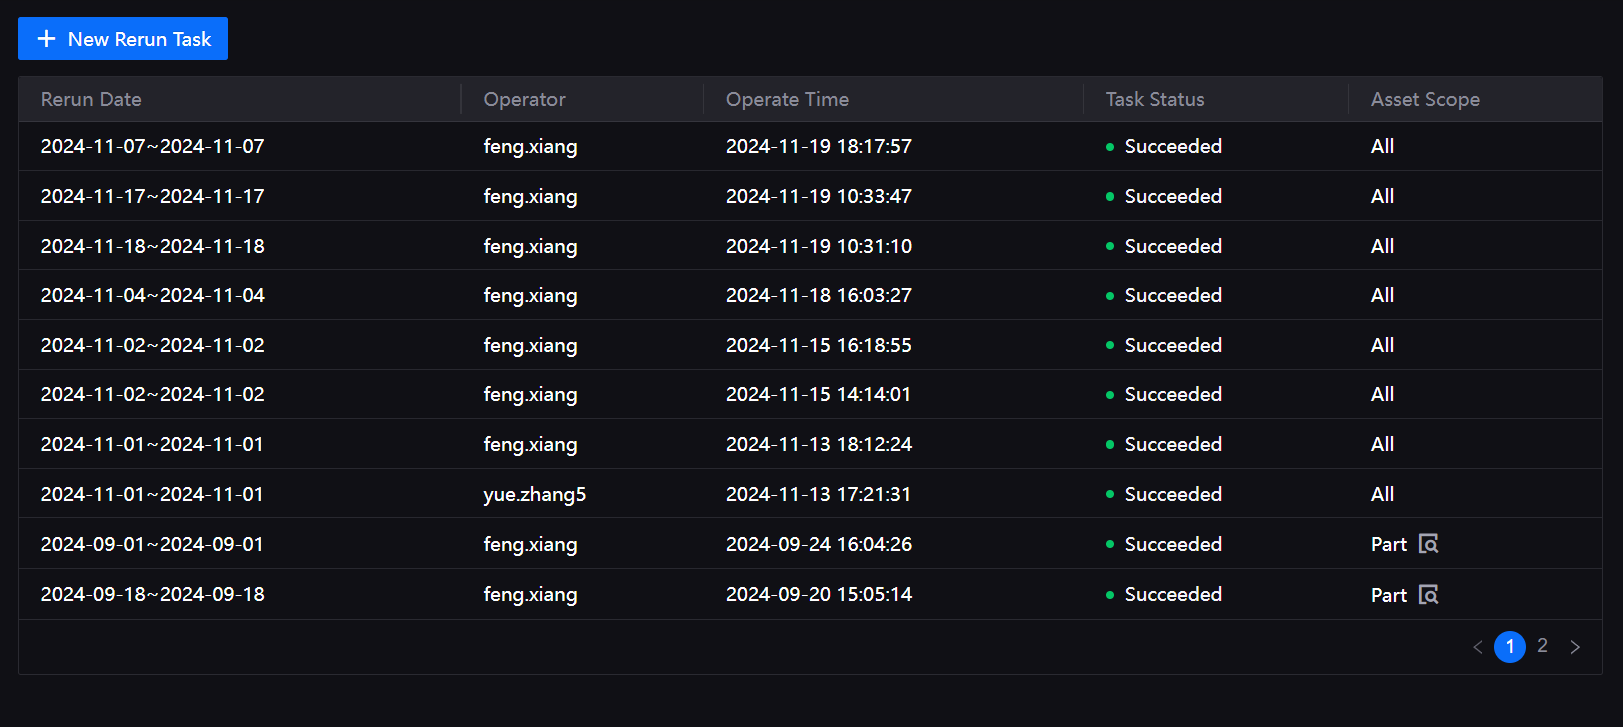
Quality Rerun: asset administrators can re-evaluate the quality of the asset’s historical data according to the existing evaluation rules to improve the accuracy of the quality analysis results.
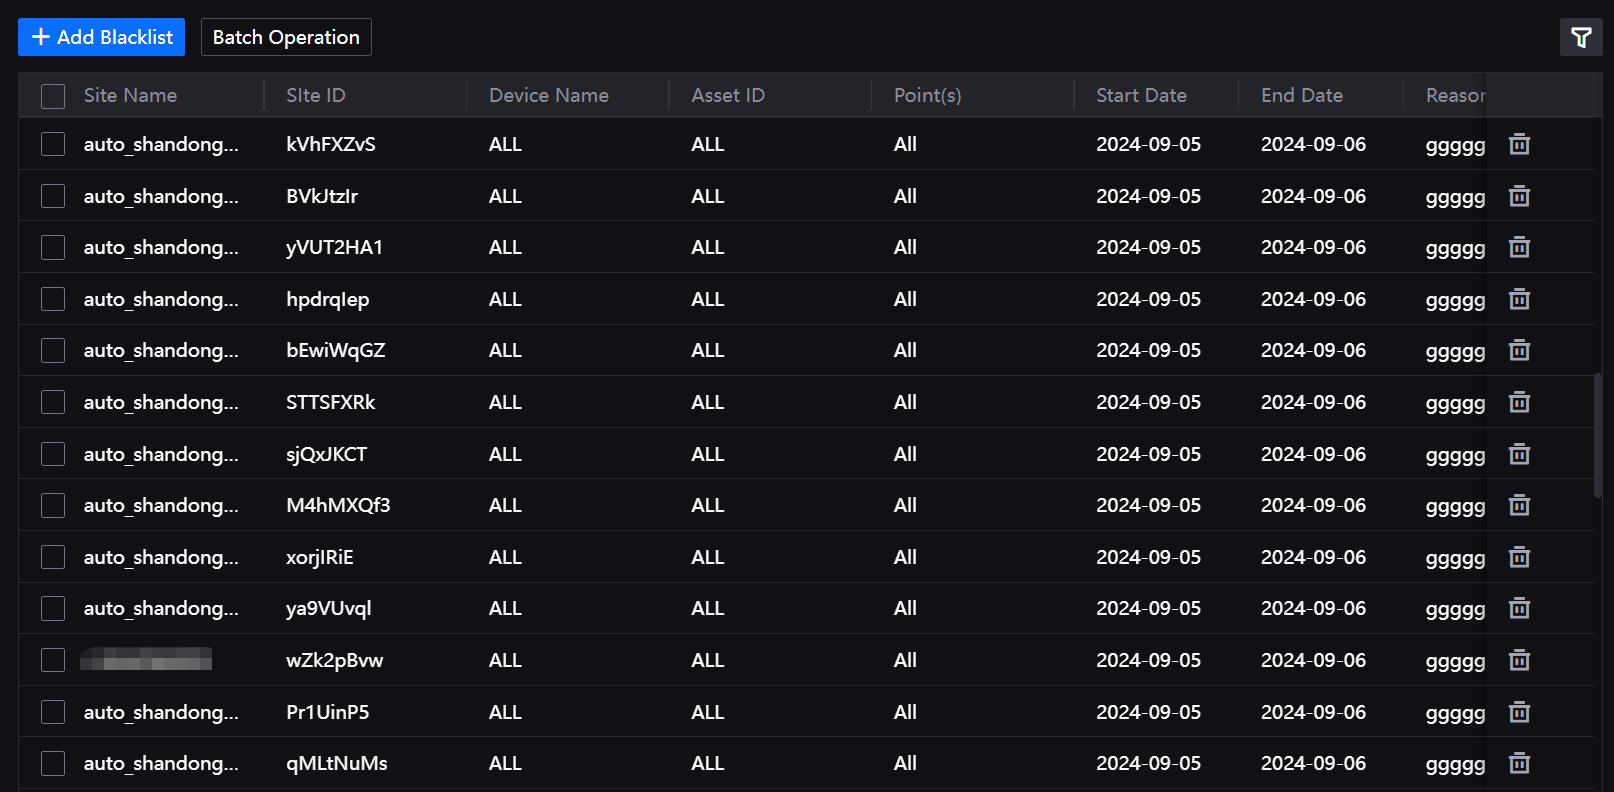
Device Blacklist: asset administrators can add devices or measurement points that do not need to be calculated to the blacklist, and set the time range to improve the flexibility of data quality calculations.
