Using Portfolio
This page describes how application users view asset information in the Portfolio pages and customize elements and style of the Portfolio pages. An example of a Portfolio page displays as below.

For more information about the elements on a Portfolio page, see Exploring Portfolio.
Note
The layouts and functions in your applications might be different from the contents introduced in this article, because of the customization on layouts and functions for Unified Monitoring pages. Contact the application creator for more information.
Prerequisites
Before you start, make sure that you are assigned with the required asset permissions, operational permissions, and a menu group containing the Portfolio page. If not assigned, contact your application administrators.
Editing Maps and Canvases
You can edit the information such as functions and styles of asset maps and canvases in the Portfolio pages by selecting functional buttons on the shortcut toolbar as below.

The shortcut toolbar provides the following functional buttons.
Functional Buttons |
Description |
|---|---|
Open the panel to configure functions and styles of the current map and canvas. |
|
Change the type of the current map. For more information about changing map types, see Changing Map Types. |
|
Collapse or expand the canvases on the current page. |
|
Enter or exit the full screen mode. In full screen mode, the top toolbar and the left navigation panel of Application Portal will be hidden. |
|
Adjust the zoom level of the map. |
|
Restore the default zoom level and center point of the map. |
Changing Map Types
Portfolio supports administrative map, geographical map, road map, electronic chart, and 3D map. Change the map type of the current Portfolio page by the following steps:
Select Portfolio from the left navigation pane.
Note
The menu name in your applications might be different from the name in this article, because of the customization on menu names for Unified Monitoring pages. Contact your application administrators for more information.
On the shortcut toolbar of the Portfolio page, select Map Type
 .
.Select the map type you want to change to from the dropdown list. The new map type takes effect immediately. If certain map types are not on the dropdown list, contact your application creators.
Editing Page Functions
Select Portfolio from the left navigation pane.
On the shortcut toolbar of the Portfolio page, select Map Settings
 to open the setting panel on the right.
Enter the following information on the Map Settings tab.
Field
Description
Show Area Boundary
Highlight the boundary of China on the map.
Show Minimap
Display a minimap.
The minimap is only available in administrative maps.Show Map Mask
Display a translucent mask on the current asset map.
If the widgets on the canvases are not displayed clearly because of the complicated information on the asset map, enable this function to make the widgets displayed more clearly.Hide Action Buttons
Hide the icons on the shortcut toolbar if the cursor is not hovering on the toolbar.
If you don’t need to edit the asset map on a frequent basis, enable this function to display more information on the asset map.Show Asset Location
Display asset icons or asset aggregation icons.
Show Asset Name
Display the asset name under each asset icon.
Enable Asset Aggregation
After enabling Show Asset Location, display the total data of all assets within the certain range specified in Aggregate By.
Aggregate By
After enabling Enable Asset Aggregation, select the range to aggregate asset information. To add or modify aggregating ranges, contact the application creator.
Show Aggregation Name
After enabling Enable Asset Aggregation, display the name of the aggregating range under the aggregation icon.
Show Legend Filters
Display the legends in the bottom right corner of the asset map.
You can select the status name tags from the legend to show or hide assets in the specified status.Show Donut Chart
After selecting
regionin Aggregate By, display the aggregation icons as donut charts.
You can enable this function to display the progress towards a goal or metrics in percentage on aggregated site icons.Looping Display by Provinces
After enabling Enable Asset Aggregation, display the data of each province-area level by floating cards.
Note
Depending on map type and Portfolio configuration, the functions on the Map Setting tab might be different from the fields mentioned above. For more information, contact your application creators.
Enable or disable the whole canvases or each widget on the Left/Right/Top/Bottom Canvas tab.
(Optional) Select Save as Default. When you open the Portfolio page for the next time, the page will displays as the configuration you saved above.
Switching Asset Maps
You can switch asset maps by the following methods in Portfolio pages:
By selecting assets in asset filters
By selecting asset icons
Switching Asset Maps by Selecting Assets in Asset Filters
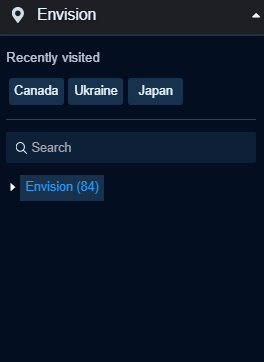
Asset filters display the hierarchical structure of the current asset scope, which can be shown as below.

Switch to the target asset map by selecting assets in asset filters by the following steps:
Select Portfolio from the left navigation pane.
(Optional) If your account has access to multiple organization structures, you can select
 and switch the organization structure displayed in Portfolio from the dropdown list.
Select the name tag of the current group or region to open the asset filter.
Select the assets from the Recently Visited section or from the hierarchical asset tree to open the corresponding Portfolio page.
(Optional) In a region or site map, select the return icon
 on the right of the Asset Filter to return to global map (from region and site maps) or region map of the site (from site map).
Note
When you open another region or site map, the information on widgets and asset type statistics will also change accordingly.
If the Asset Filter is not enabled on the current Portfolio page, the return icon is displayed on the shortcut bar.
Switching Asset Maps by Selecting Asset Icons
Asset icons display the information of an asset such as name, status and data on asset maps. An asset icon can be in the style of “Icon” or “Aggregation”.
Asset icons represents sites in a global or region map, or devices in a specified site map. In a global or region map, you can select the asset icon to switch to the site map.
Filtering Assets
You can filter the target assets with filters and open corresponding site or region maps. Portfolio provides the following filters:
Asset Status Legend
Asset type filter
Dimension filter
Legend filter
Filtering Assets with Asset Status Legends
You can use asset status legends to filter assets in the specified status for each asset type.

Filter the target assets with the filter legend by the following steps:
Select Portfolio from the left navigation pane.
Select the tags in the legends to show or hide assets of the corresponding status.
Asset status tags displayed on the current map are indicated by the corresponding color blocks that match the colors shown at the bottom of asset icons. For example, if the current map does not show assets in the Normal status, select Normal in the filter legend and a corresponding color block appears in front of the tag and the asset map displays assets in the Normal status, as shown below.

Filtering Assets with Asset Type Filters
When there are multiple asset types under the current asset hierarchy, such as wind, solar, and thermal, you can view the details of a target asset type by using asset type filter as below.

Filter the asset information displayed on canvas widgets with the asset type filter by the following steps:
Select Portfolio from the left navigation pane.
Select the asset icons in the asset type filter to display the information of assets the specified asset type on widgets.
Filtering Assets with Dimension Filters
You can use dimension filters to filter assets with specified dimensions, such as types, provinces, and programs.

Note
If you need to change the dimensions for filtering, contact application creators.
Filter the target assets with dimension filters by the following steps:
Select Portfolio from the left navigation pane.
Select the dimension filter on the asset map and configure filter conditions in the dropdown list.
Filtering Assets with Legend Filters
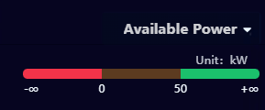
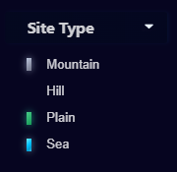
You can use legend filters to filter assets with the specified values of asset attributes, measurement points or metrics.
For numeric data fields

For non-numeric data fields

Note
If you need to change the data fields for filtering or the filter conditions, contact your application creators.
Filter the target assets with legend filters by the following steps:
Select Portfolio from the left navigation pane.
Select the dropdown box in the legend section at the lower right corner of the asset map, and specify the attribute, measurement point, or metric for filtering.
Select name tags (for non-numeric data fields) or color blocks (for numeric data fields) in the legend filter to show or hide corresponding assets.


