About Digital Twin Visualization
If enterprises develop their own IoT visualization applications, high development cost and a long cycle of application delivery are often required. In addition, the business scenarios of enterprises change rapidly, different users and roles have different needs on the customization of visualization pages, and the scalability of their applications is relatively low.
The EnOS Digital Twin Visualization (DTV) service provides enterprises with data visualization solutions. It is integrated with EnOS Application Portal to help domain experts and developers achieve the visualization of the data from digital twin modeling through low-code/no-code drag-and-drop experience, which helps to improve the development efficiency of visualization applications and enhance the reuse of applications in different domain.
Key Features
The key features of EnOS DTV include:
Simple Drag-and-drop Experience on Building Data Visualization Pages
Without coding, business experts or developers can quickly build the indicator analysis and monitoring visualization pages by dragging and dropping widgets in the editing page provided by DTV.
Drag-and-drop adjustment of layout: The widget size is customizable and can adapt to the screen size of different devices.
Configurable widget style: You can select different widget types and configure the widget style according to different data visualization requirements.
Direct editing and adjustment allowed in the application: With the DTViz SDK, application users can directly modify the page layout and data configuration in the application.
Plug-and-play Data Binding and Processing
The EnOS DTV provides a unified outlet for the data from multiple sources as well as flexible data processing capabilities, enabling rapid data acquisition, aggregation and analysis.
Binding of multi-source and cross-domain asset data: It supports importing and synchronizing multiple types of data sources. After the asset data sources are bound, business personnel can more directly and conveniently configure the business data corresponding to the visualization widgets.
Asset data aggregation processing: Basic data aggregation processing capabilities are available, including sum, average, maximum, minimum and other calculations.
Custom data fields: It supports processing custom data fields through low-code scripts.
Domain Knowledge Template Accumulation
With the domain accumulated built-in widgets and templates, developers can reuse templates to quickly build data visualization pages. In addition, users can further accumulate and share highly reusable widgets and templates, improving their development efficiency.
Widget template: It allows to save the configurations of a single widget. Through the widget template, users can save the configurations on widget data binding and style, and accumulate their insights of business data and their experience on business data visualization.
Dashboard template: It allows to save the configurations of a single dashboard. Users can integrate their insights of business into a dashboard template through the combination of multiple widgets as well as interactive operations such as configuring filters or widget link for widgets.
Application Scenarios
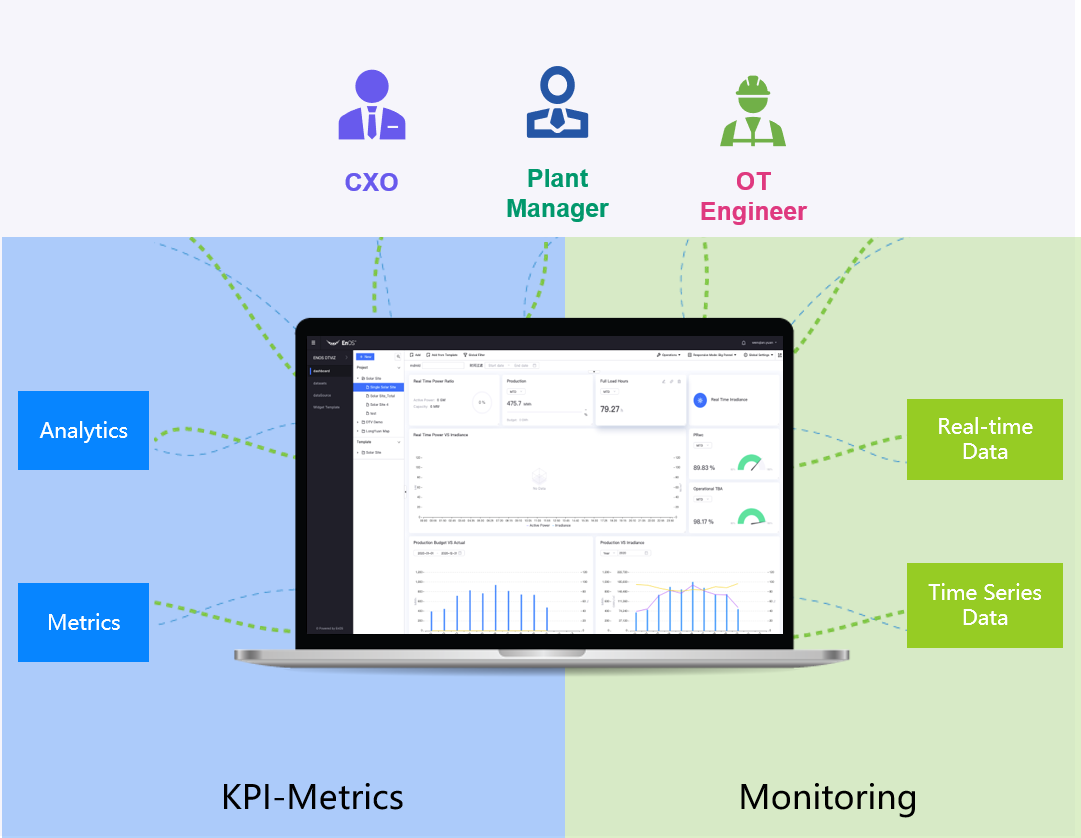
The EnOS DTV provides the no-code and low-code development of operation interfaces for the operation management personnel, project management personnel and O&M engineers in the energy production and energy consumption industries.
Business Scenarios
In the business scenarios of energy production and consumption, the indicator display page combined with GIS, the KPI indicator page combined with factory monitoring screen, and the monitoring pages of production materials and equipment can provide very important management and O&M basis for operation management personnel, factory management personnel and O&M engineers. The operation management personnel, factory management personnel and O&M engineers all need customize the display of these indicators based on their actual business conditions and their own insights.
With the EnOS DTV, operation management personnel, factory management personnel and O&M engineers can customize their own indicator or monitoring interfaces, which help to reduce the repeated communication with front-end and back-end developers, making the entire development process more agile, reducing development costs, and facilitating the quick iteration of indicator or monitoring interfaces based on the changes of production environment.
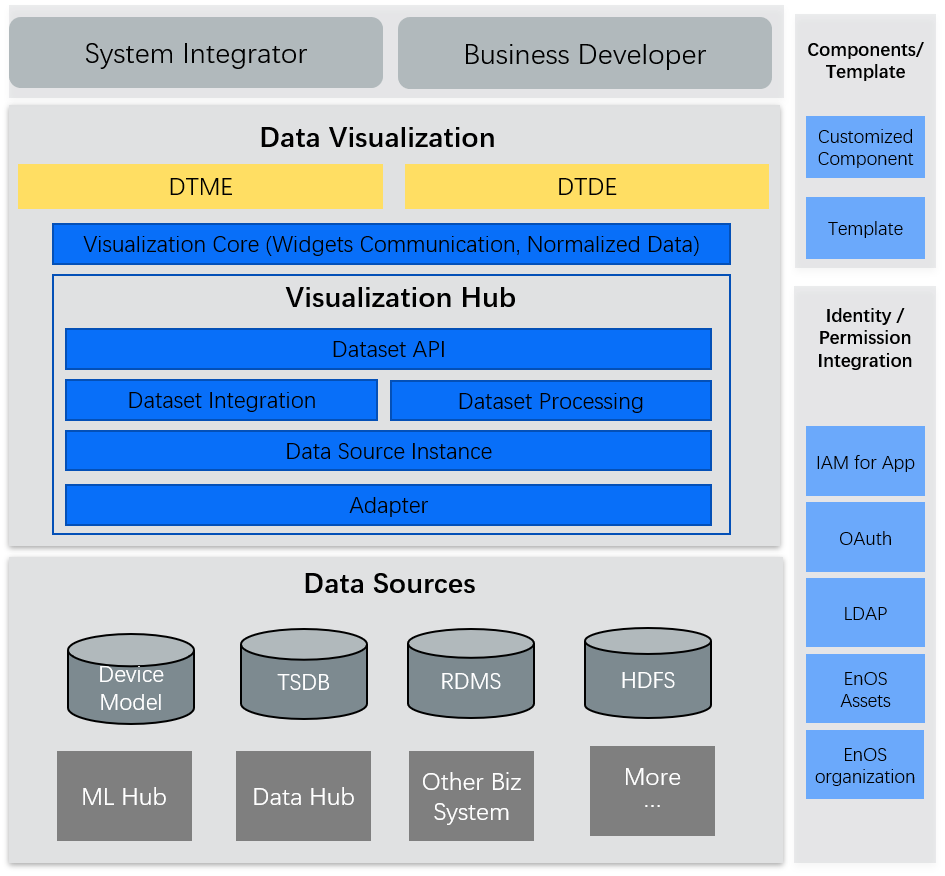
System Architecture
The EnOS DTV mainly consists of the following engines:
DT dashboard engine (DTDE)
DT monitoring engine (DTME)
Its system architecture is shown below:
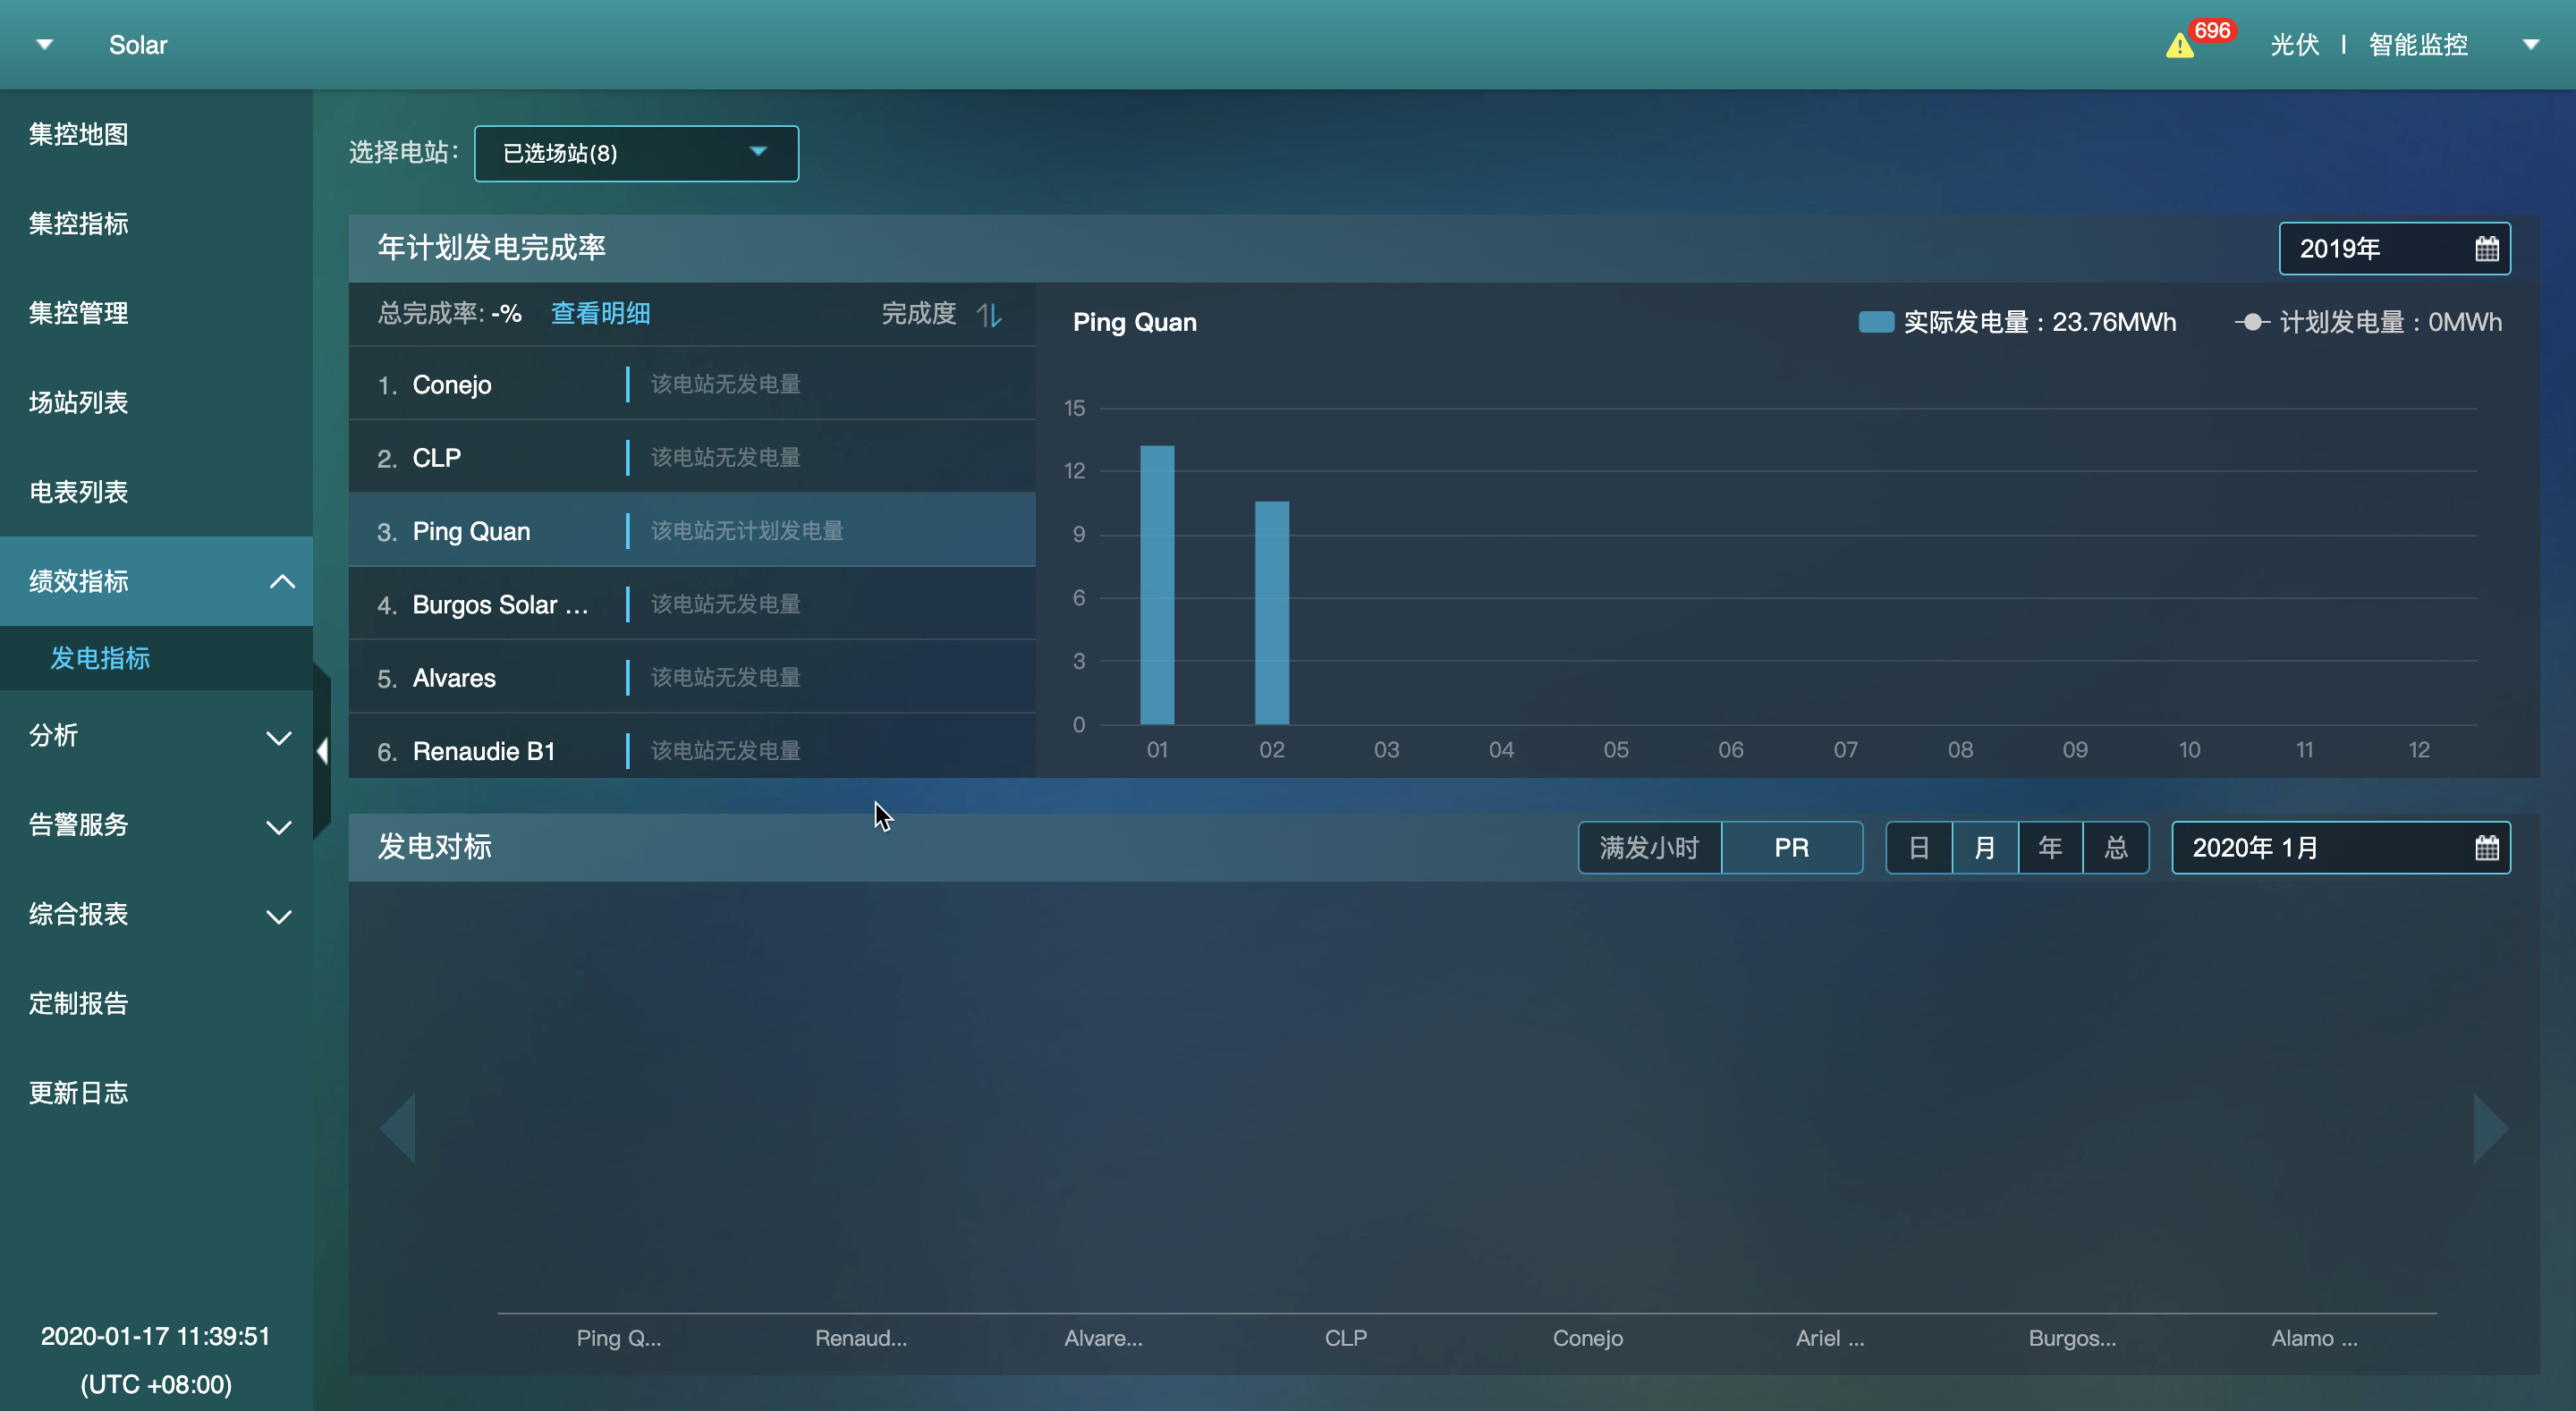
DT Dashboard Engine (DTDE)
DTDE is a data visualization tool provided by DTV, which is mainly for KPI visualization scenarios. You can quickly build data statistical analysis pages by dragging widgets and configuring widget properties, data sources and interactive actions. The built dashboard pages can be previewed in the EnOS Console and can be integrated in the form of iframe into the third-party applications for use.
A sample of performance comparison page built through DTDE is shown below:
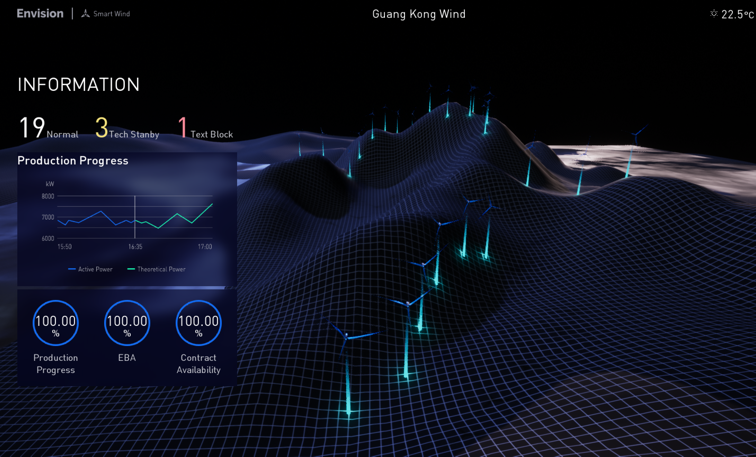
DT Monitoring Visualization Engine (DTME)
DTME is an industrial visualization tool provided by DTV, which is mainly for monitoring scenarios. You can quickly build industrial monitoring pages by dragging widgets and configuring widget properties, data sources and interactive actions. The built industrial monitoring pages can be previewed in the EnOS Console and can be integrated in the form of iframe into the third-party applications for use.
A sample of industrial monitoring page built through DTME is shown below:
Data Source
The EnOS DTV supports importing and synchronizing data from multiple data sources. Through simple configuration operations, you can quickly bind multi-source and cross-domain asset data as a unified data outlet, and can perform basic data aggregation operations or script-based custom data processing.