Building Data Dashboard with DTDE
The DT dashboard engine (DTDE) is a data visualization tool provided by DTV, which is mainly for KPI visualization scenarios. You can quickly build monitoring pages by dragging widgets and configuring widget properties, data sources and interactive actions.
Product Composition
The DTDE consists of the following modules:
Dashboard Editor: Supports dragging and arranging chart widgets on the canvas.
Chart Editing: Click a chart on the dashboard editor to enter the chart editing view, which is divided into two parts:
Data Editing: Combine the data in the data source according to three categories, i.e. Dimensions, comparisons and measurements.
Chart Editing: select the combination of dimensions, comparisons and measurements selected in the data editing to fit the matching chart
Data Source Management: Import external data to DTDE Management Center for data viewing, adding, modifying and deleting
Data Set Management: Supports previewing and preprocessing data sets, i.e. the data imported or synchronized through the data source
Widget Store: The Custom widgets provided by third-party developers can be shared in the widget store
Permission Management Workbench: The authorization of configuration projects (for platform users and application service accounts) can be managed under the IAM management module in the EnOS Console
Three-Party Integration SDK: SDK used for integrating configuration pages in three-party applications
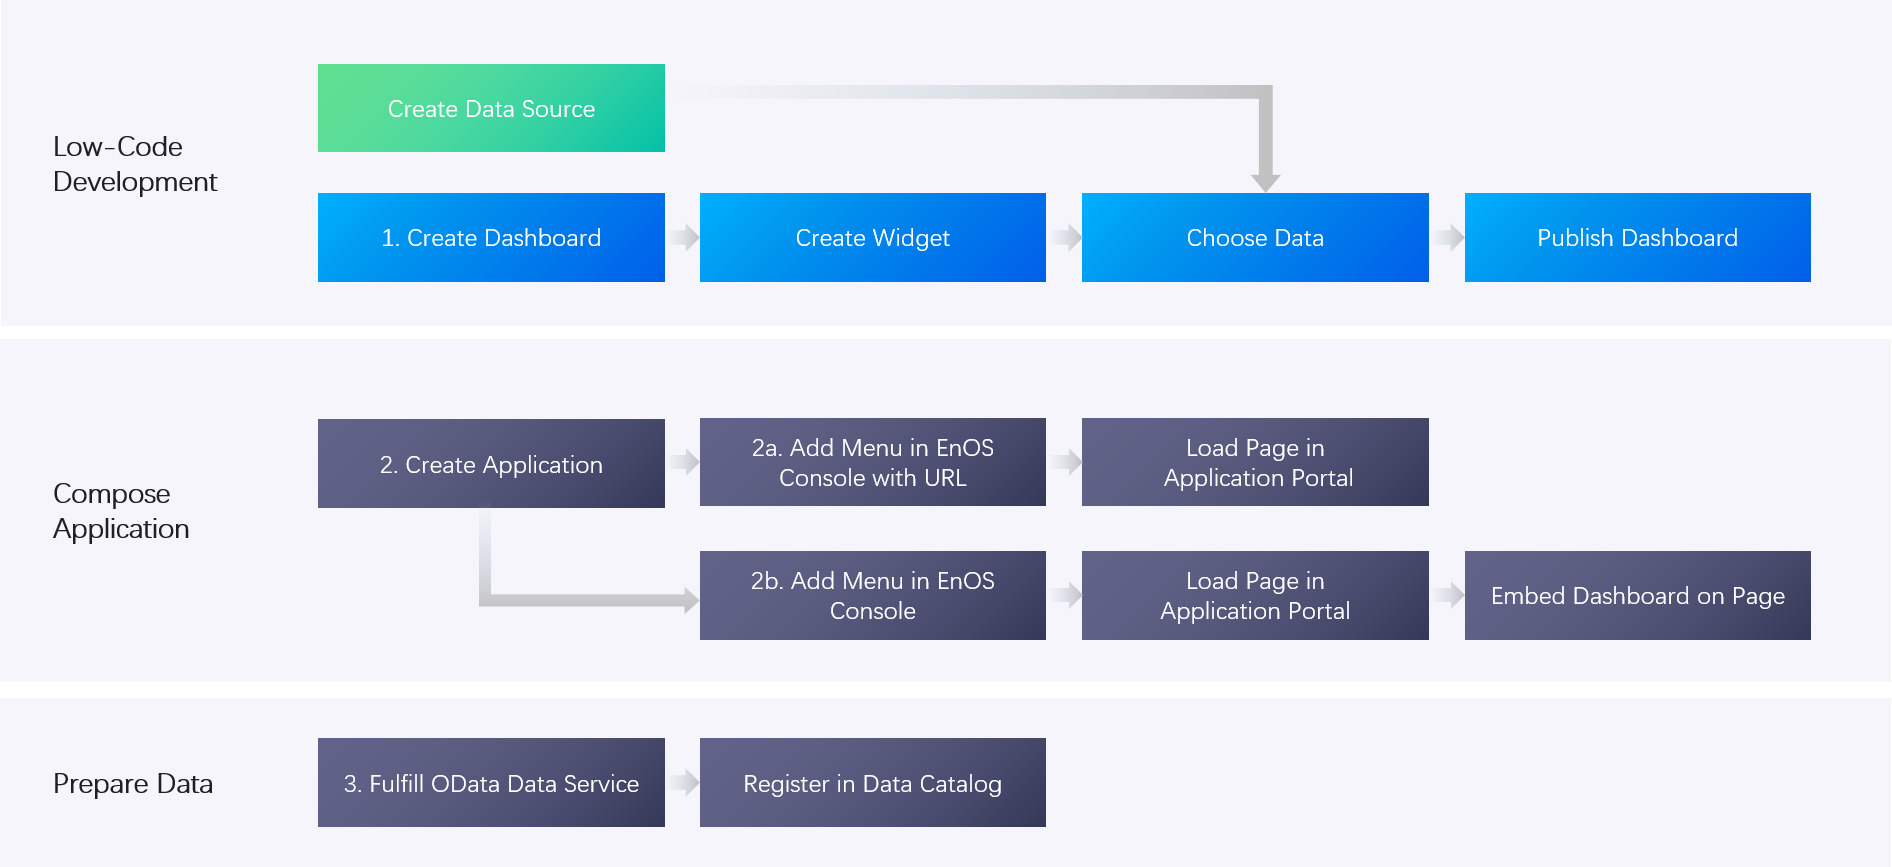
Development Process
The development process for using DTDE to build a data statistical analysis page is shown below: