Quickstarts: Understanding Digital Twin Dashboard
DTD consists of these modules:
Data Source Management: Imports data to DTV for data viewing, adding, modifying and deleting
Dataset Management: The data imported or synchronized through a data source is called a dataset, and the dataset can be previewed and pre-processed
Widget Library: Provides a rich library of built-in widgets for easy building of visualization pages
Page Editor: Supports dragging and arranging chart widgets on the page.
Chart Editor: Clicks a chart on the dashboard editor to enter the chart editor, which is divided into two parts:
Data Editing: Combines the data in the data source according to three categories, i.e. dimensions, comparisons and measurements.
Chart Editing: Selects the combination of dimensions, comparisons and measurements selected in the data editing to fit the matching chart
Three-Party Integration SDK: SDK used for integrating configuration pages in three-party applications
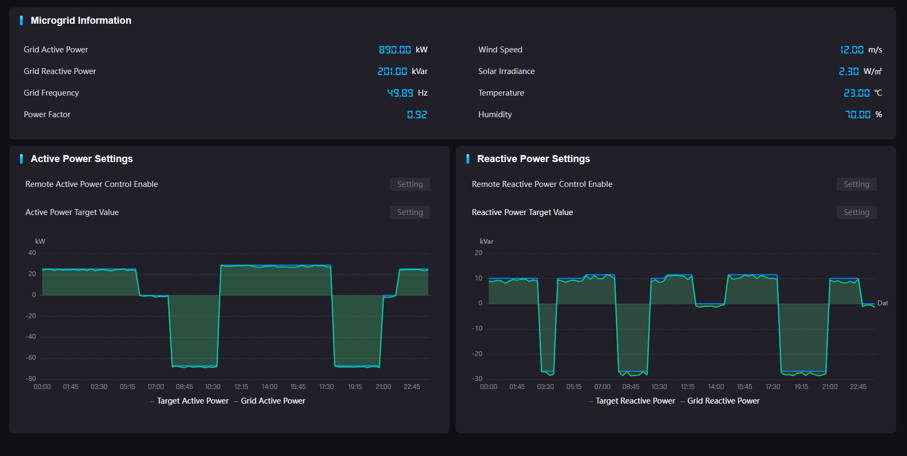
A sample of the metrics page built through DTD is shown below.
Procedure
Process for building a metric page using DTD.
Connect to data sources
Drag and drop widgets to build metrics pages
Publish the metrics page
The process is shown in the figure below.
