What’s New in R2502?
This article introduces the new services and features included in EnOS R2502.
Application Building
Application Portal
Added Category Navigation Mode for end users to quickly switch categories and applications at the top and menus in the left sidebar. System administrators can configure available navigation modes for the current OU, enabling end users to switch modes via the top-right pop-up.
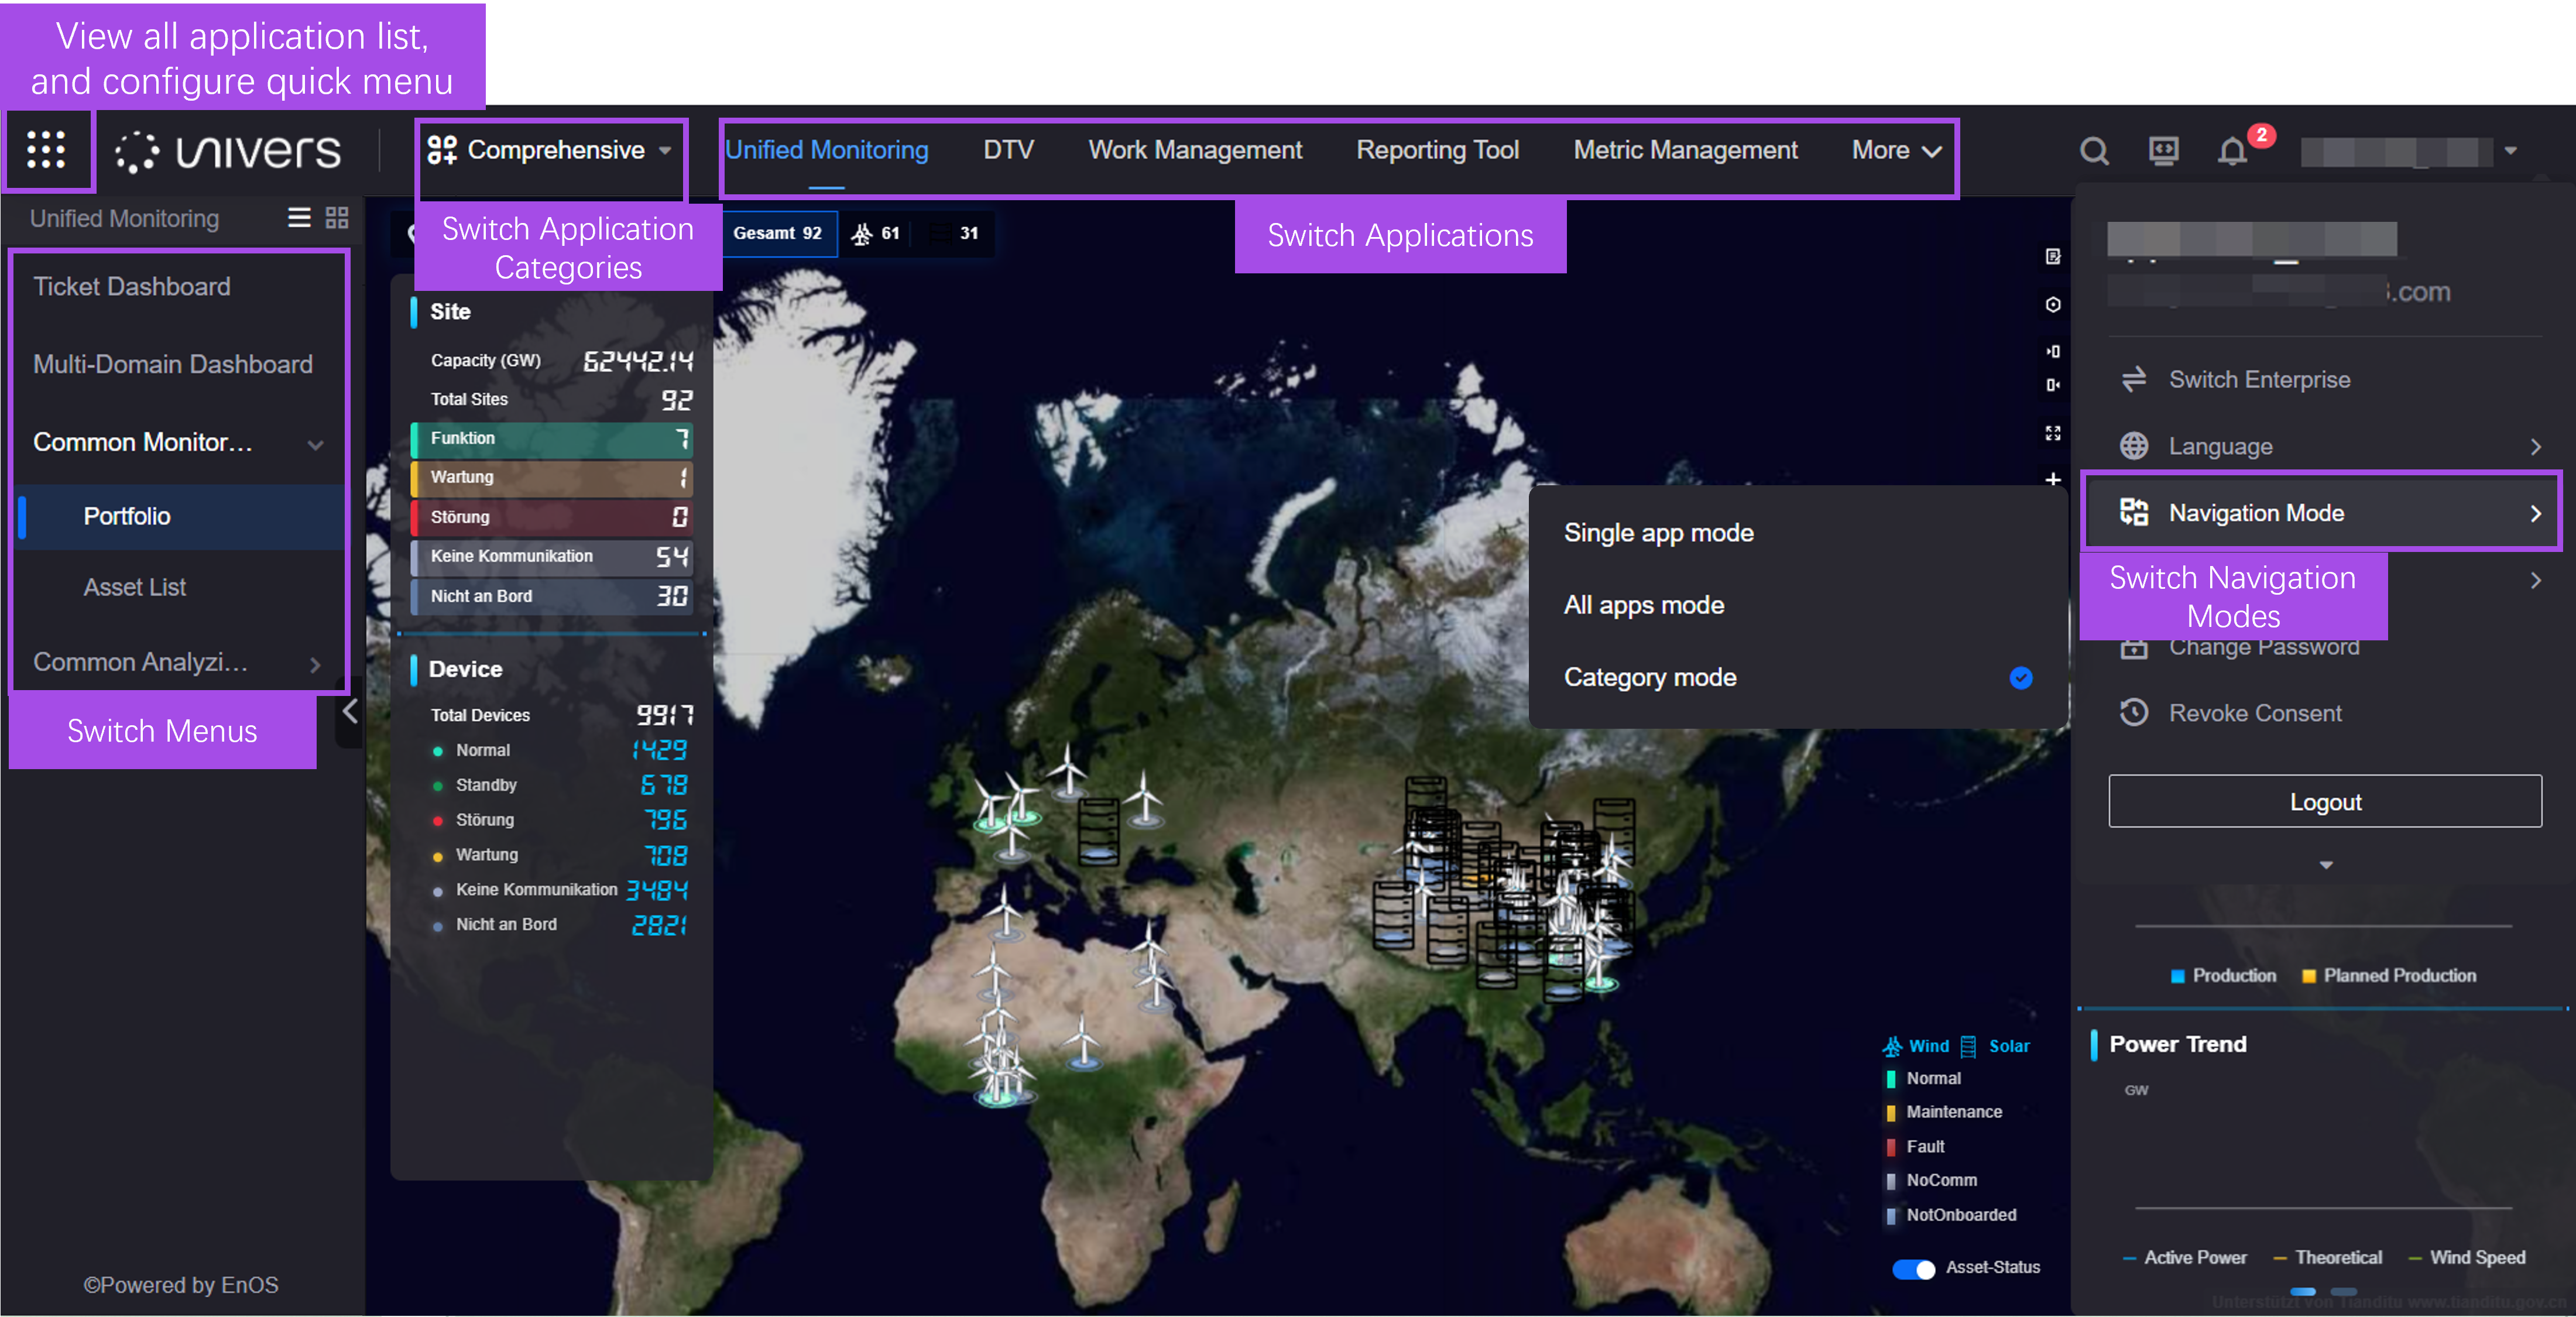
Added a blue theme. End users can switch themes via the top-right pop-up.
Application developers can contact the system administrator to set an IP address whitelist, allowing specific networks to access Application Portal.

Digital Twin Visualization
In Single Page Applications, application developers can perform the following actions:
Link site hierarchies to canvases in the site filter. When an end user select assets at different hierarchy levels in the filter, different canvases will be switched.
Link time series chart widgets with trigger actions, linked widgets, and conditions. After an end user perform a trigger action, the linked widgets will display data that meets the conditions.
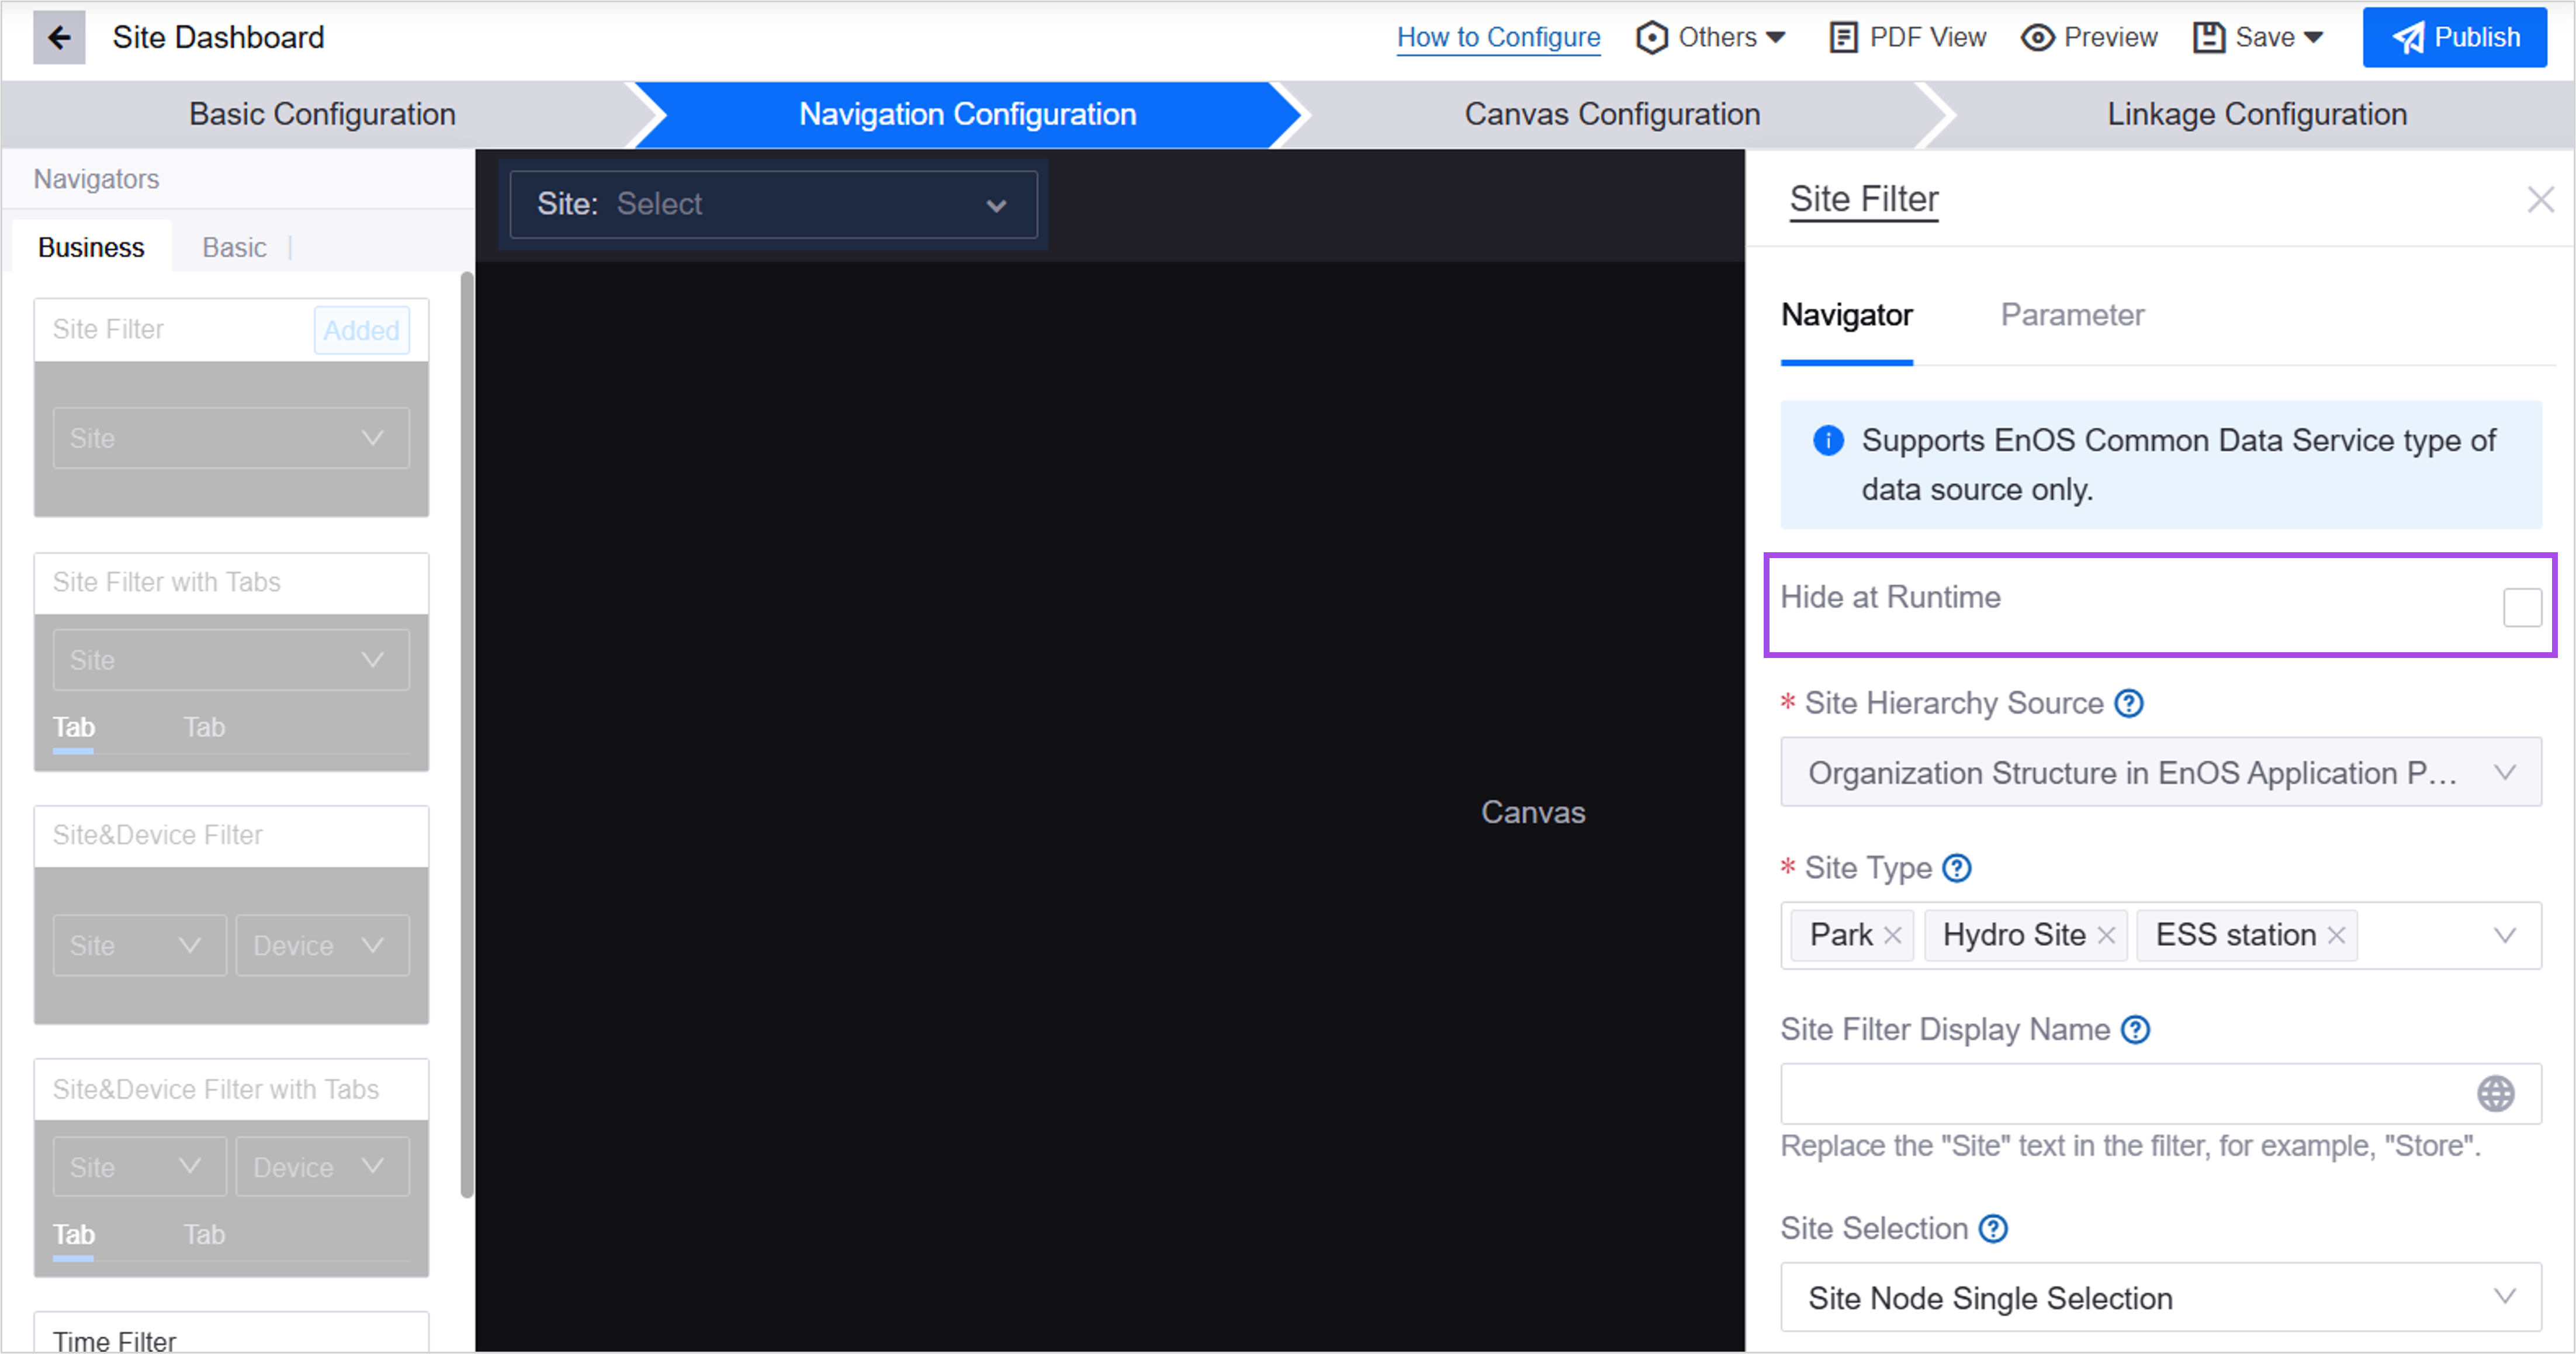
Hide or display the navigators in the end user’s configuration page. When the navigators are hidden, all end users will be unable to modify the navigators’ configurations.
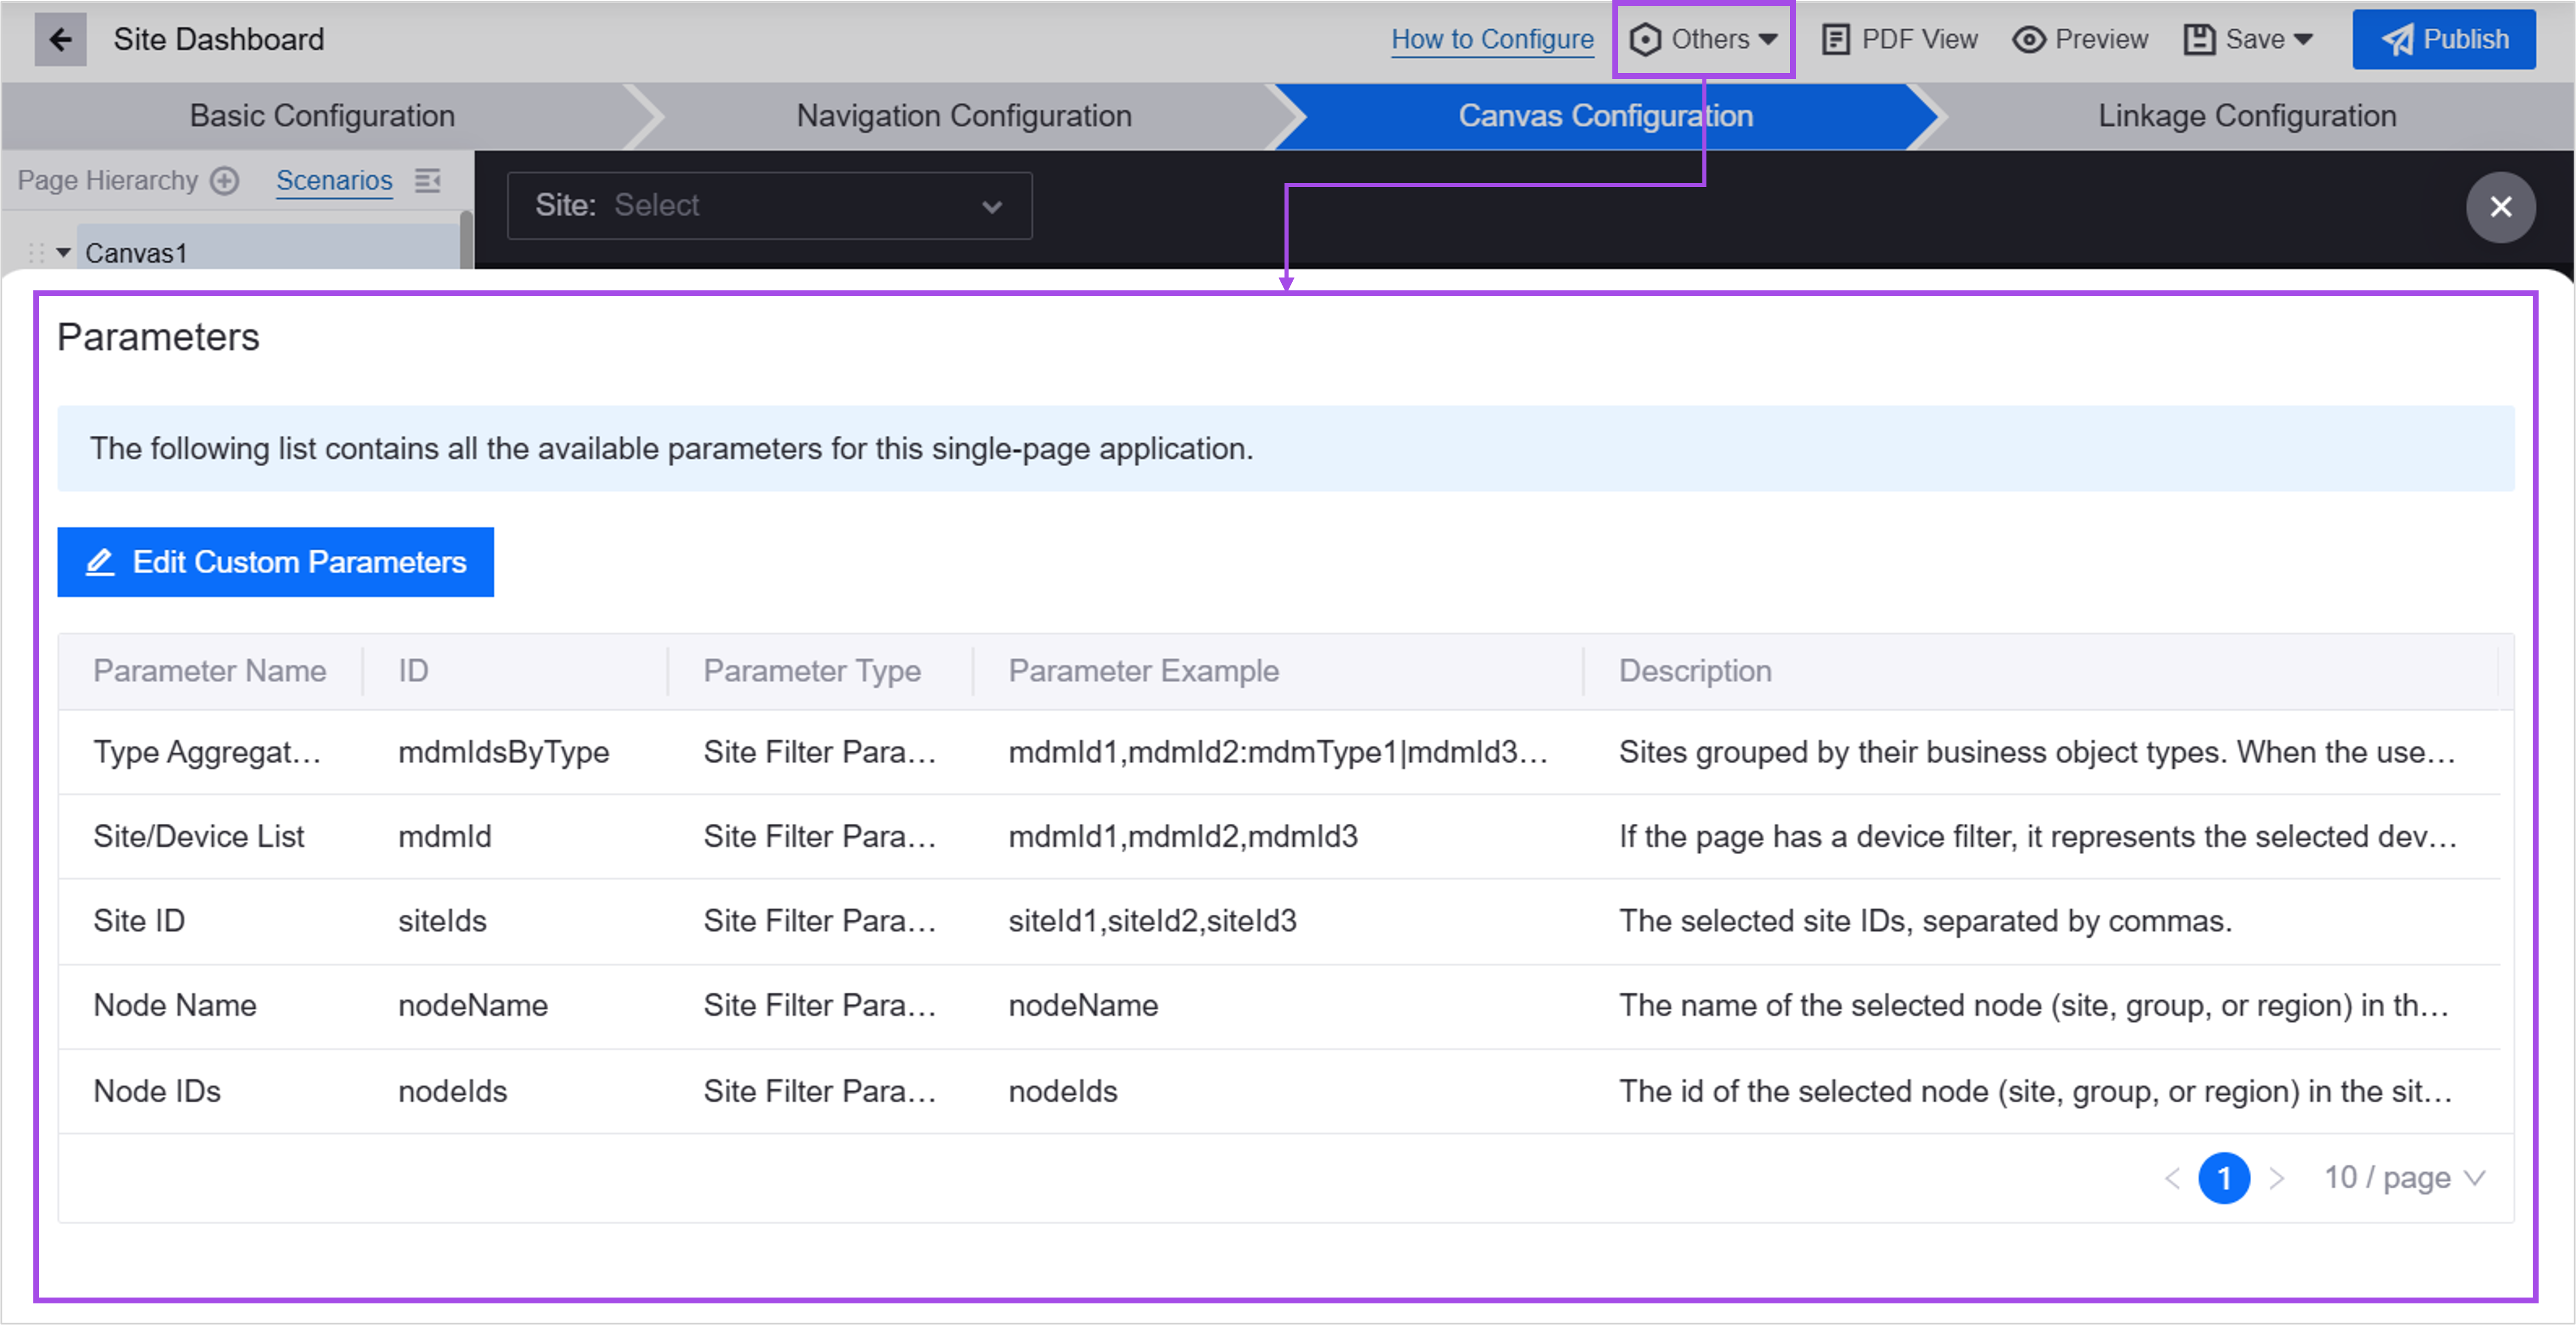
Manage custom parameters in the page, and use these parameters in container titles and widget titles to display dynamic content.
Manage the media library for the current page, including icons, images, and backgrounds, for unified maintenance.
Added the Single Page Application SDK for application developers to:
Retrieve data from a third-party page to control navigators when embedding a Single Page Application to the page.
Retrieve parameters from the previous page to retain user filter conditions when users navigate to a Single Page Application.
Pass navigator parameters to a custom page embedded in an Inline Frame widget for synchronized data filtering.
Added Preview Runtime URL for Dashboards and Single Page Applications. Application developers can preview real data in an application before publishing, minimizing end-user impact.
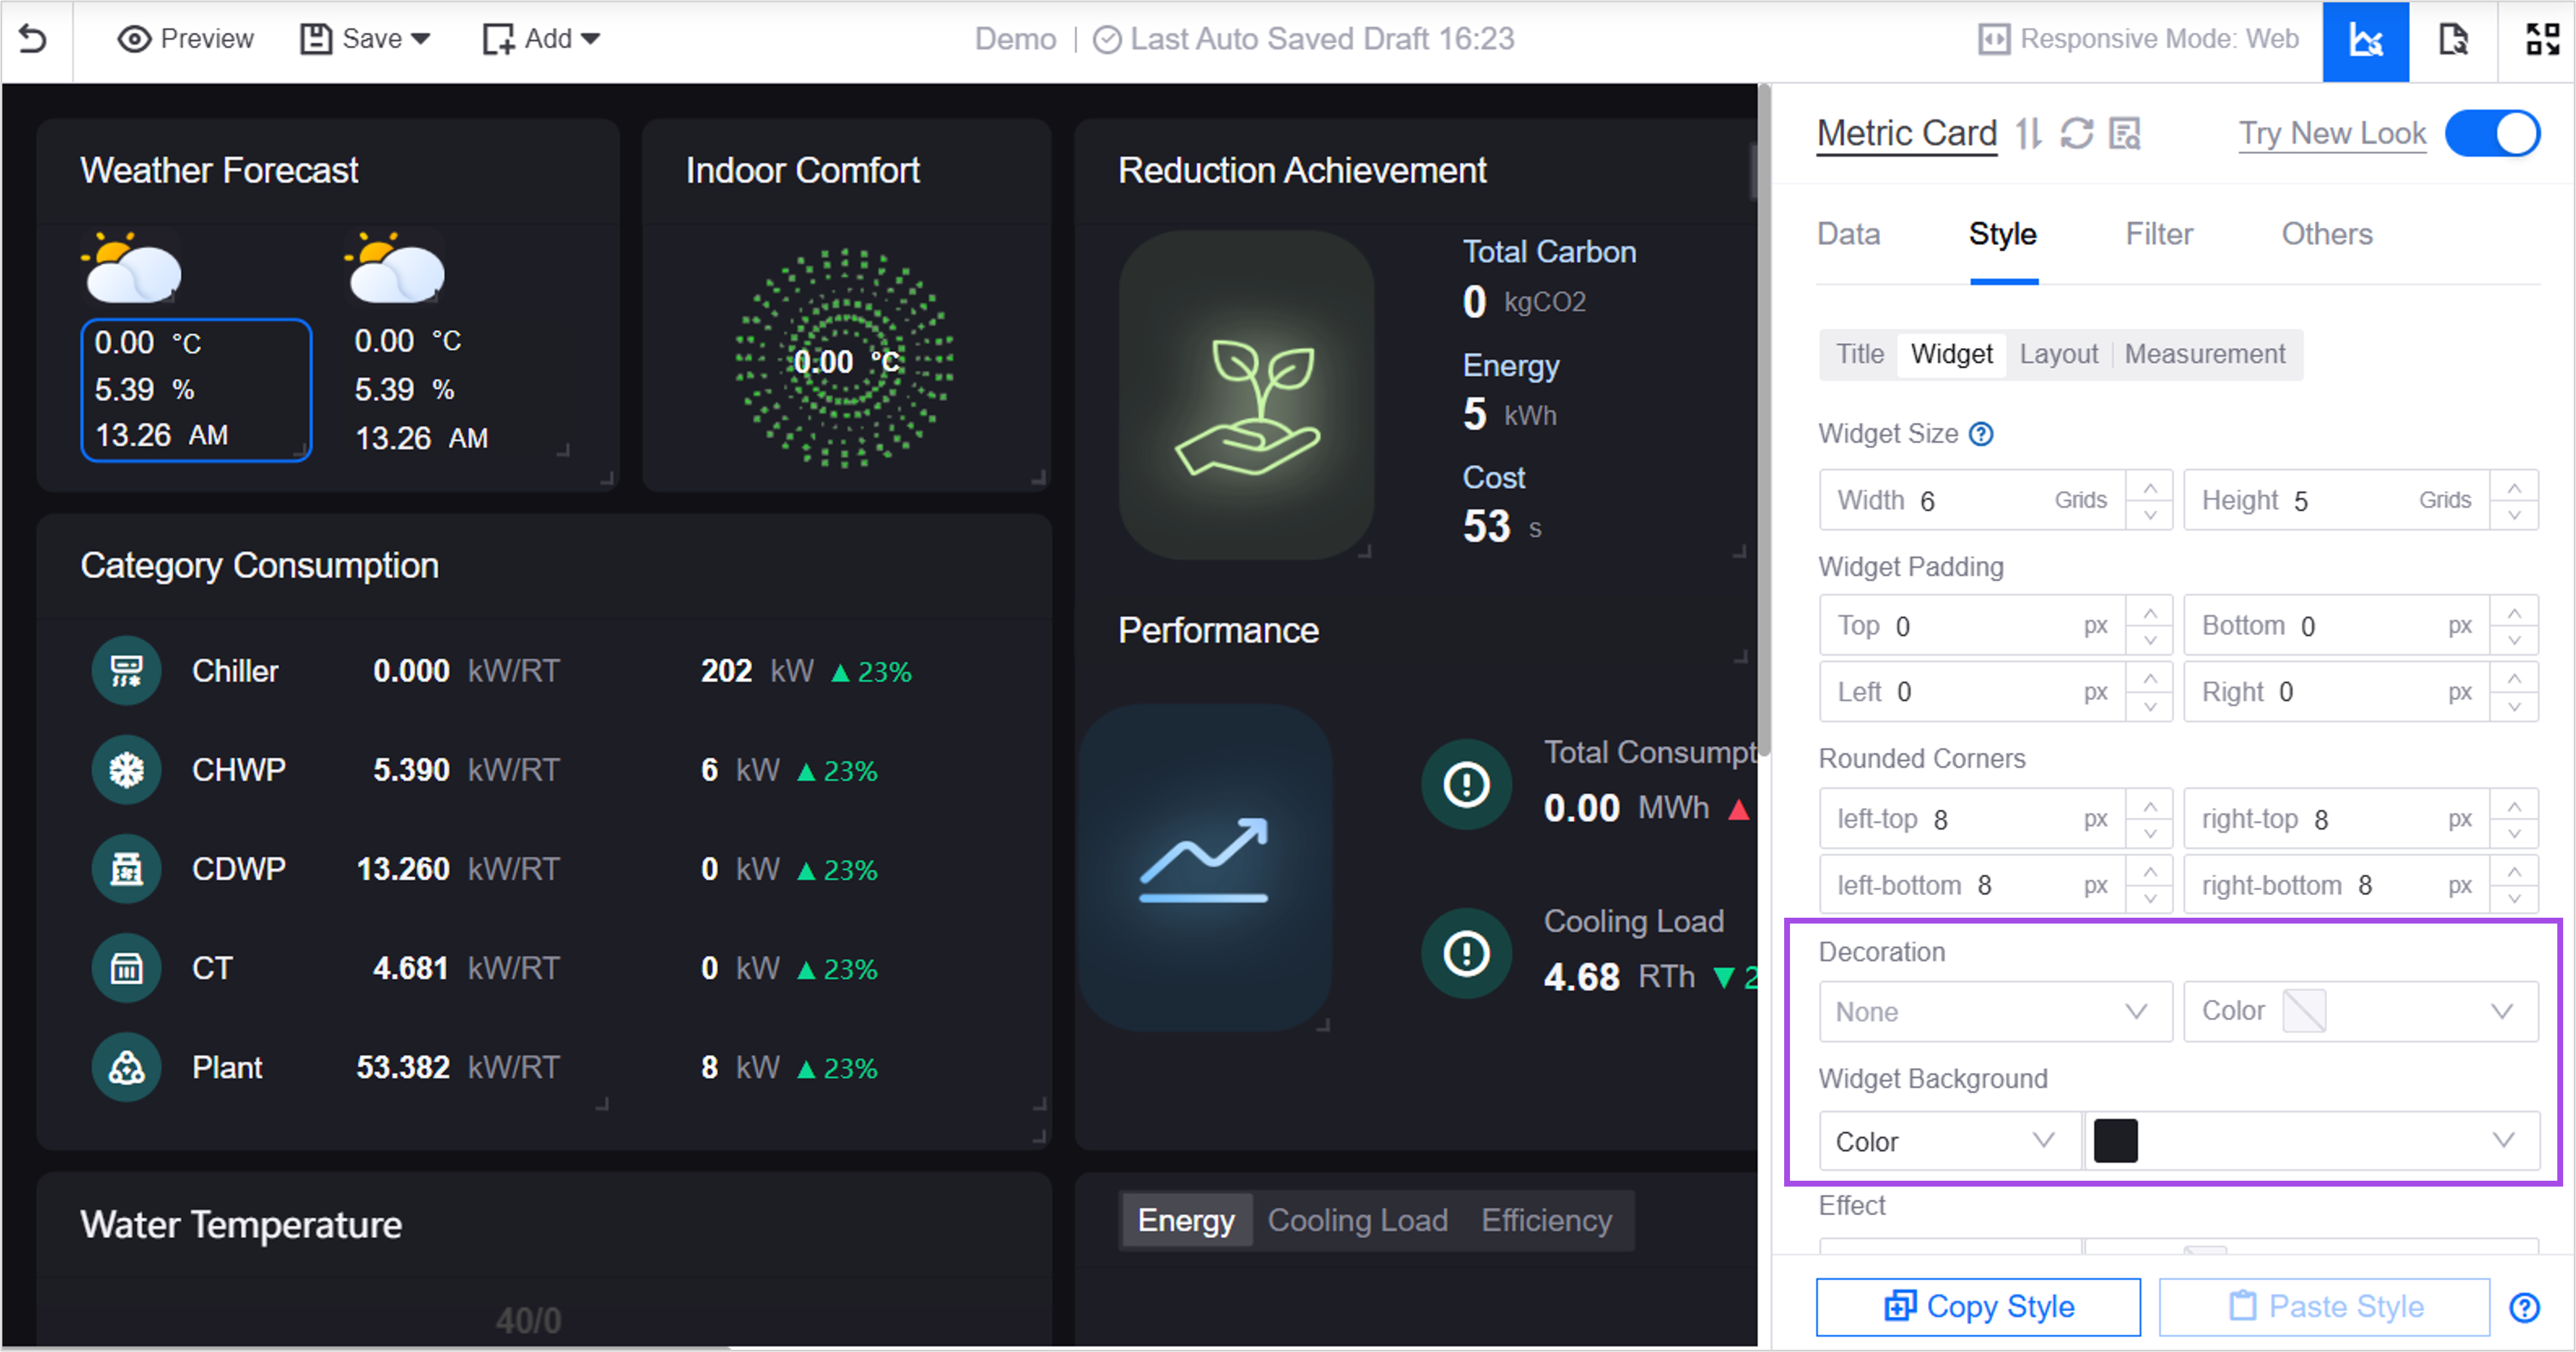
Application developers can customize page backgrounds, container and widget title bars, layouts, and decorations for Dashboards and Single Page Applications.
Supports the synchronization of the updates from widget templates to related widgets. Application developers can enable synchronization, applying template changes instantly for consistency and reduced manual effort.
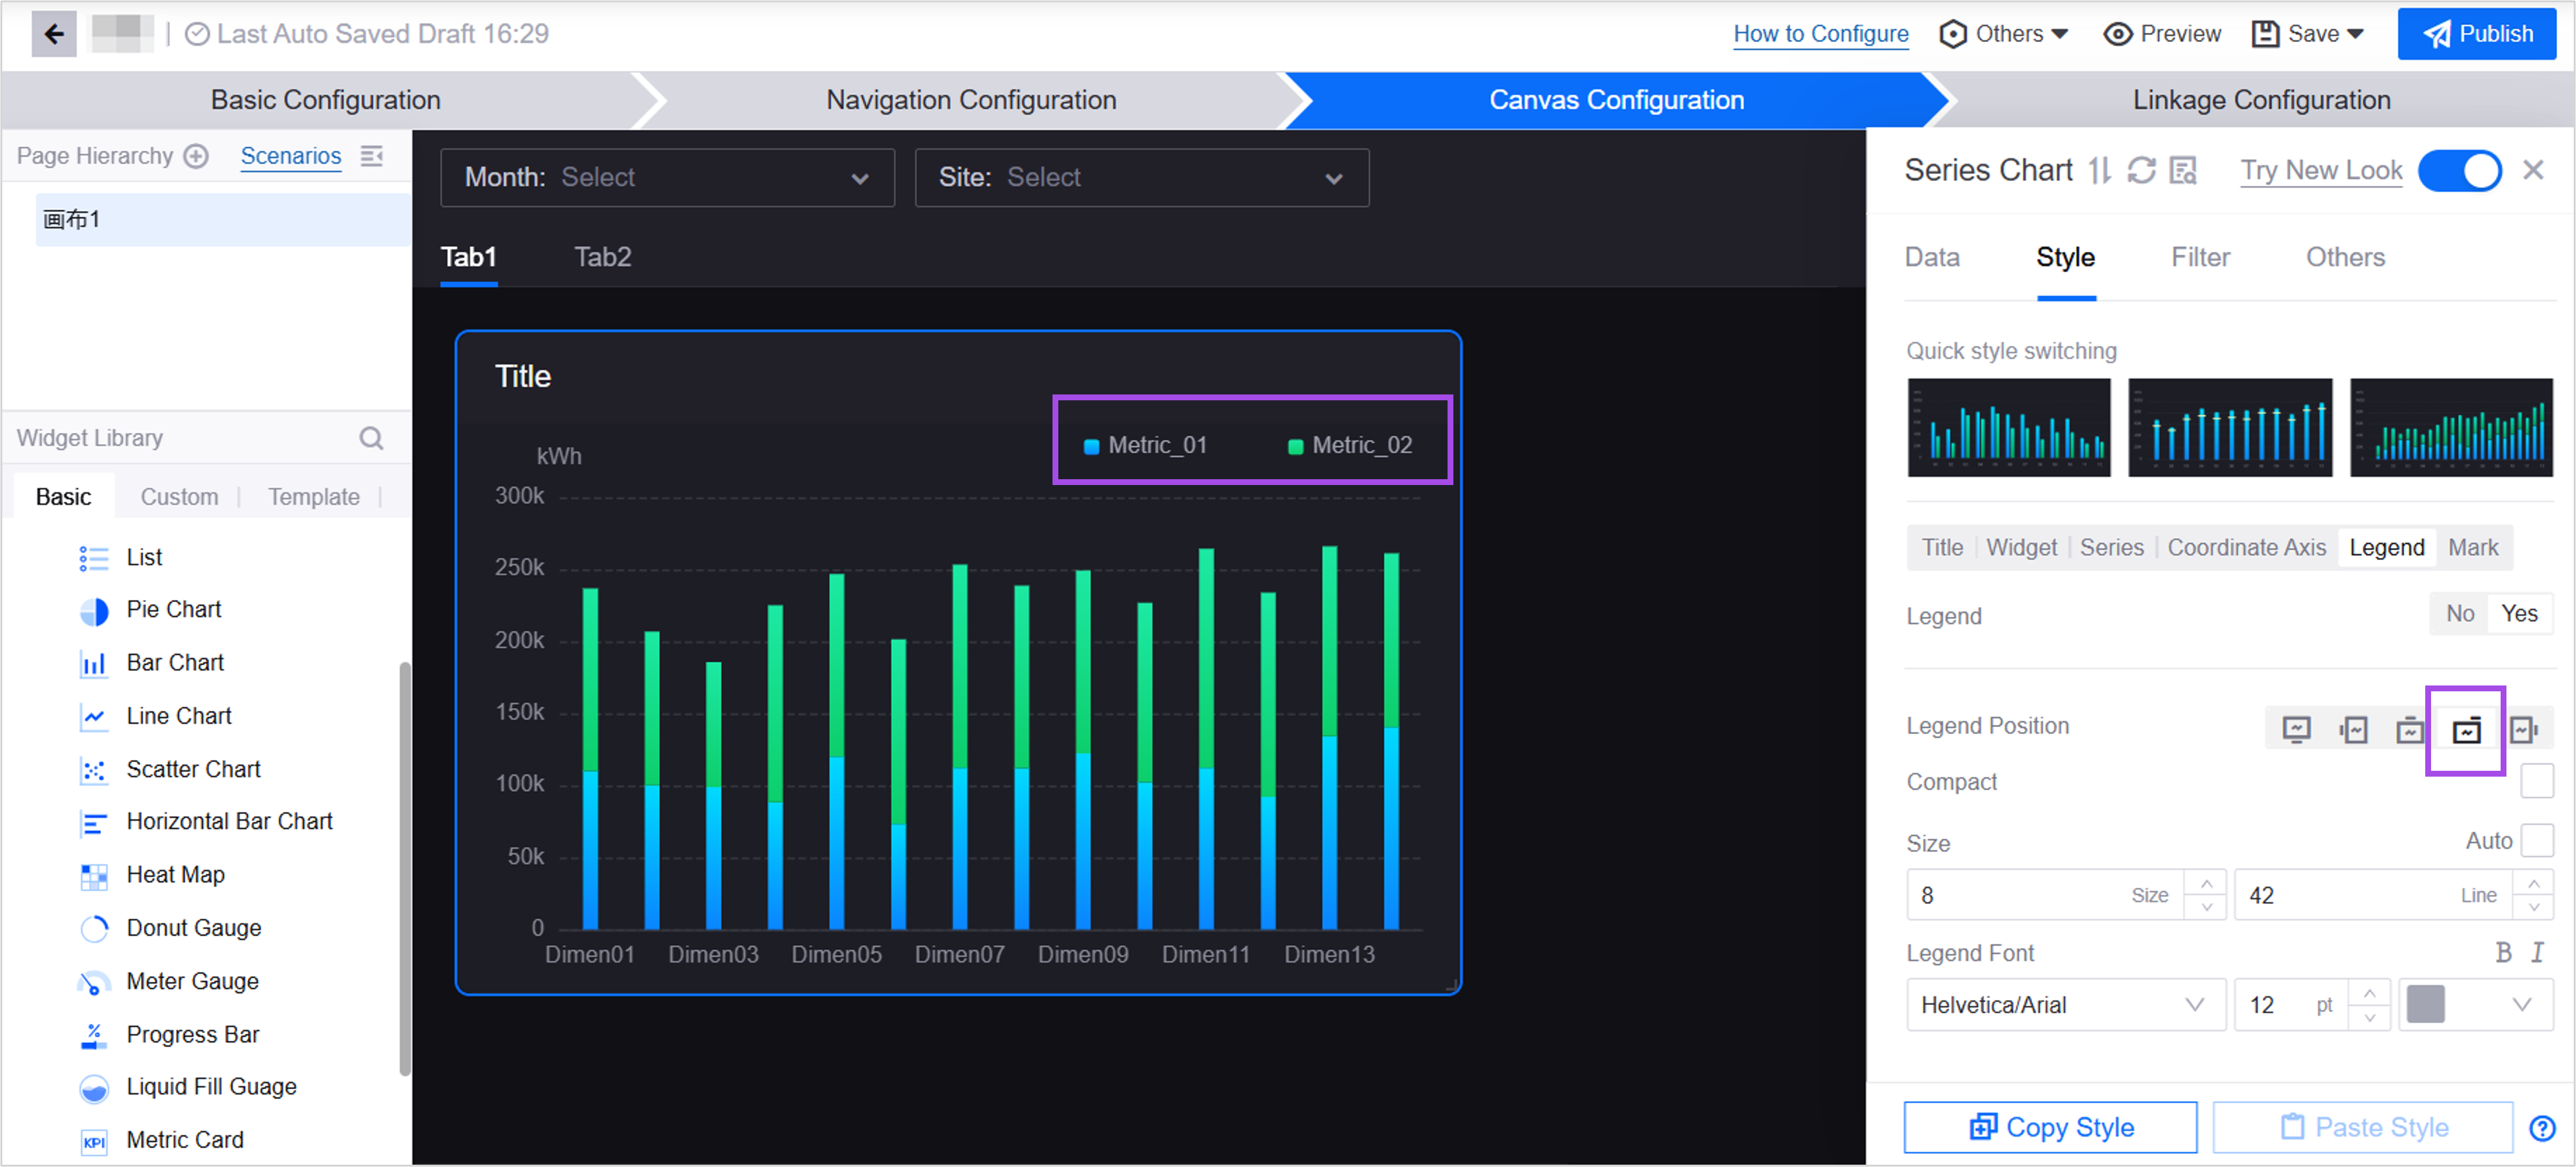
Added an upper-right legend position in widgets such as pie charts, time series charts, and bar charts.
Application developers can configure the display of metric units for the Metric Card widgets:
Specify a unit from the unit library or customize a unit, supporting internationalization.
Display inherent units with automatic scaling (e.g., ‘kg’ to ‘t’ for large values) to optimize readability.
Set the initial unit for scaling. For example, the initial unit is “kg”, so even “0.001kg” won’t display as “1g”.
In the Rich Text widget, application developers can insert data source fields and format their values for dynamic display.


Unified Monitoring
In the Portfolio configuration page, application developers can perform the following actions:
Configure device status and data in the device details pop-up for a single-site map.
Show or hide the Full Screen button in the map’s upper-right corner.
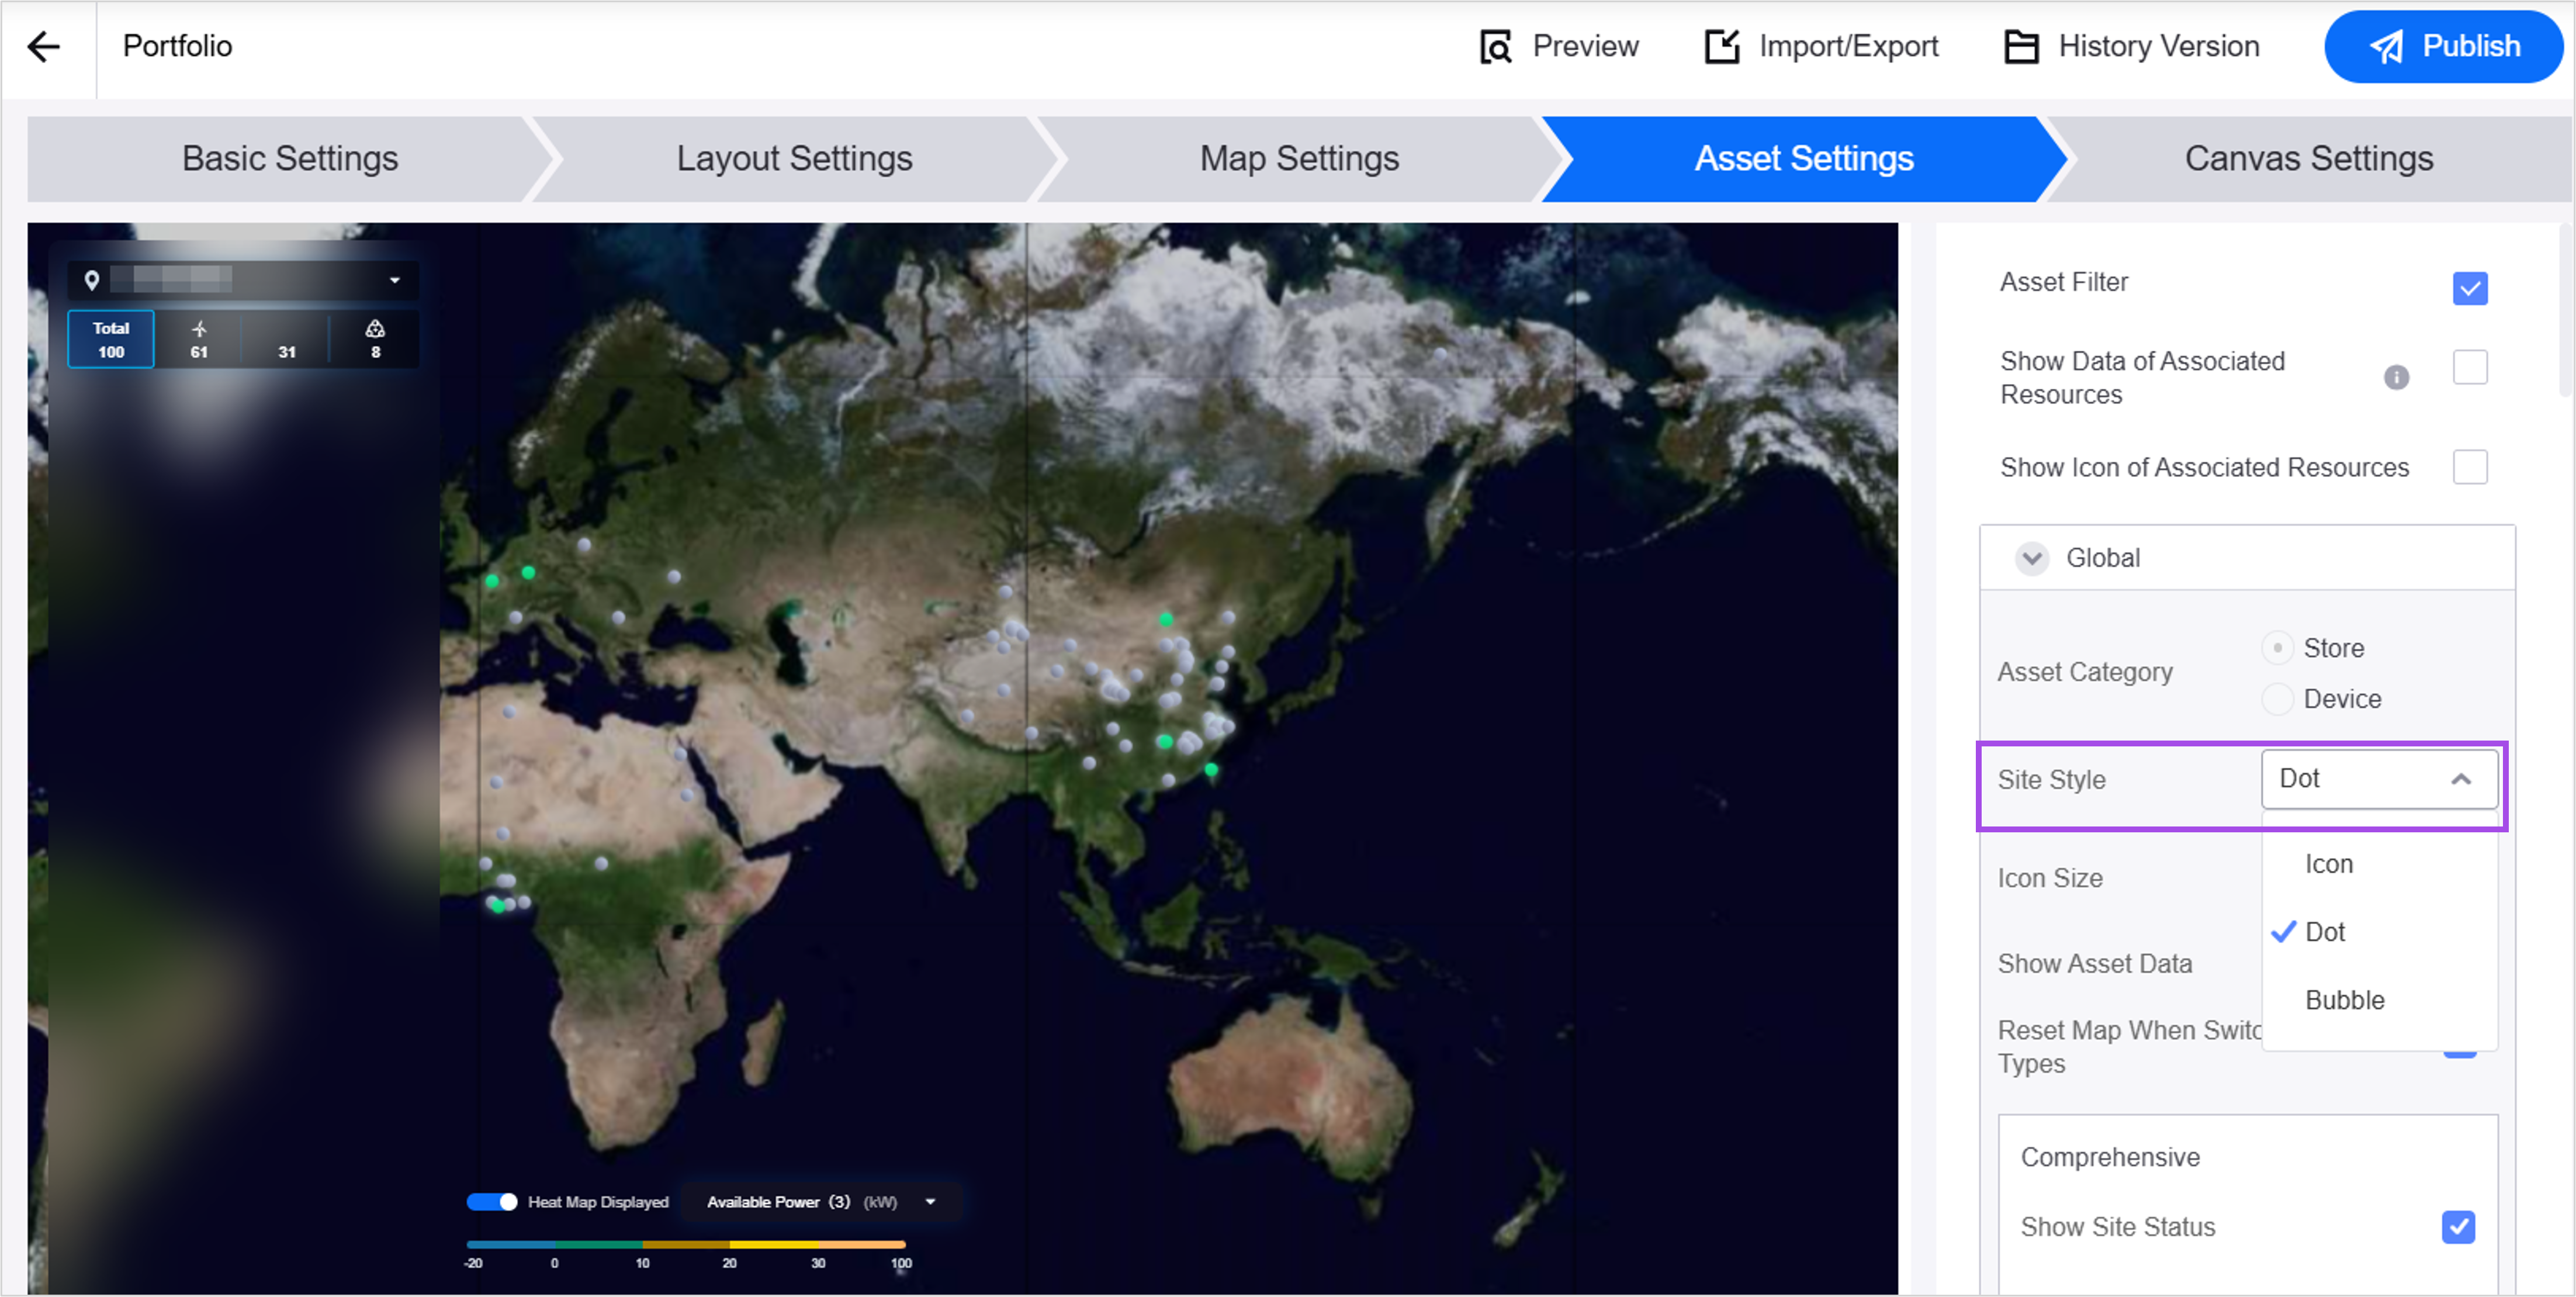
Display sites as dots on the map.
In the Charting Tool configuration page, application developers can predefine data groups and their display names based on visualization groups, allowing end users to batch-select data by group when choosing attributes and measurement points.
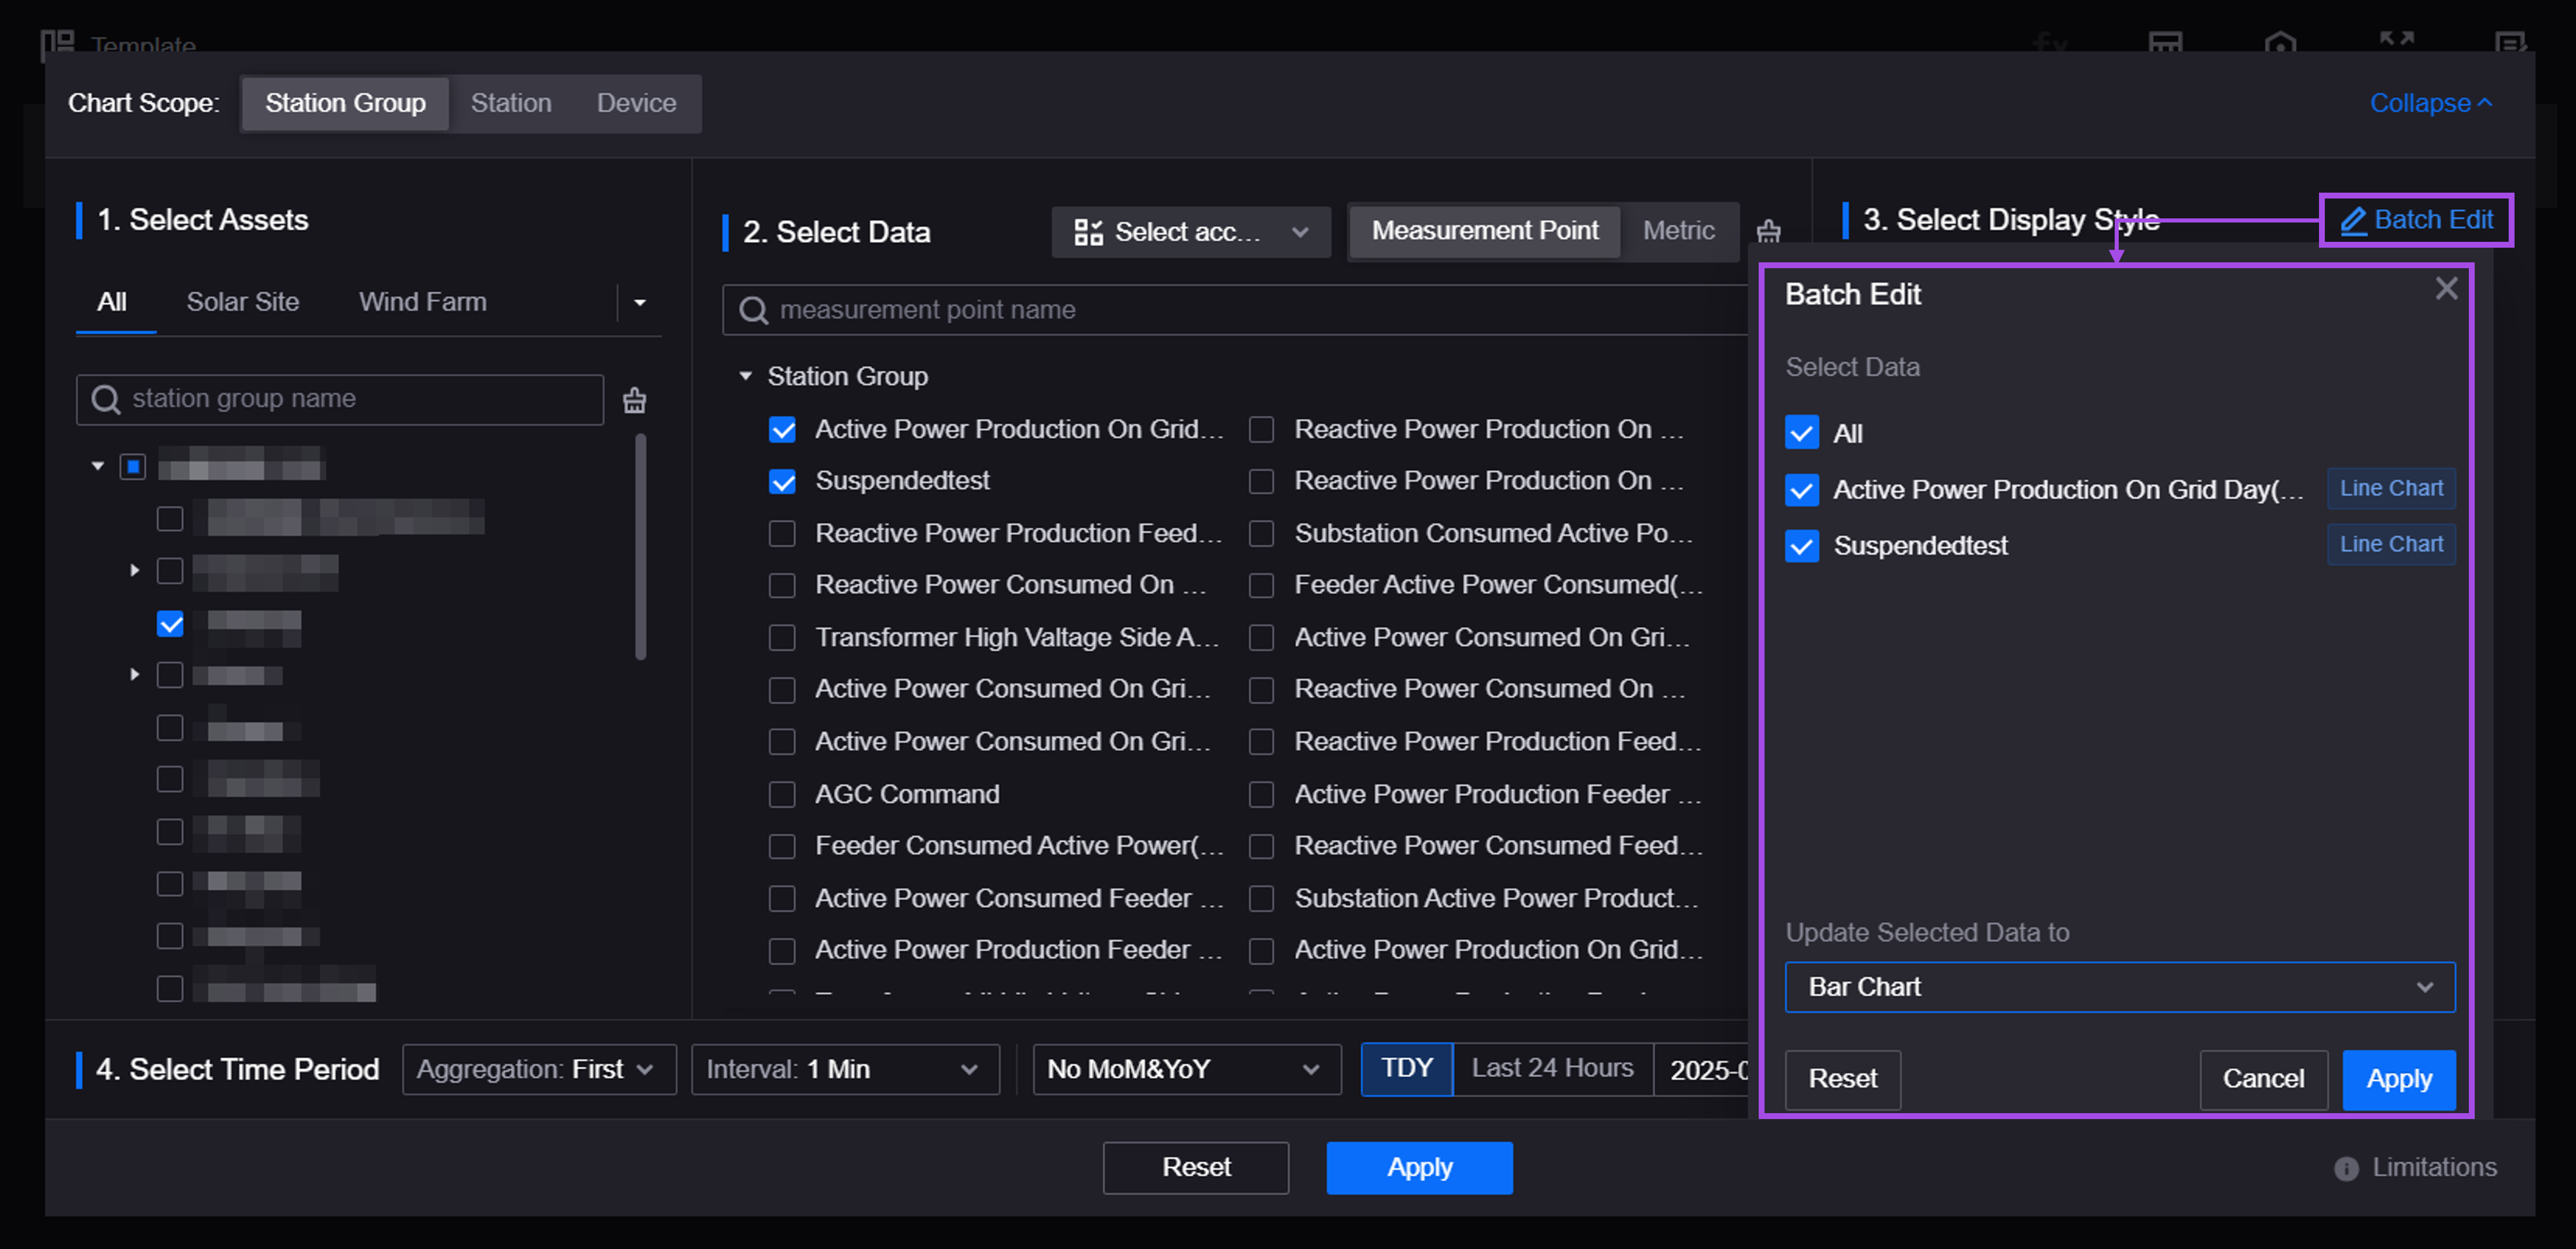
In the Charting Tool runtime page, end users can batch-set display styles of charts to reduce repetitive operations, and download charts as images for offline viewing.
In the Asset List configuration page, application developers can perform the following actions:
Set multiple default device types using the URL parameter
defaultDeviceTypefor multi-select device lists.Configure metric card filter selection (single-select or multi-select) and multi-select logic (union or intersection).
Added a Data Validity option in the Asset List runtime page. End users can set a validity duration (e.g., 10 minutes) for real-time data. If data hasn’t updated within this time, a prompt appears: “This data has not been refreshed for over 10 minutes.”
In the Common KPI Inquiry runtime page, end users can adjust data groups and reorder items in the data filter by drag-and-drop.
In Landing Page, application developers can configure the device type filter for single or multi-selection.

In the runtime pages of Charting Tool, Asset List, and Common KPI Inquiry, end users can switch all organization structures accessible by both the current application and the current account.
OU administrators can query export records of end users from the Common KPI Inquiry page in EnOS Management Console.


Work Management
Application developers can contact the system administrator to enable a device model No. filter for the Work Orders page for the current OU, allowing end users to view work orders by specific model No.
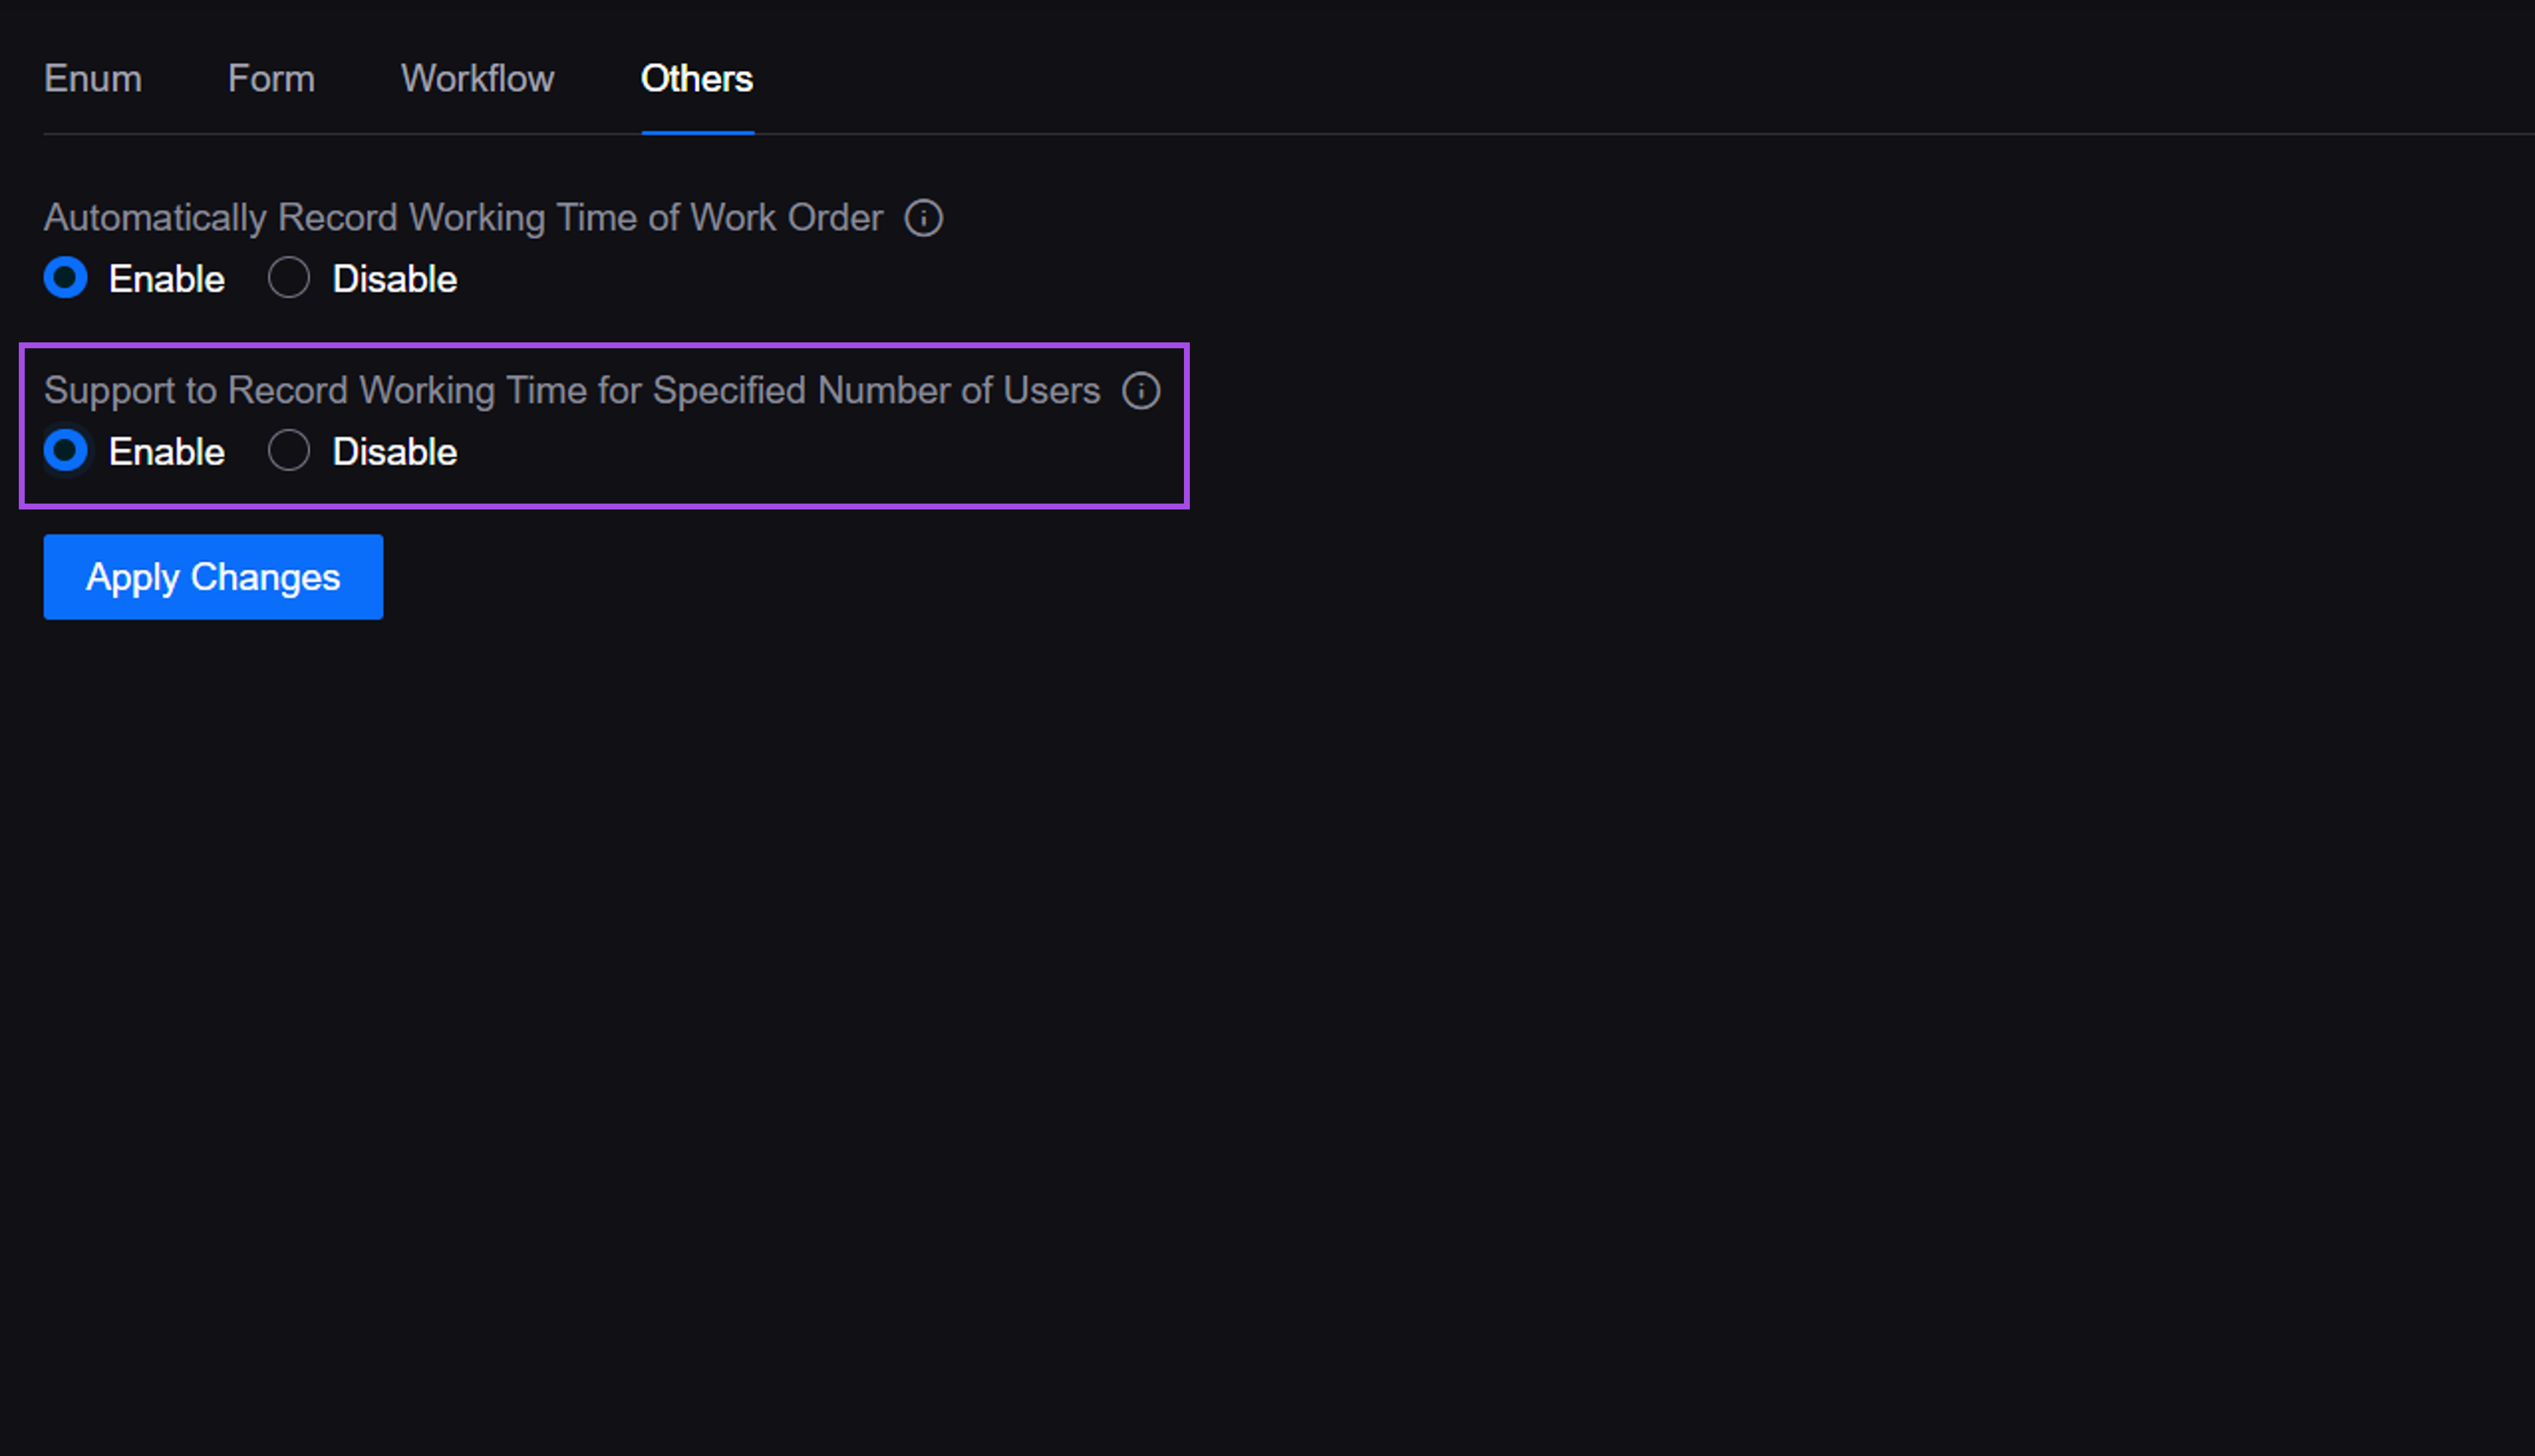
Application developers can enable work hour logging for a set number of users. If enabled, a work log can be created for the specified number of users over a specified time period to calculate individual work hours.
OU administrators can query records of end users performing imports, exports, or attachment uploads/downloads for work orders, service requests, and recurring tasks in EnOS Management Console.

Fleet Control
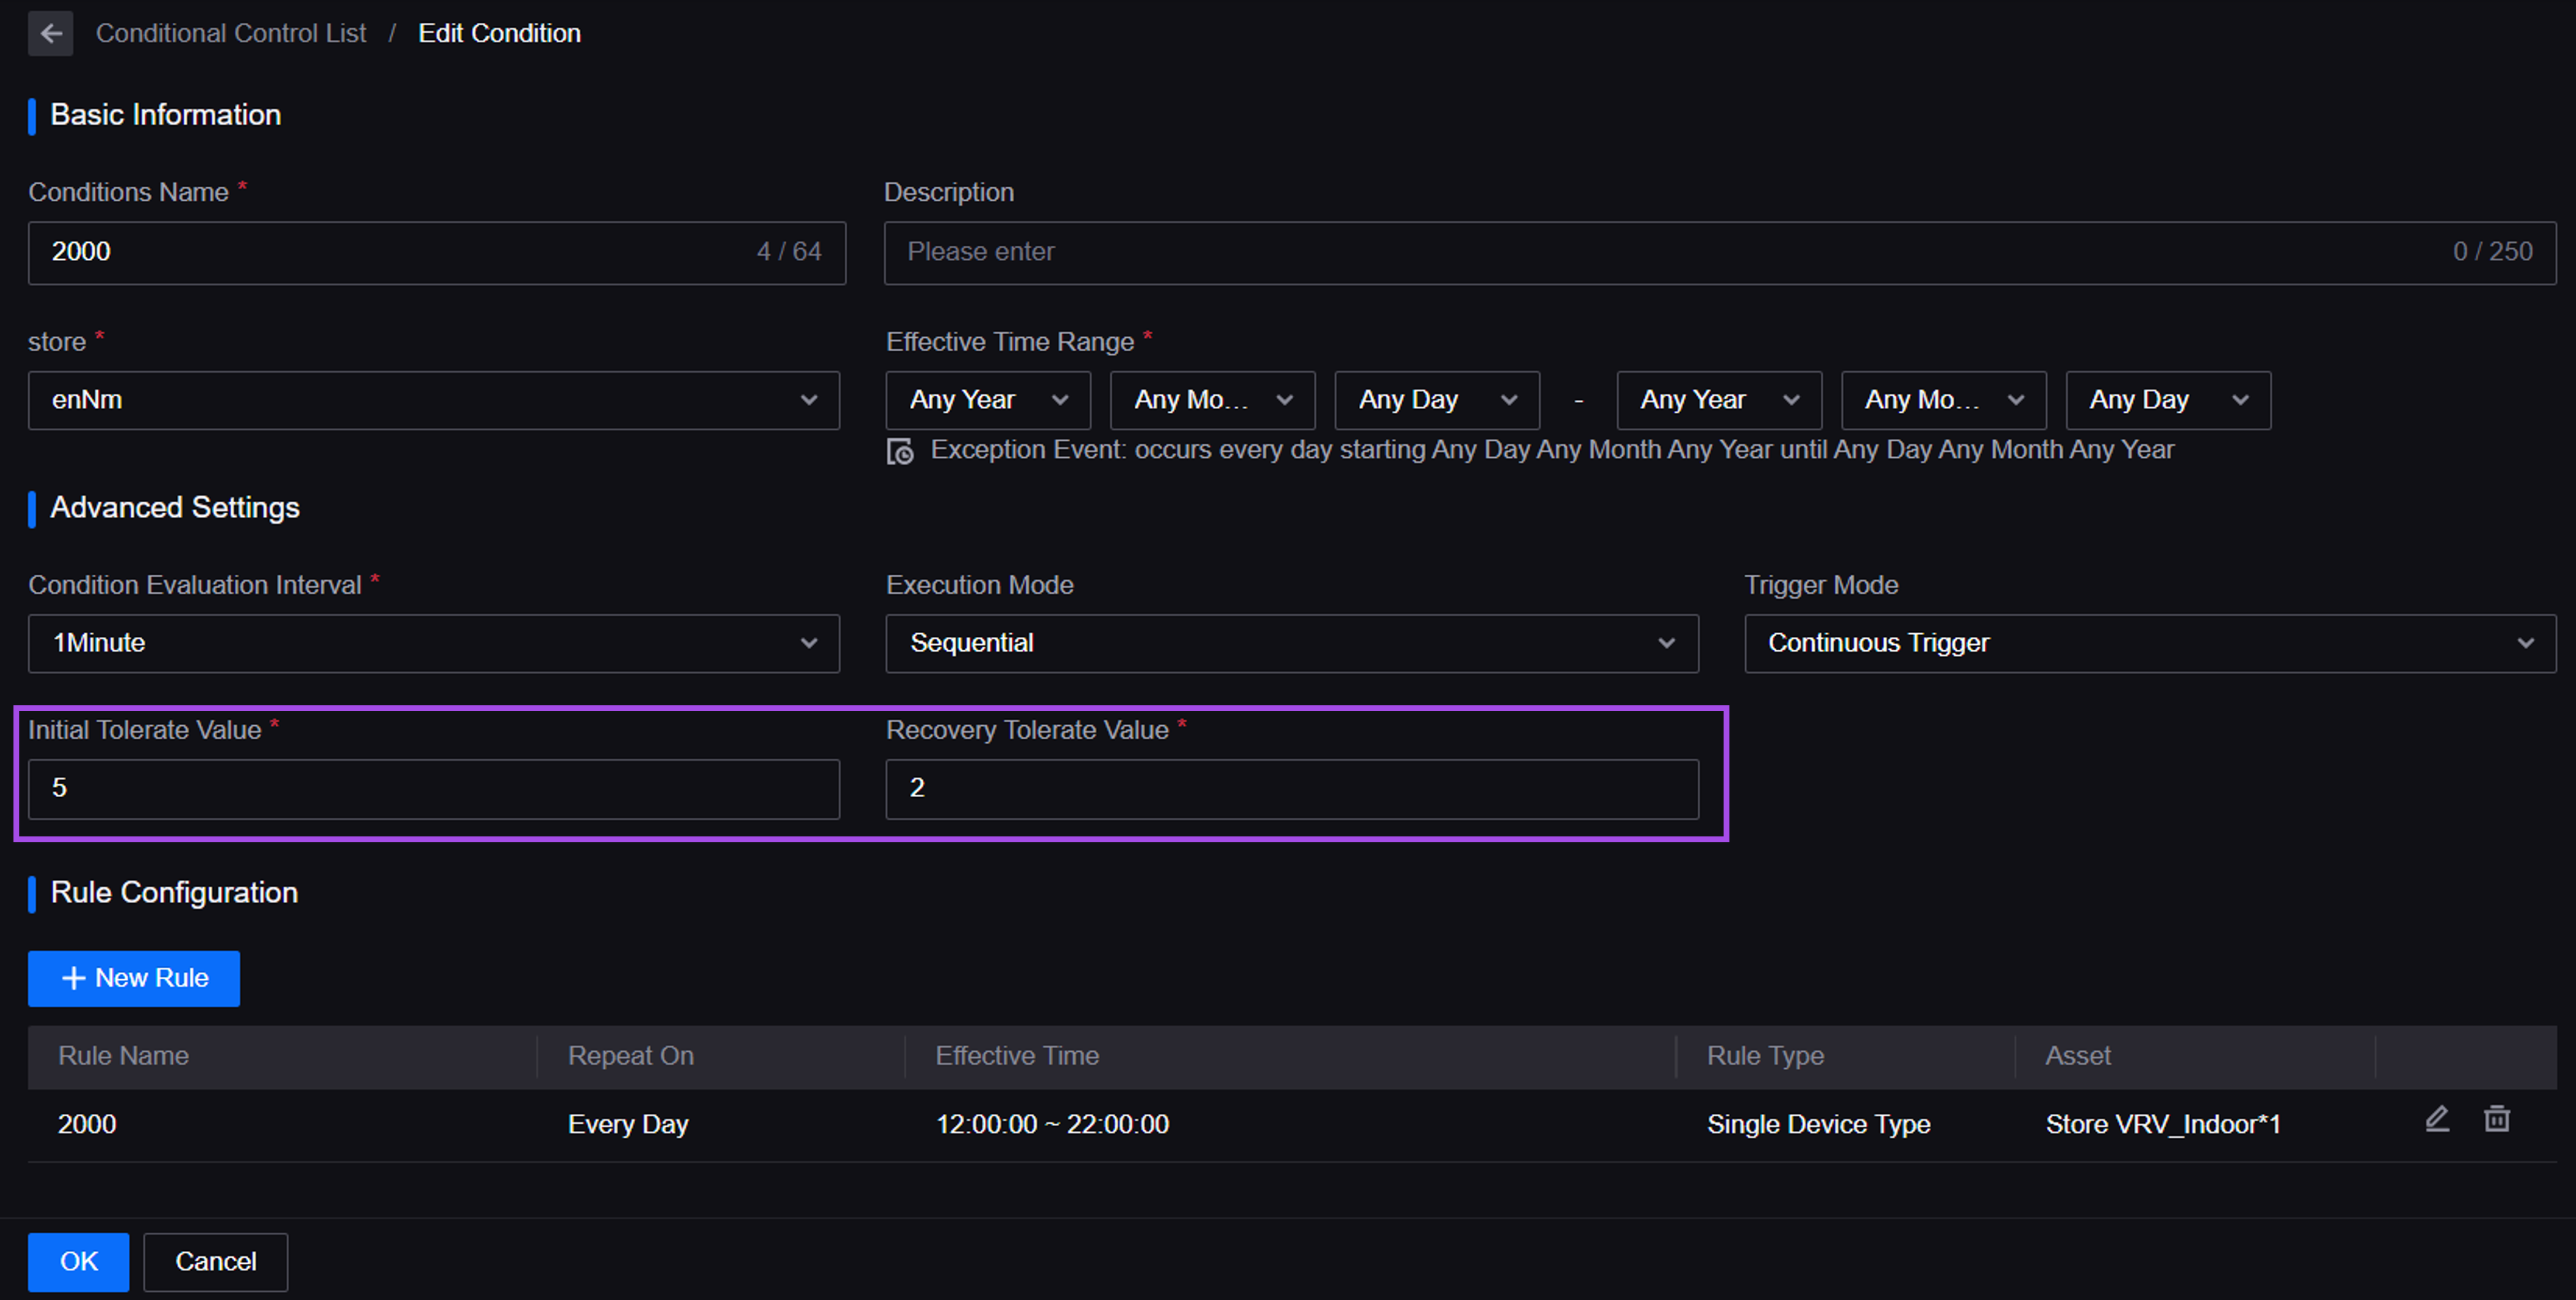
Application developers can configure tolerance values for control conditions, including the Initial Tolerance Value at the start of each day and the Recovery Tolerance Value for each controlled device. Each time a device meets the control condition, the tolerance value decreases by 1 from the initial tolerance value. If it falls below 0, a control command is issued, and the tolerance value resets to the recovery value.
Added the Continuous Trigger mode for conditional control. If a device continues to meet the condition after an initial trigger, commands will repeat.
Added hourly control for conditional control. When a device meets the condition, commands trigger collectively at the next full hour.
Supports Logger HA system integration for high-availability logging and analysis.

Device Connectivity and Management
Alarm Management
In Alarm Rules, device managers can use measurement point IDs, attribute IDs, and event IDs as parameters in alarm content, dynamically displaying their values for end users based on the alarm data.
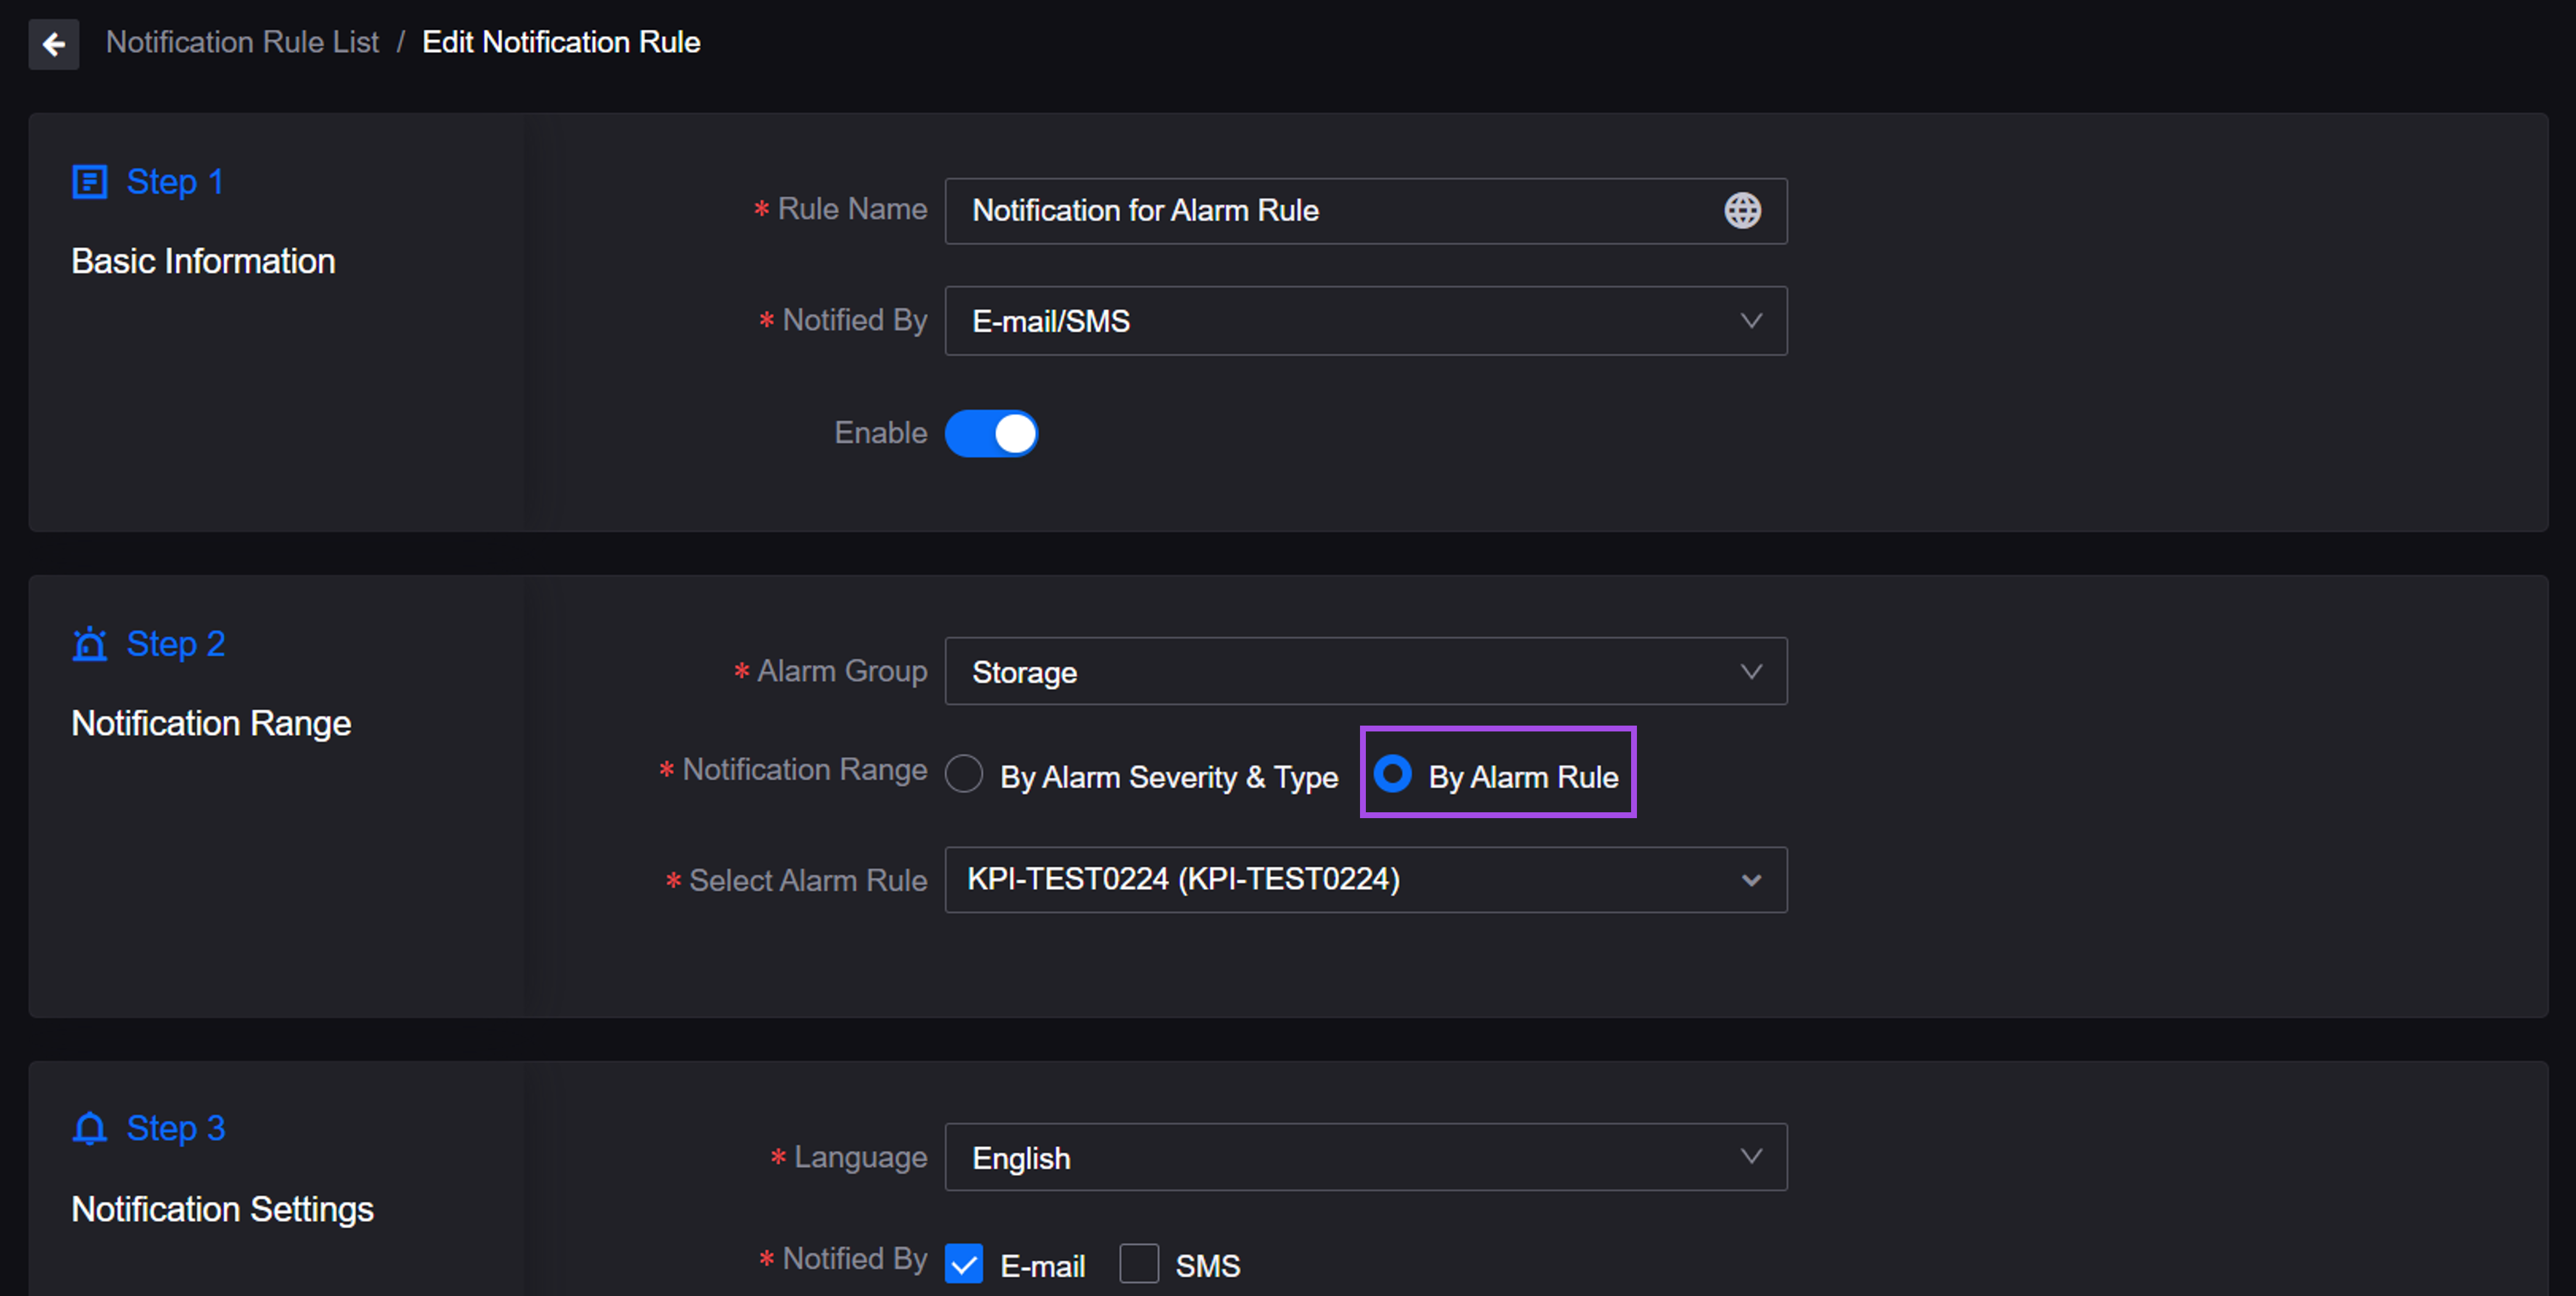
Device managers can configure alarm notifications for alarm rules, notifying end users only when an asset triggers an alarm based on that rule.

Alert Engine
In Alert Rules, application developers can reference measurement point IDs and attribute IDs as parameters in alert content, dynamically showing their values to end users based on alert data.
Application developers can use the
BIT_EXTRACTfunction in the alert trigger and recovery conditions of Alert Rules to extract the binary values from a combined decimal value reported by a device, and trigger or recover alerts based on the original values.Application developers can contact the system administrator to enable the scheduled monitoring of the alert recovery conditions for measurement points and set the monitoring frequency. If an alert record remains active for over 1 hour and the latest value reported by the measurement point meets the recovery condition, the alert record will automatically recover, avoiding stale alerts.