Getting Started: Aggregating Numeric Type Data
This guide intends to help you learn how to process numeric type stream data with the Time Window Aggregation template.
Prerequisites
- Authorization to the Stream Data Processing module
- Device connection is configured with data uploading to the cloud
Procedure
The procedure of processing data with the Time Window Aggregation template is as follows:
- Design and create a stream processing job
- Save and publish the stream processing job
- Preview the job with real-time data
- Start the stream processing job
- Monitor the running status and results of the job
Goal and Data Preparation
Goal
The goal of this guide is to get the maximum value of the test_raw input point within every 5 minutes and output the calculated value to the output point test_5min.
Data Preparation
- Model configuration: Detailed information about the test_Model used for this guide is as follows:
| Feature Type | Name | Identifier | Point Type | Data Type |
| Measuring Point | test_raw | test_raw | AI | DOUBLE |
| Measuring Point | test_5min | test_5min | AI | DOUBLE |
Note
- In this example, test_raw is the input point, and test_5min is the output point.
- Ensure that both the input point and the output point are of the same type.
- Storage configuration: Configuring the input point test_raw as AI raw data and the output point test_5min as minute-level normalized AI data. For more information, see Configuring TSDB Storage .
- Data ingestion: For information about data ingestion of input point test_raw, see Device Connection .
Step 1. Develop a Data Processing Job
- Log in EnOS Console and click Stream Data Processing > Stream Development to view all the streams created within the organization. You can double-click a job to view and edit its configuration.
- Click the + icon above the job list to create a stream processing job. Enter the name and description of the job and select Time Window Aggregation as the template. Optionally, you can choose to import the configuration file of an existing job to complete the configuration quickly.
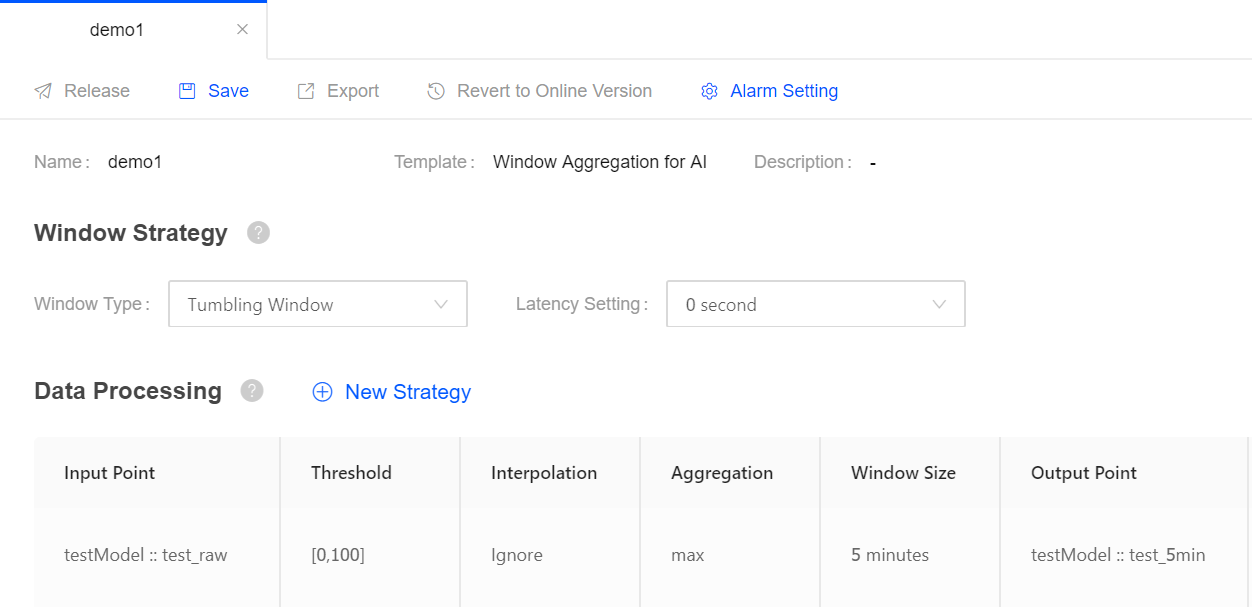
- Configure the window strategy of the stream processing job:
- Window Type: Select Tumbling Window type, which has a fixed size and does not overlap.
- Latency Setting: Select an allowed lateness for data arriving late. 0 second indicates that data arriving late will be ignored.
- Configure the data processing policy. Click New Strategy to add a data processing policy. Description of each field is as follows:
- Input Point: Select the measuring point of input data. In this example, select the test_raw point of the testModel.
- Threshold: Specify the threshold for filtering raw data before processing.
- Interpolation: Select the interpolation algorithm that is used to process the input data that exceed the threshold. Currently, interpolation strategy supports Ignore only.
- Aggregation: Select the function to compute valid data in the window. EnOS Streaming System currently supports functions like max, min, avg, sum, and cnt.
- Window Size: Select the size of each time window, that is the amount of data to be computed in a single window.
- Output Point: Select the point to receive the processed result. In this example, select the test_5min point.
Step 2. Save and Publish the Job
When the stream processing configuration is completed, you can save and publish the data aggregation job online.
See the following sample configuration:
Step 3. Start the Job
On the Stream Operation page, find the published stream processing job in the table, and click the Start icon  for the job in the Operations column to start it.
Step 4. View the Running Results of the Job
On the Stream Operation page, find the running stream processing job in the table, and click the job name to open the Stream Details page. You can view the following information about the job:
- Summary: View the summary of the running job, such as the overall data processing records and the data aggregation records in a specific period.
- Log: Click the View Logs icon on the upper right corner to check the running log of the job.
- Results: The processed data will be stored in TSDB according to the configured storage policy. Call the corresponding API to get the stored data. For more information about data service API, go to EnOS Console > EnOS API.