Drawing Elements
This section introduces how to graphically represent business objects in the element drawing canvas. Depending on the actual business situation, you can start from zero or draw elements based on existing element templates for business object visualization development.
Adding Element Templates
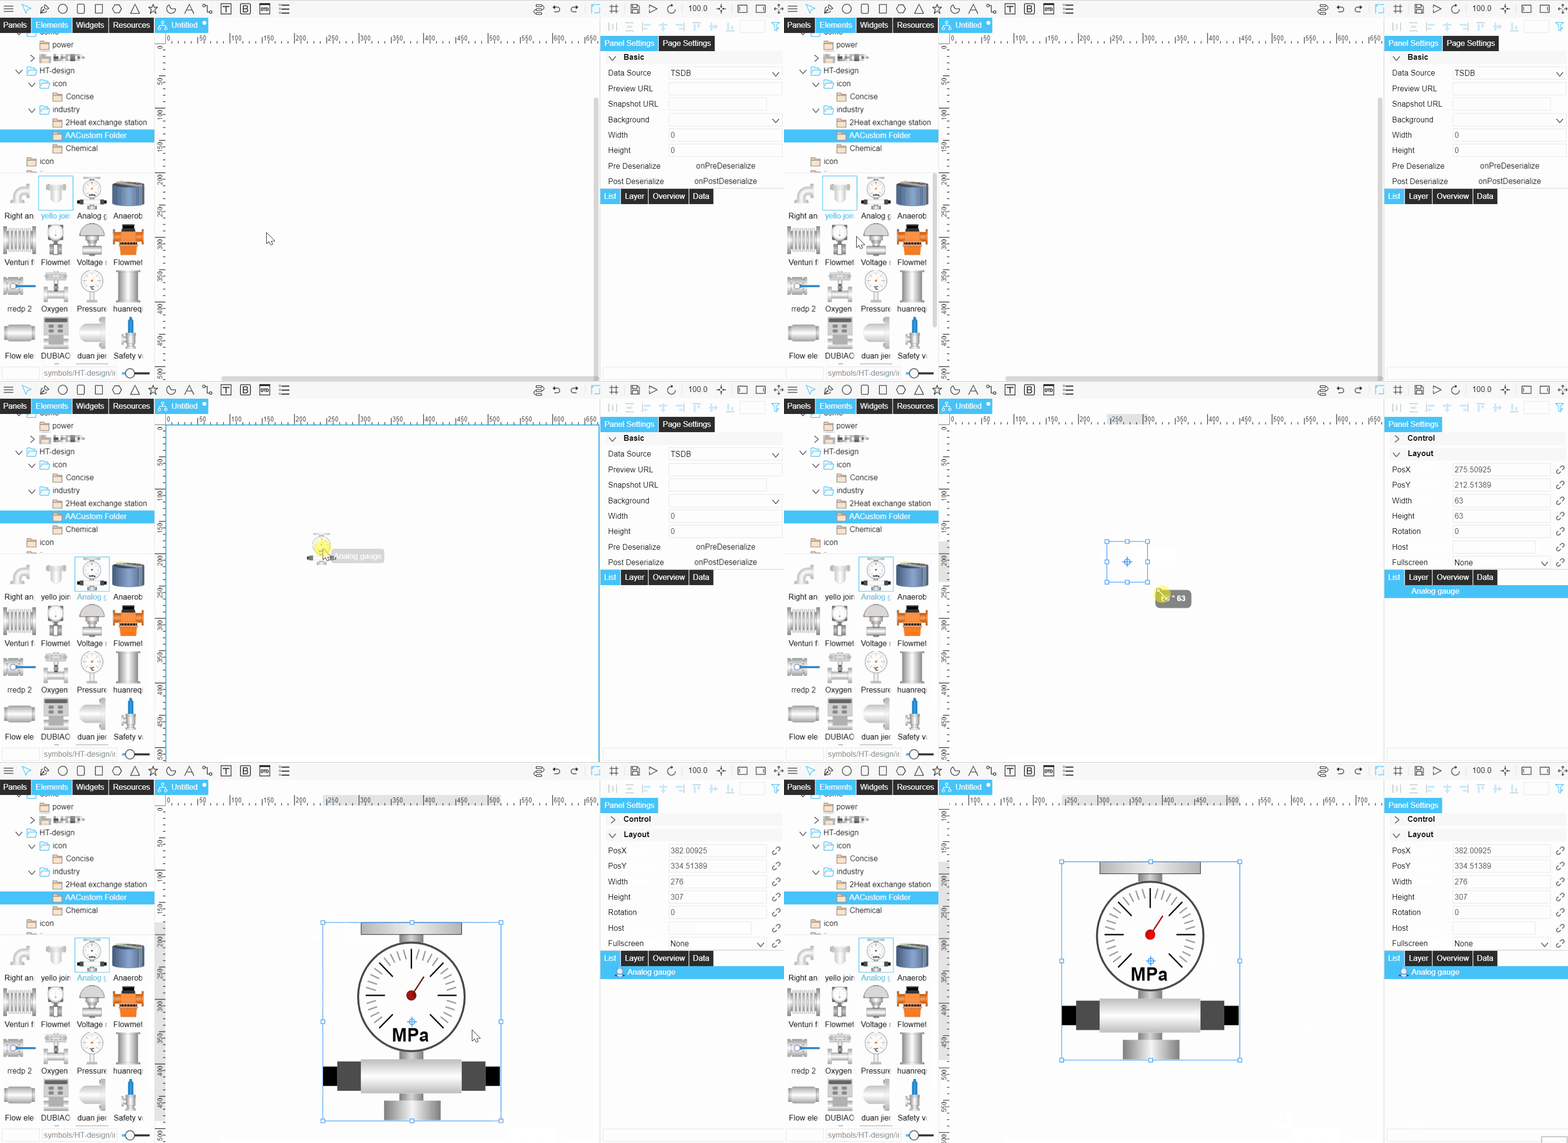
Select the element template in the left Preview Area and drag and drop to add the element directly to the canvas.
Drawing Elements from Zero
The DTM visualization tool provides a variety of graphical tools as follows.

The table below explains the functions of each button.
Button |
Description |
|---|---|
|
Edit mode. |
|
Draw irregular shapes. |
|
Draw ellipses, rounded rectangles, rectangular bodies, orthogonal polygons, triangular bodies, star bodies, and circular arcs. |
|
Add text. |
|
Draw the border. |
|
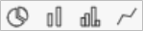
Draw pie charts, single-dimensional bar charts, bar charts, and line charts. Available only when drawing elements. |




In addition to the above graphics elements, other graphics files can be added from Resources. For more information, see Managing Resources.
Drawing Shapes
Select Shape
 , and select the left mouse button in the drawing to draw the figure. Each selection will generate a control point and a straight-line connection to the previous control point.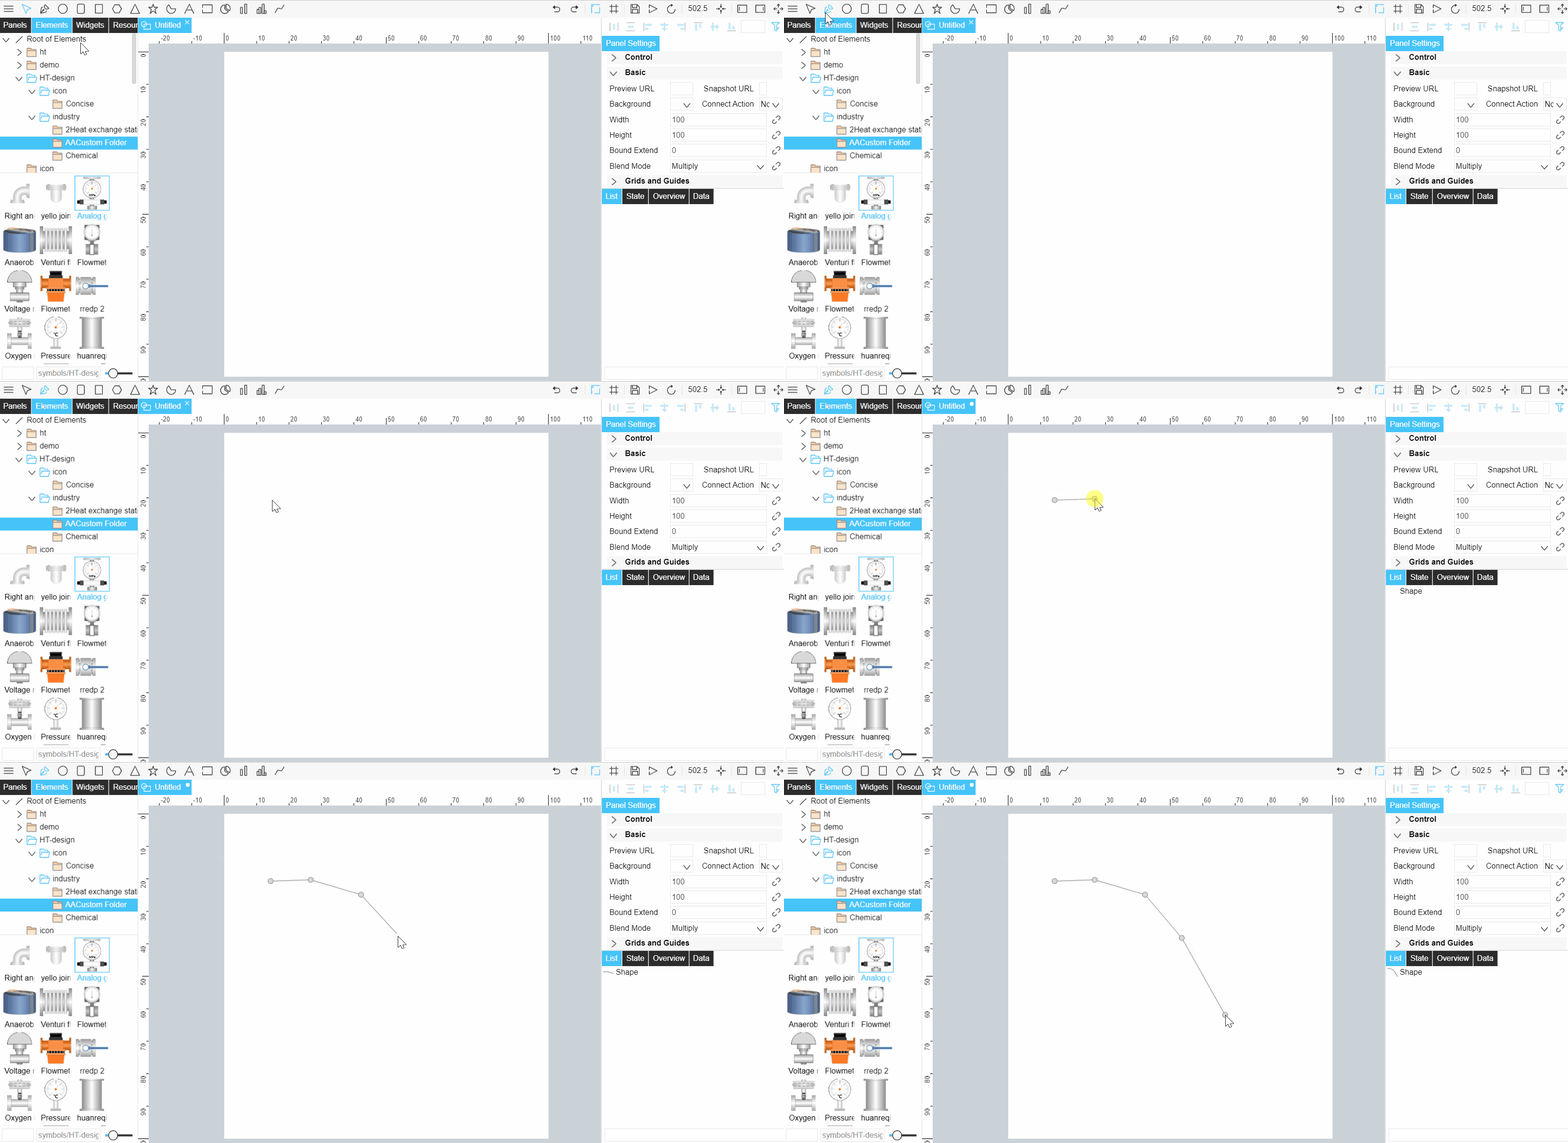
Double-click the left mouse button to end the drawing and enter the graph editing state. The position and size of the graph can be edited.
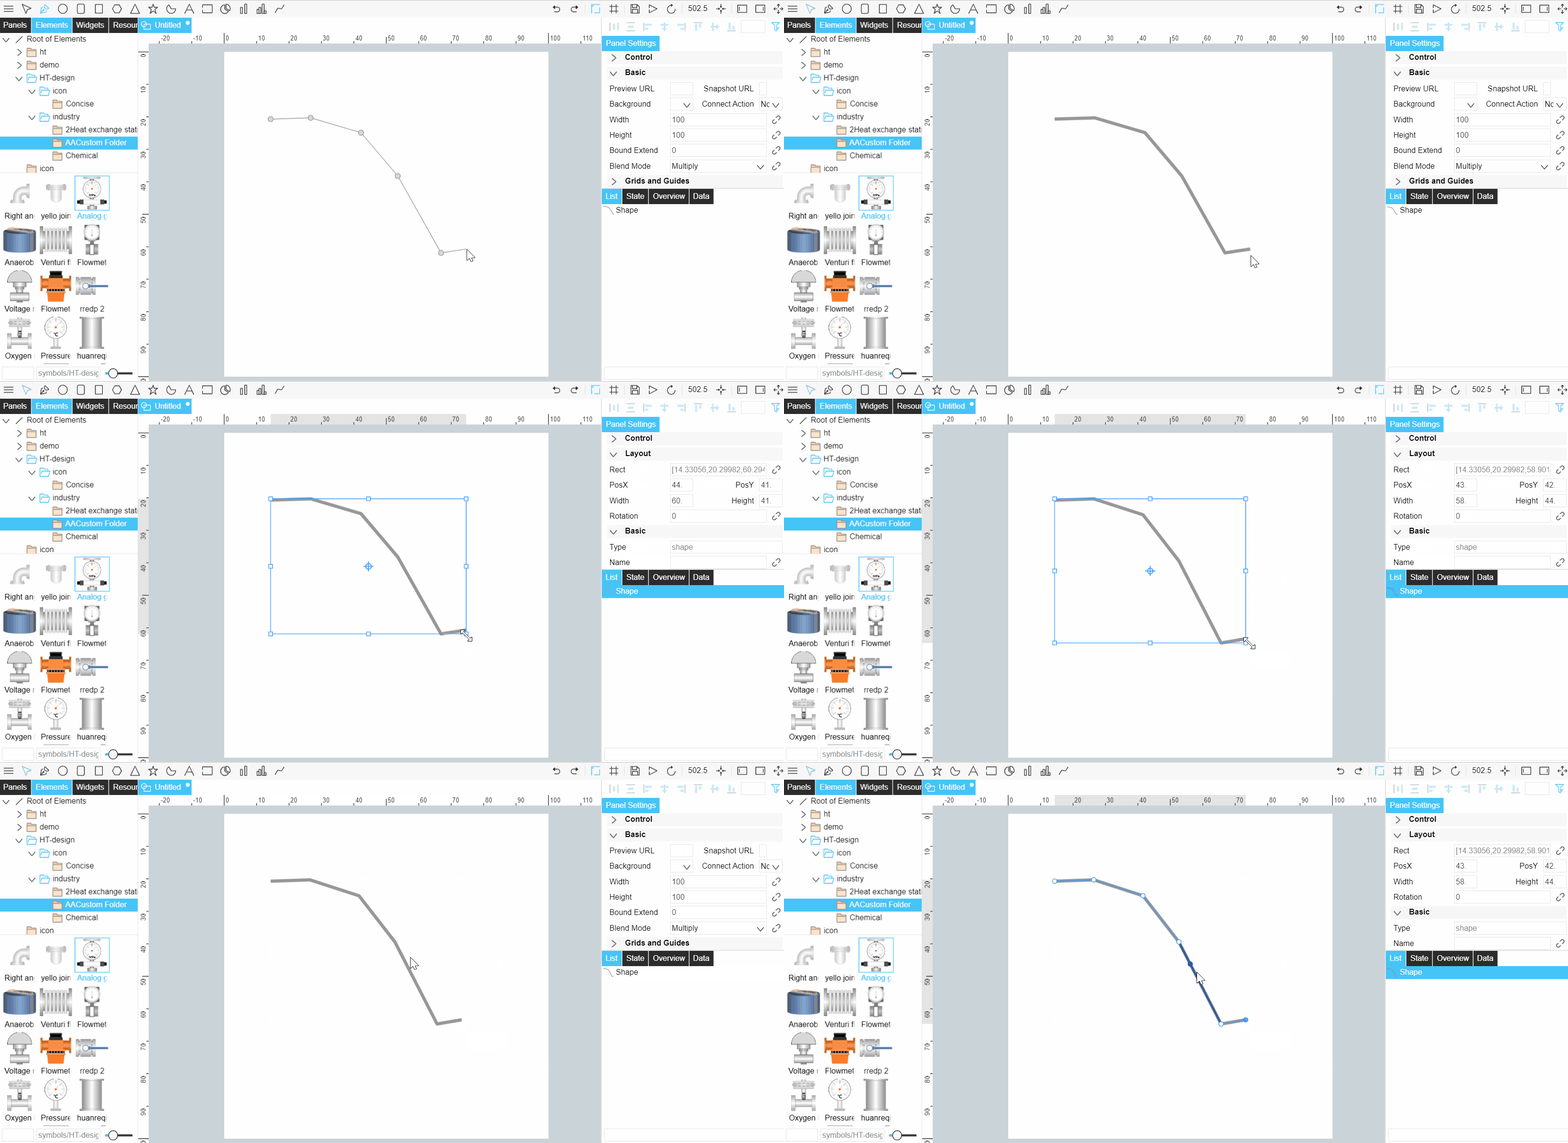
The control point can be selected by selecting the dot with the left mouse button, and a new control point can be created by selecting any position on any line.
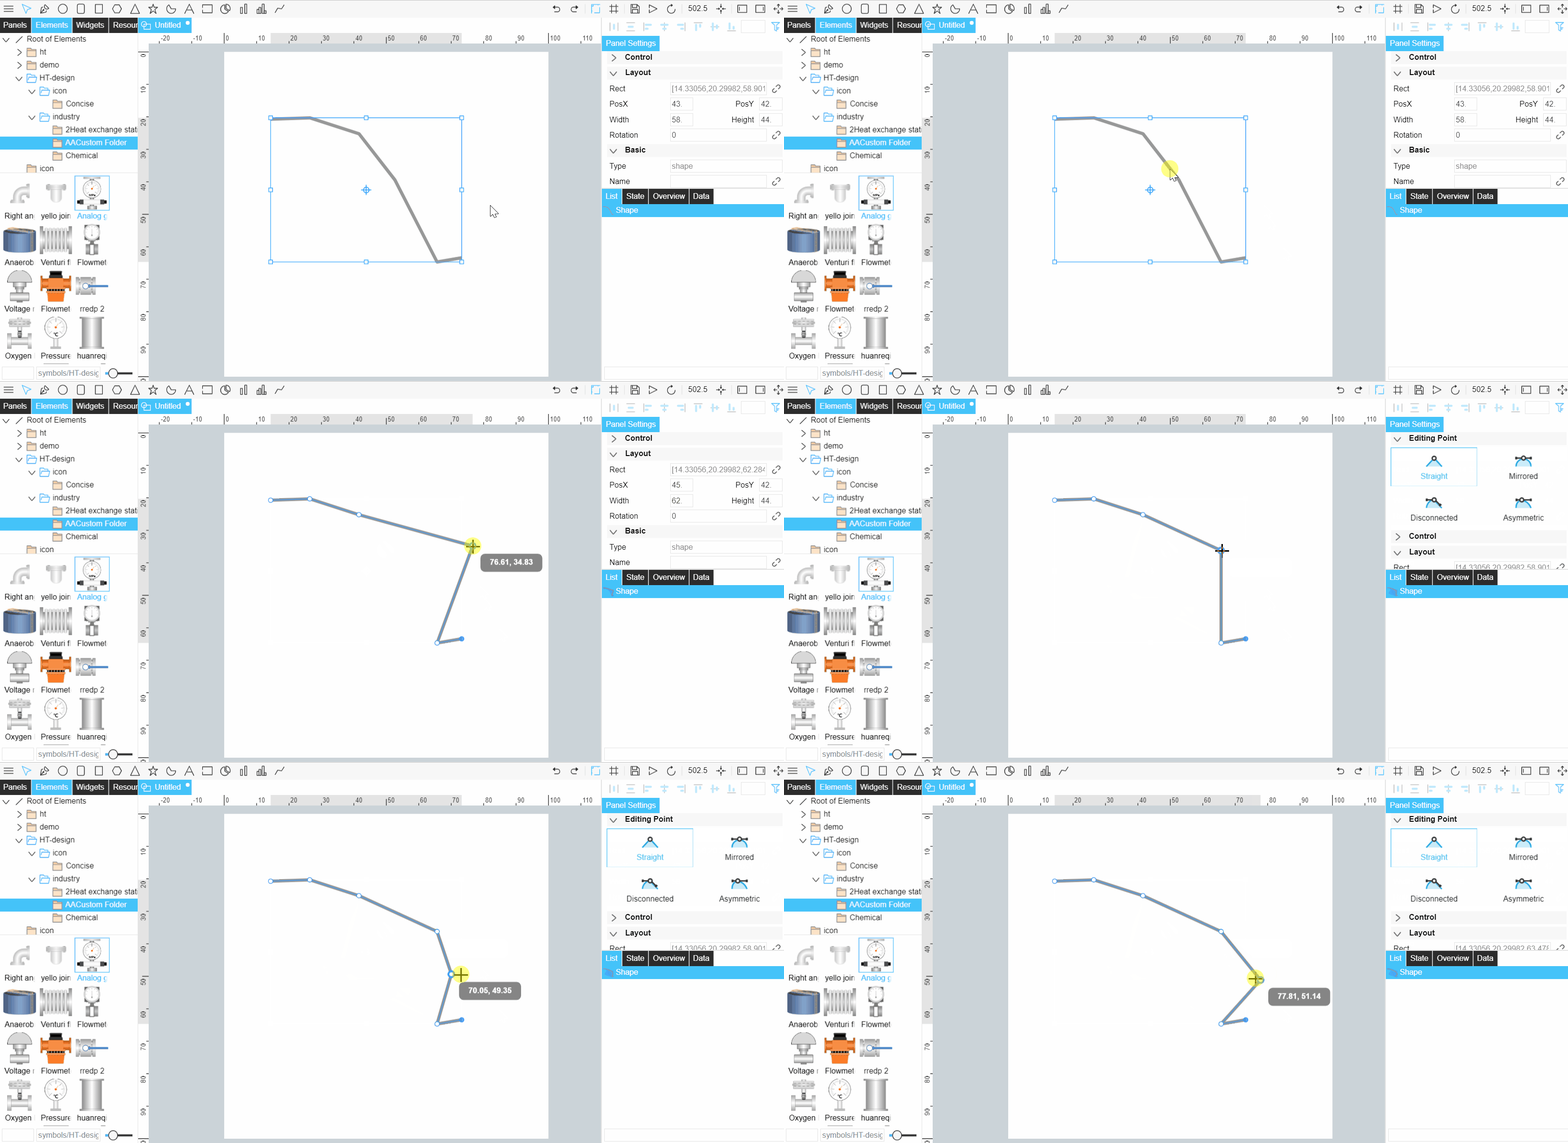
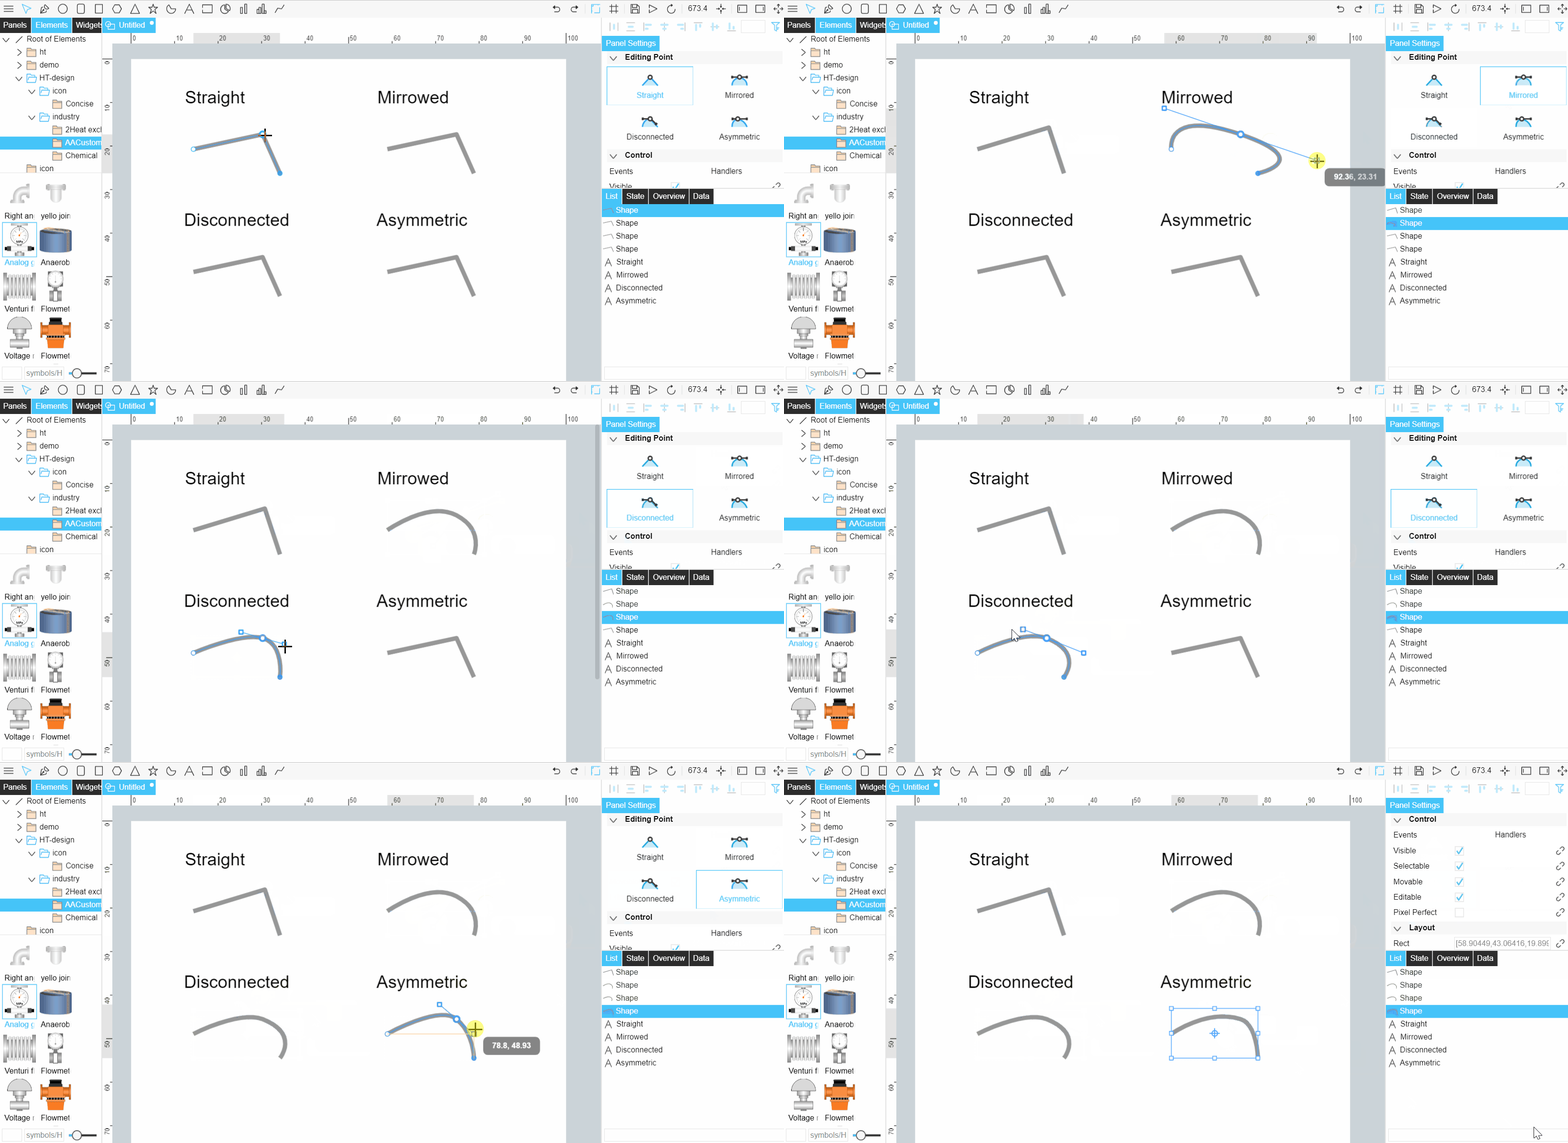
On the right side, under the Editing Point tab, select the control point connection method. There are four types as follows.
Control Point Type |
Availability of Handle |
Handle Performance |
|---|---|---|
Straight |
No |
No handle, straight line on both sides of the control point. |
Mirrored |
Yes |
Left-right symmetry. |
Disconnected |
Yes |
The left and right sides can be operated independently to set the length and rotation. |
Asymmetric |
Yes |
The left and right sides can be operated independently to set the length, but rotate synchronously. |
Note
Handle: used to control the curvature of the line between two points.
Mirrored and Straight: double-click the control point with the left mouse button to switch between the two connection methods.
Asymmetric: If the handle in this state passes over its point, the point on the other side of the handle will be hidden. To show the handle again, you need to check the other control point method and then select back to the asymmetric method.
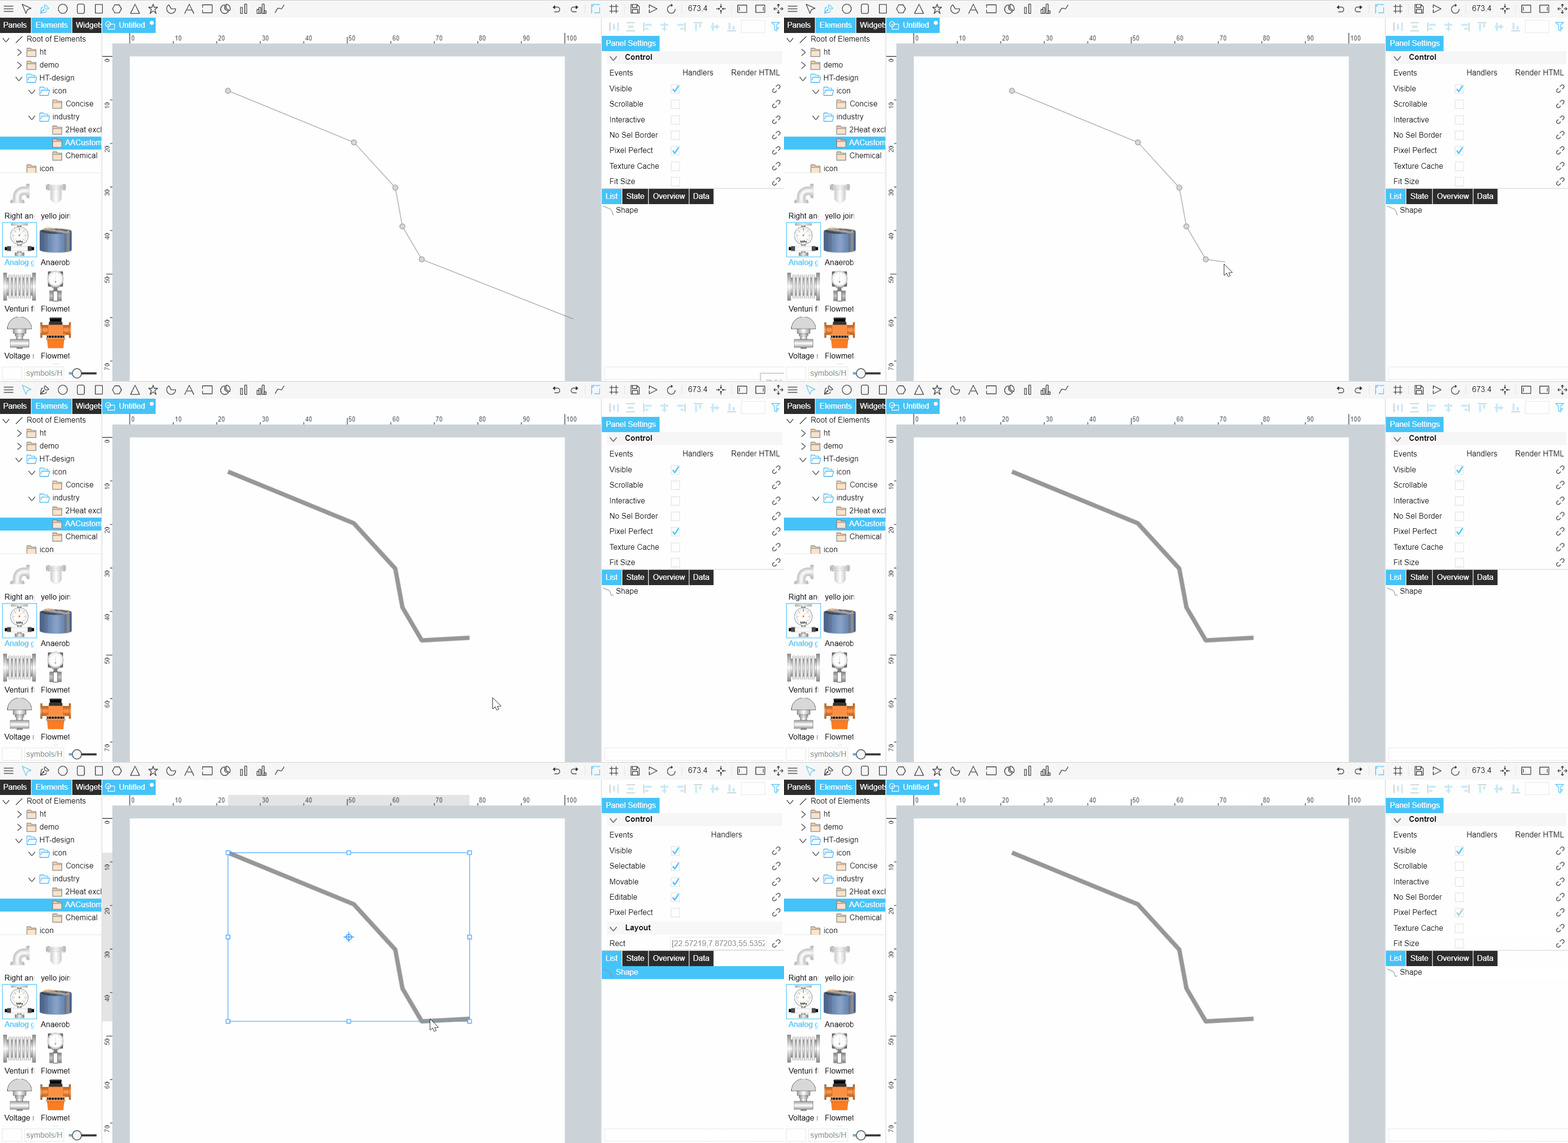
5.Double-click the left mouse button to end the drawing.
6.Double-click a blank space to exit the drawing state and stop editing the drawing. To continue editing, double-click the irregular shape, or select the irregular shape, press the Enter key, and then press the Enter key again to exit editing.
Note
Select a point between two points and press the Shift and Delete keys on the keyboard at the same time to delete all the connected lines in between. If the shape has only three points (including the middle point), all points and lines will be deleted.
If you want to delete a point, you can delete it directly by pressing the Delete key on the keyboard (in this case only the point is deleted, not the line).
Draw regular graphs, charts, borders and text
Select the desired graph or diagram, move the mouse over the panel, hold down the left button and drag the mouse to create the corresponding figure element.
Configuring Element Attributes
Select a single graph on the canvas to configure its graphical attributes individually. All graphs have four main categories of properties: Control, Layout, Basic and Shadow. In addition, different graphs also have other attributes that need to be configured according to the actual situation.
Configuring Element Control Attributes
Under the Control tab, you can configure the following element control attributes.
Field |
Description |
|---|---|
Event |
Event handling: You can add interaction events by selecting interaction actions and editing scripts. |
Visible |
Set whether the element is visible. |
Selectable |
Set whether the element can be selected. |
Movable |
Set whether the element can be moved. |
Editable |
Set whether the element can be edited. |
Pixel Precise |
Set whether the transparent area of the element in 2D mode can be used to select the element. Default is True, meaning ignored. When True, selecting the transparent area of a node will not trigger interaction. |
Configuring Element Layout
Under the Layout tab, you can configure the following element layout style.
Field |
Description |
|---|---|
Area |
The area range of this element. |
X-Coordinate and Y-Coordinate |
Set the horizontal and vertical coordinates of this element. |
Width and Height |
Set the width and height of this element. |
Angle |
Set the clockwise rotation angle of this element centered on the anchor point. |
Configuring Element Basic Attributes
Under the Basic tab, you can configure the following element basic attributes.
Field |
Description |
|---|---|
Type |
The type of this element. |
Name |
Set the name of this element. |
Prefix |
Set a unified prefix for the element’s business attributes. |
Clip Ratio |
The ratio by which the element is clipped based on the clip direction. |
Clip Direction |
The direction from the start to the end of the element clipping. |
Opacity |
Set the opacity of this element. |