Reliability Prediction
In the application of turbines, various turbine models are able to endure various load capacities. When a turbine is located in different locations, the load it takes is influenced by the local environment (such as terrain and wind condition). The reliability prediction function guides the solutions team to locate the optimal turbine model in the best location and predict its future maintenance cost.
Configuring Calculation Parameters
Before the reliability prediction calculation, complete the AEP calculation in the Real Frequency mode. The application type of the selected mast must be Wind Speed and Turbulence. Refer to the section Calculating AEP - Real Frequency for more details.
Select a WTG group object in the project pane.
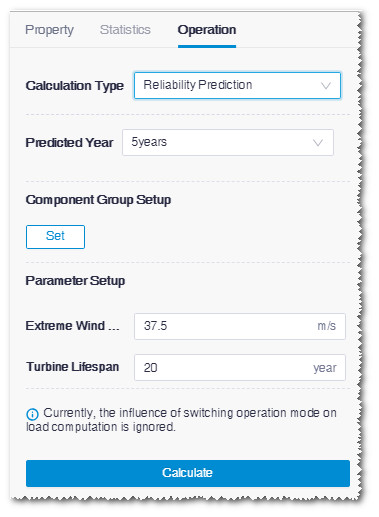
Click the expand icon 《 at the right top of Greenwich interface to open the operation pane.
Select Reliability Prediction in the Calculation Type drop-down list.

Select the predicted year. Currently, there is only one option: 5 years.
Set up component group.
a.Click the Set button in the Component Group Setup area. The Overview page opens.
b.Click the Turbine Model Configuration button.
c.Select turbines.
d.Click the Configuration button. The Turbine Model window opens.
e.Click the Component Selection tab.

f.(Optional) Switch on the Active state button. Only the component groups with the Active status are displayed in the table below. If this button is switched off, all component groups with the Active and Inactive status are displayed in the table.
g.Select the gearbox, main shaft, main bearing, pitch bearing manufacturers.
h.Click the Search button. The component groups corresponding to the selected conditions in Step g are displayed in the table below.
i.(Optional) Click the Reset button to restore to the default options in Step g.
j.Check the details of component groups in the table and select the desired one(s).
k.Click Done to save the selections. The ComponentGroup column in the Overview page shows the selected component group.
Note
If multiple component groups are selected, it is displayed as Multiple.
i.Click Save to save the settings to the WTG group.
Edit the extreme wind speed within 50 yrs and turbine lifespan in the Parameter Setup area.
(Optional) Switch on the Check Tower button to check the configured tower information. Before checking the tower, configure tower for all turbine locations (refer to Configure turbine model for more information), and the tower to be configured must contain load parameters (refer to Configuring Applicable Tower for more information).
Note
If you configure tower with load information and switch the Check Tower button off, only standard tower check information is output in the calculation result.
Note
If you do not configure tower or the configured tower contains no load envelope information, even if you turn on the Check Tower switch, the calculation task cannot be submitted.
Click Calculate to submit the calculation task.
Choose Tools Library > Task List and select Reliability Prediction from the drop-down menu.
When the task progress reaches 100%, the calculation is completed. For details to check the results, refer to the section Checking Calculation Results.
Checking Calculation Results
Double-click the WTG group object in the project. The Overview page opens.
Click the Reliability Prediction tab.
Check the COPQ result.
a.Click the COPQ Test tab.
b.Check the reliability parameters of seleted component group(s). The main parameters are listed as below:
- Terrain KK index: It is a terrain risk level index derived from the study of mapping relation between terrain characteristics in historical typical wind farms and the corresponding failure probability. Currently, 12 grades of this index are available providing reference for turbine model selection and future failure prediction.
- Terrain additional cost: Additional cost caused by terrain. When the terrain KK index exceeds the boundary, it is displayed as !.
- Component additional cost: Additional cost caused by component. When the overload exceeds the boundary, it is displayed as !.
- Total maintenance cost: The sum of terrain additional cost and component additional cost. If any one of them is !, this filed is displayed as !.
- Min COPQ: The minimum value of the maintenance cost of this component group.
- Max COPQ: The maximum value of the maintenance cost of this component group, excluding the value!.
Check the tower check result.
a.Click the Tower Check tab.
b.Check the tower frequency check, extreme load check, and fatigue load check results. The checking items that are not validated are displayed as Not passed in red.
Click Export > Export Details to export the detailed reliability prediction data as an Excel file. The overloaded turbine locations are highlighted.
Click Export > Export Load Report to generate the turbine load applicability analysis report.
Click Export > Derived Tower Report to export the tower customization report.
Note
If the tower check of some turbine location(s) does not pass (any one of the frequency, fatique, or extreme load check), or any turbine location is not configured with tower, the Derived Tower Report option is disabled.