Wind Farm AEP Calculation
To calculate wind farm AEP, the factors of turbine property, turbine layout, wind resource, and mast are to be taken into account.
As the wind farm element varies for each user, Greenwich offers three calculation modes in wind farm design, each of which is applicable in a specific scenario.
- Real frequency: Used when mast exists and CFD model calculation is completed
- WRB: Used when you have wind resource map
- Mesoscale: Used when no mast or wind resource map is available
Operation Mode Selection
Real frequency and mesoscale AEP calculation requires operation mode configuration. Operations are as follow:
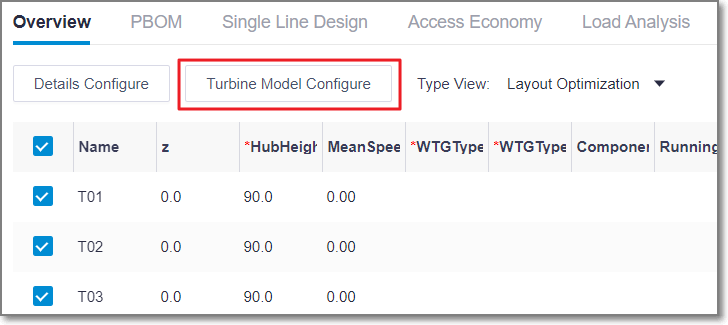
Double-click the WTG group object in the project pane to open overview page.
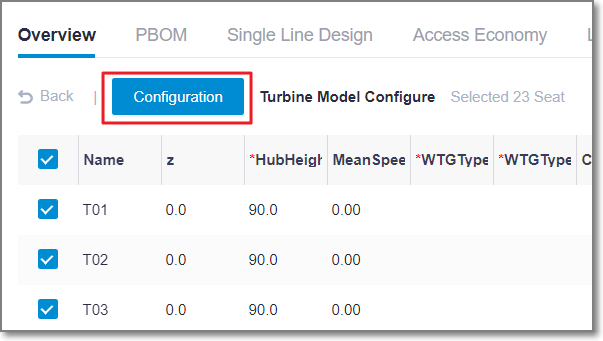
Select turbines and click turbine model configure on the top left corner, then cilck configuration button.
Select turbine model series and turbine model. Choose single operation mode or multi operation mode.
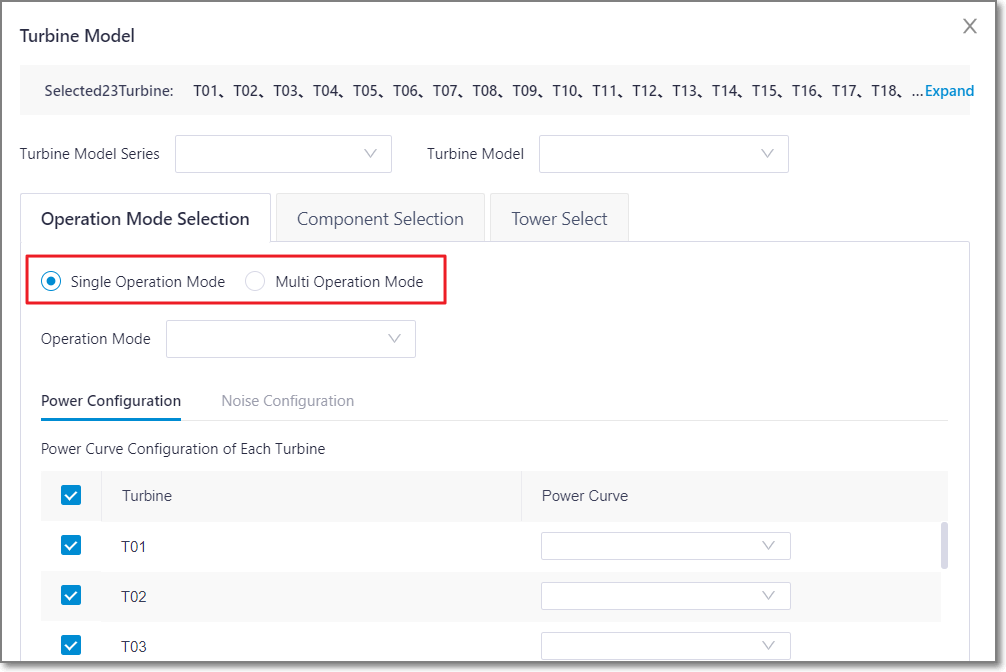
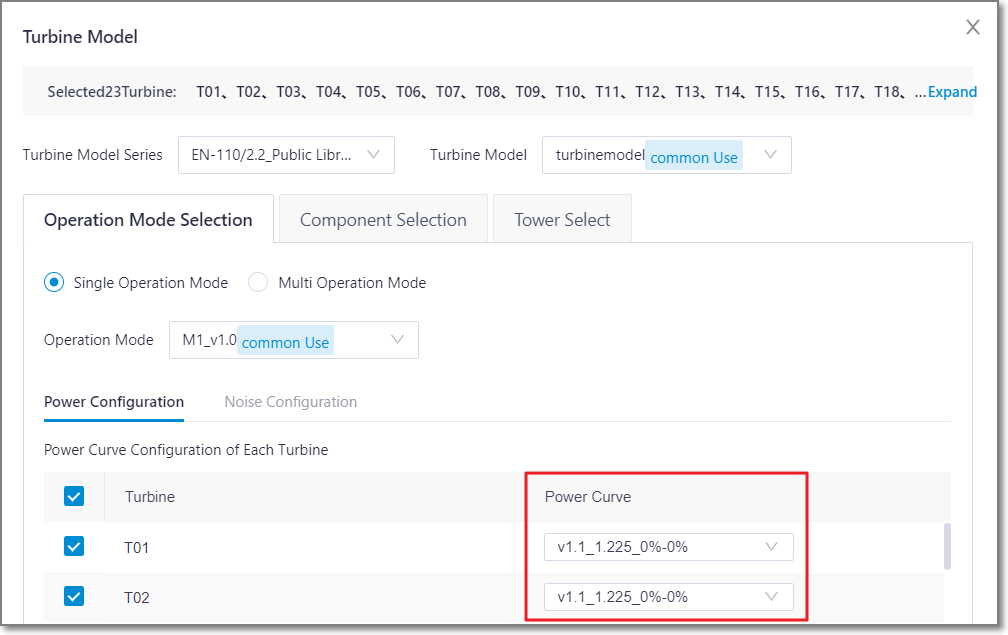
Single Operation Mode
In single operation mode, the power curve is the same for all time periods and all sectors of each turbine.
Select singel operation mode, then configure power curve of each turbine.
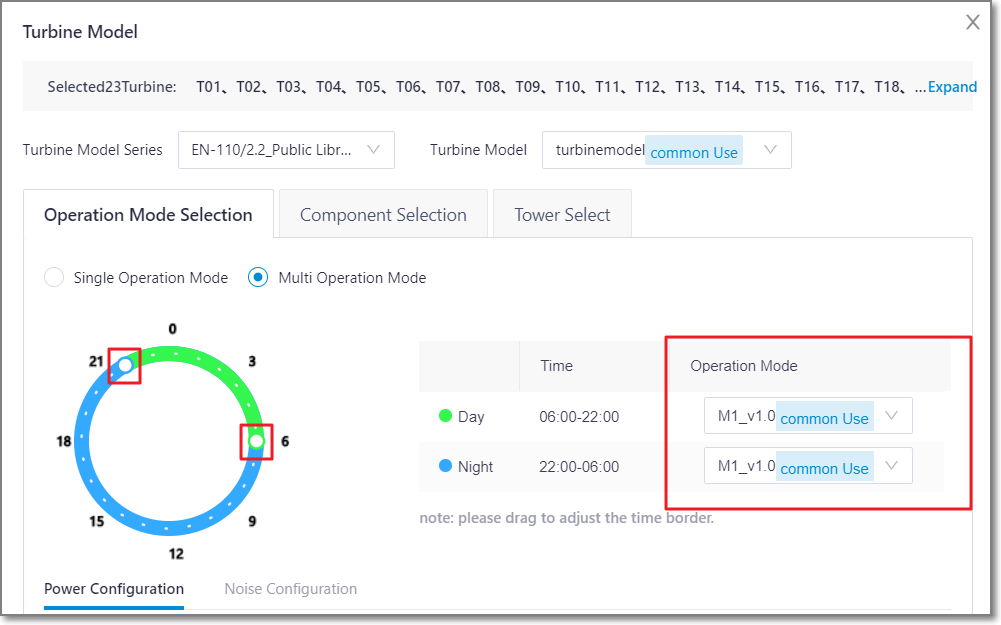
Multi Operation Mode
Multi operation mode supports each turbine configured with different operation mode.
Select different mode for different time period. The time periods are divided into day and night. Drag the node to adjust the day and night time interval.
Configure power curve of each turbine on different time.
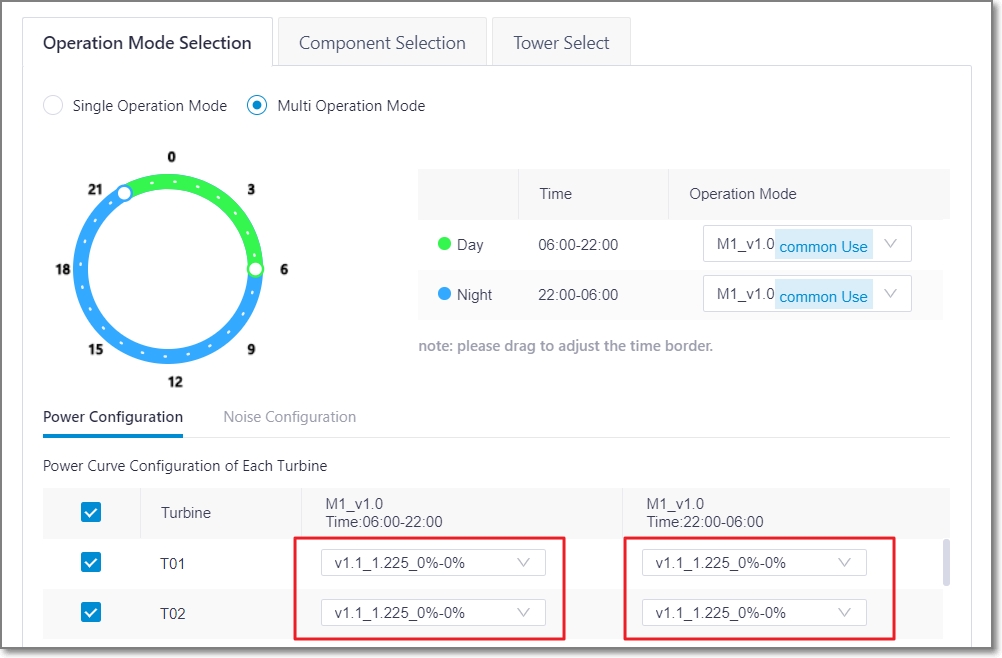
Calculate AEP after all the turbines are successfully configured.
The calculation in three modes are introduced in detail in the following sections, and the way to check calculation result is also demonstrated.
Calculating AEP - Real Frequency
In this mode, the calculation is performed based on CFD wind speed factor, mast time series/real frequency, and power curve. If the selected mast is in the timsigma format, you can verify turbine turbulence after calculation.
Select a WTG group object in the project pane.
Click the expand icon 《 at the right top of Greenwich interface to open the operation pane.
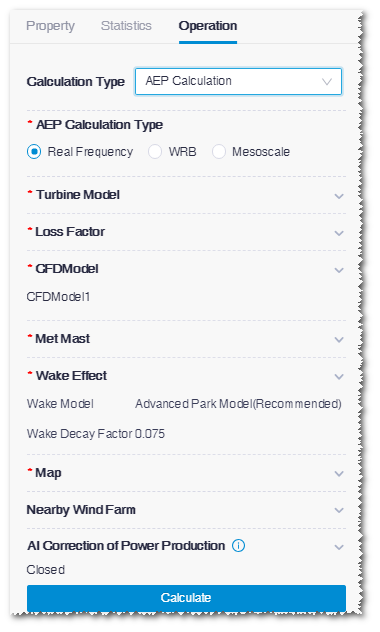
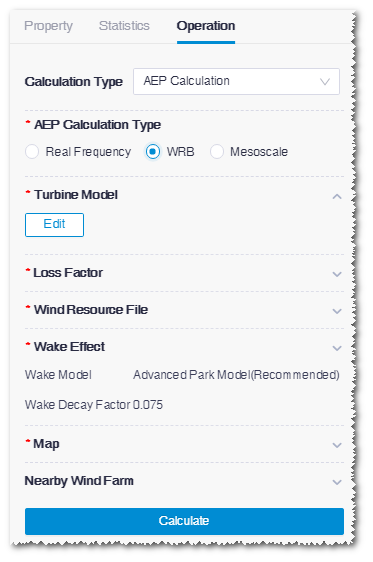
Select AEP Calculation in the Calculation Type drop-down list.
Select Real Frequency in the AEP Calculation Type area.
Figure: AEP Calculation Interface - Real Frequency
Click the Edit button in the Turbine Model area. The Overview page of the WTG page is displayed.
Modify parameters such as hub height, turbine model series, turbine model, operation mode, power curve, etc. Refer to the section Configuring Turbine Property for details.
Click the Save button.
Click the expand icon
 in the Loss Factor area.
Click the Loss Factor Items button. The settings window opens.
Select Uniform losses or Losses by turbine from the Type drop-down menu.
Set up the parameters in the table and click the Save button to save the changes.
Click the expand icon
in the CFDModel area.Select a CFD model and double-click in the cell to input AirDensityHeight and AirDensity.
Click the Done button to save the changes.
Click the expand icon
in the Met Mast area. All the mast objects in the projects are listed.Click the check box before the mast name to select it and input application height and application type.
You can select more than one masts, but these masts must be with the same application type.
You can select more than one masts, but these masts must be with the same application type.
If the selected mast is in the timsigma format, the available type is WindSpeed and Turbulence.
After calculation, you can verify turbine turbulence and shear. Refer to the section Analyzing Turbine Load for details.
(Optional) Select Power generation inspection table, select a mast, and input the scope. After the AEP calculation is completed, click the Export Table button in the WTG Overview page to output the AEP results at various wind speed levels within the survey scope.
(Optional) Select Shear correction, select the referential correction mast, and input the shear value of referential mast. The system compares this shear value with that in CFD model and calculates their difference value to correct the overall shear in turbulence matrix and improve the accuracy of load adaptability analysis.
Note
This function is applicable only to masts of the Wind Speed and Turbulence type. The masts of other type will not show up in this option list even if they are selected.
(Optional) Select Output time series. After the AEP calculation is completed, click the Export Time Series button in the WTG Overview page to output the time series file.
Click the Done button to save the changes.
Click the expand icon
in the Wake Effect area to set up wake effect model and wake decay constant.The Park model applied in Greenwich is a simple Park model calculating maximum upwind wake flow; Complex Park model is the same as WAsP model with consideration of wake flow overlay effect of multiple rows of turbines. Wake decay constant is a parameter in Park model, representing the wake effect expansion ratio along axis. Normally, input 0.075 for wind farms onshore, and 0.04 for wind farms along the shore of East China Sea.
Click the OK button to save the changes.
Click the expand icon
in the Map area. All the map objects in the projects are listed.Select a map and click the Done button to save the setting.
Click the expand icon
in the Nearby Wind Farm area, select nearby wind farm(s), and configure the selected wind farm(s) to calculate the wake influence between the current wind farm and nearby wind farm(s).Note
The settings in this area are not mandatory. If no wind farm is nearby, skip Step 21-22.
a.Select the wind farm object in the list. The options in the list are wind farm objects in the project other than the current wind farm.
b.Click the Config button at the right side of selected wind farm to open the corresponding overview page.
c.Set up the turbine model, hub height, and power curve of each turbine in the table.
d.Click Save.
Click the Done button in the Nearby Wind Farm area to save the settings.
Click the expand icon
in the AI Correction of Power Production and turn on the switch to open this function.Note
Currently, only turbines calculated by CFDRans within China and whose distance to mast is less than 10 km are supported.
目前仅支持中国地区采用CFDRans计算、且测风塔和机位距离100m~10km的机位。某机位是否采用AI修正,可在wtggroup概览页面查看AI修正属性。
Click Calculate.
When the calculation is completed, check the AEP-related results at the bottom of the operation pane.
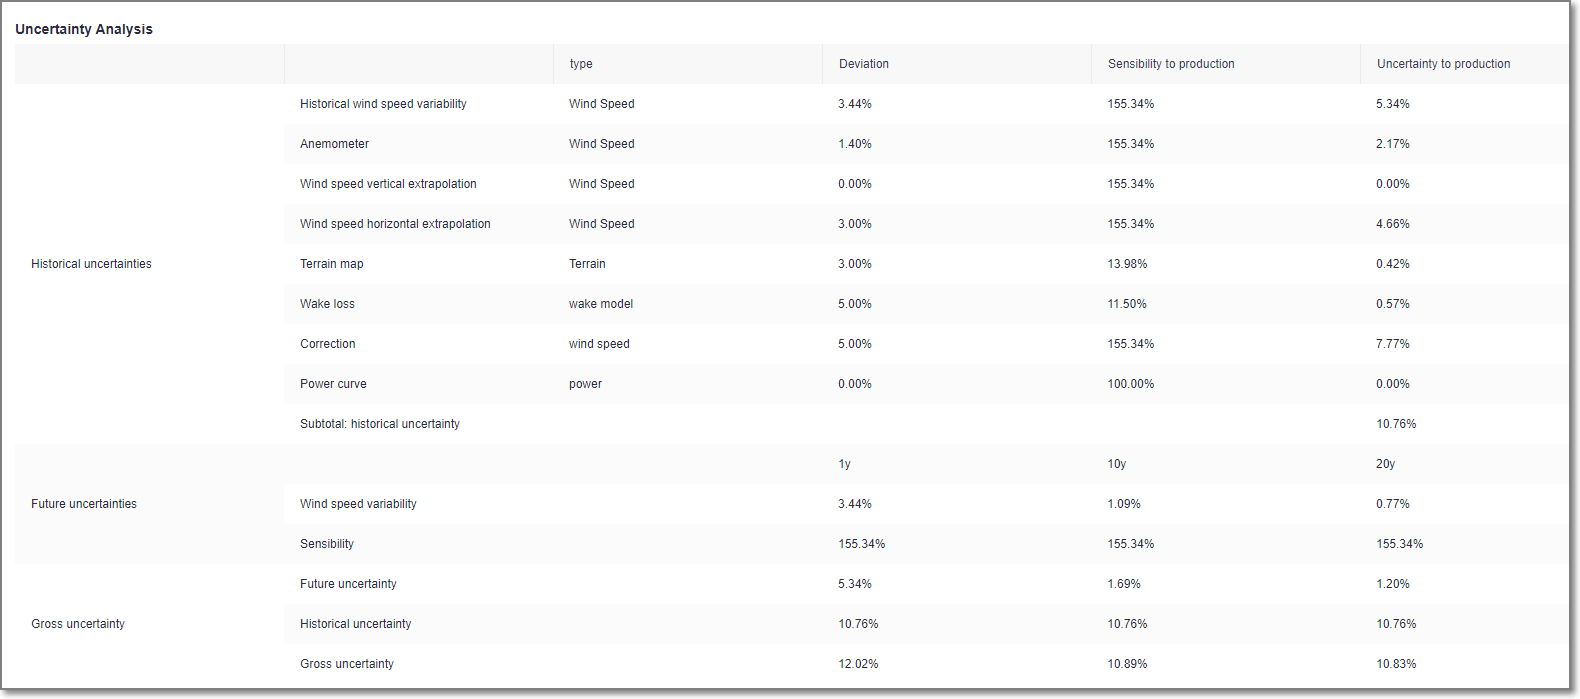
Uncertainty Analysis
Uncertainty analysis is used to analyze the uncertainty of power generation based on the current calculation model under the current input condition and data processing process.
Double-click the WTG group of Project pane after finishing AEP calculation.
Click the Uncertainty tab.
Select the raw data object of the mast in the Ref. Mast drop-down menu.
Note
Currently only one mast can be selected, so choose the most representative one
Click auto fill to calculate the input parameters of the project
After the calculation, the above parameters can be modified (e.g., Wind speed horizontal extrapolation deviation) or maintained.
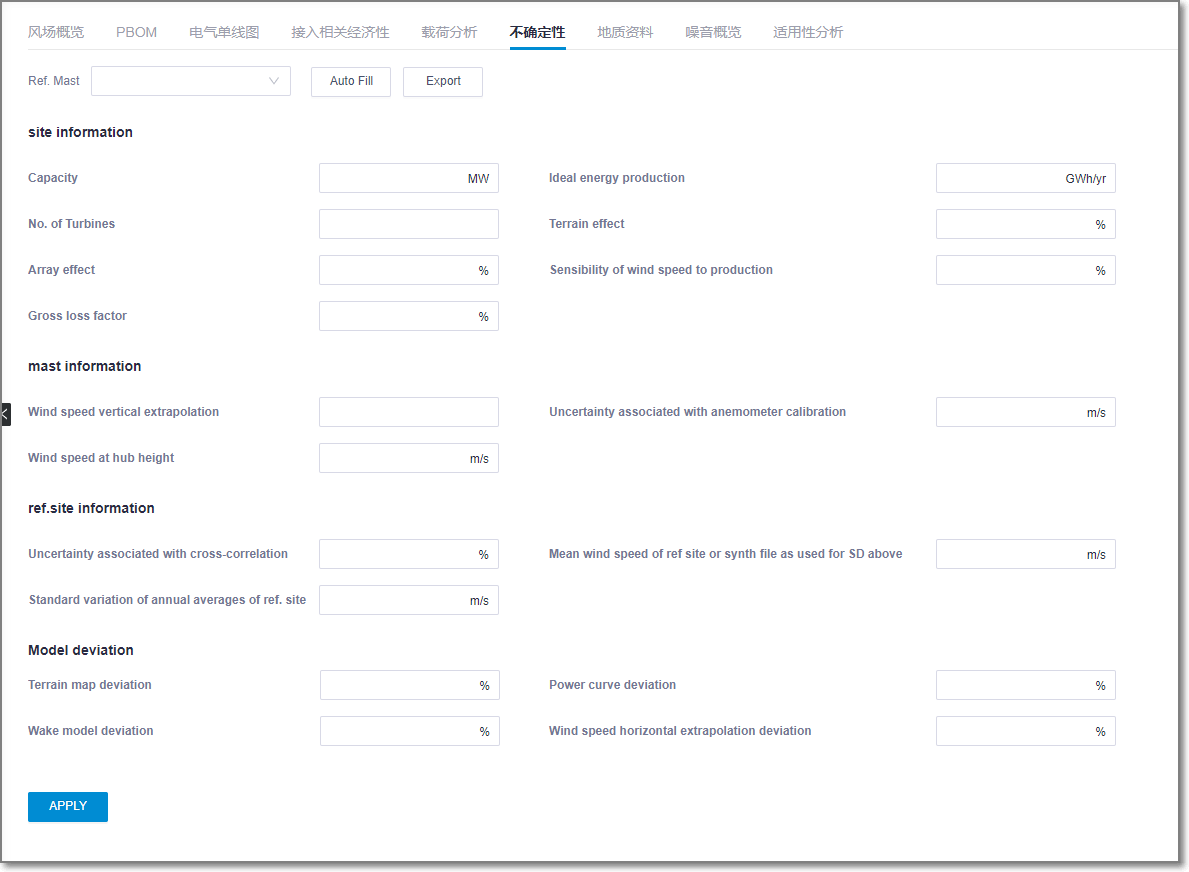
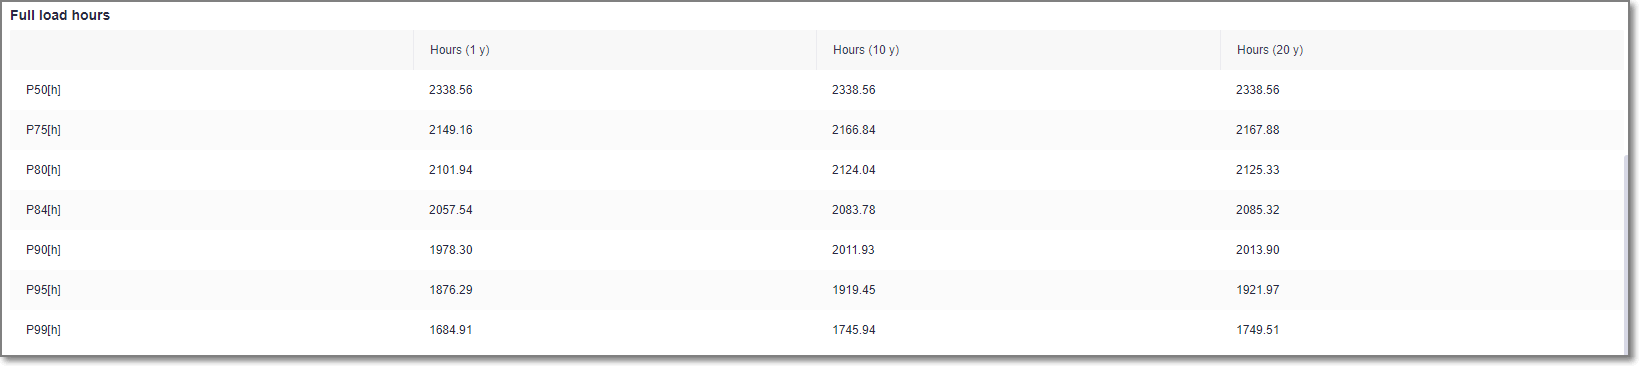
Click apply to get the gross uncertainty and AEP results at different confidence intervals.
Calculating AEP - WRB
In this mode, the calculation is performed based on wind resource map and turbine model configuration.
Select a WTG group object in the project pane.
Click the expand icon 《 at the right top of Greenwich interface to open the operation pane.
Select AEP Calculation in the Calculation Type drop-down list.
Select WRB in the AEP Calculation Type area.
Figure: AEP Calculation Interface - WRB
For setup of turbine model, loss factor, wake effect, map, and nearby wind farm, refer to the section Calculating AEP - Real Frequency for details.
Click the expand icon
in the Wind Resource File area.Select a wind resource map and set up its hub height.
Click the Done button to save the changes.
Click the expand icon
in the Control area.Select the Suggest met mast locations option to recommend points suitable for mast location.
Click the Done button to save the changes.
Click Calculate.
When the calculation is completed, check the AEP-related results at the bottom of the operation pane.
Calculating AEP - Mesoscale
In this mode, the calculation is performed by configuring wind farm wind speed and air density.
Select a WTG group object in the project pane.
Click the expand icon 《 at the right top of Greenwich interface to open the operation pane.
Select AEP Calculation in the Calculation Type drop-down list.
Select Mesoscale in the AEP Calculation Type area.
Figure: AEP Calculation Interface - Mesoscale
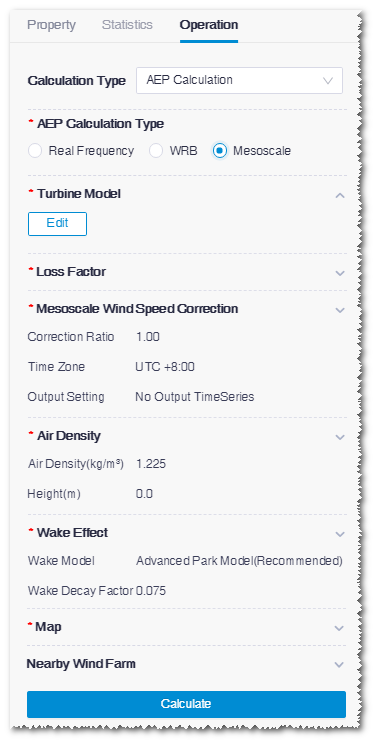
For setup of turbine model, loss factor, wake effect, nearby wind farm, and map, refer to the section Calculating AEP - Real Frequency for details.
Click the expand icon
in the Mesoscale Wind Speed Correction area.Input the wind speed correction ratio and time zone.
(Optional) Select to output Power generation inspection table or Time series.
Click the Done button to save the changes.
Click the expand icon
in the Air Density area.Input air density and the corresponding height.
Click the Done button to save the changes.
Click Calculate.
When the calculation is completed, check the AEP-related results at the bottom of the operation pane.
Checking Results
Double-click the WTG group object in the project pane. The Overview page opens displaying the AEP calculation results. The AEP calculation result consists of:
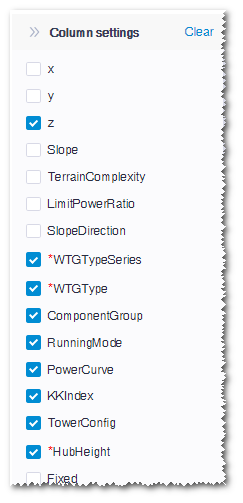
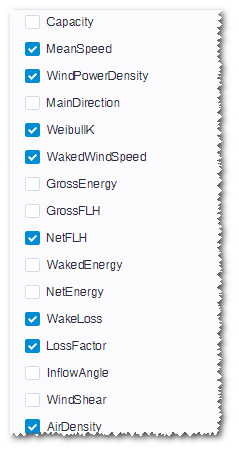
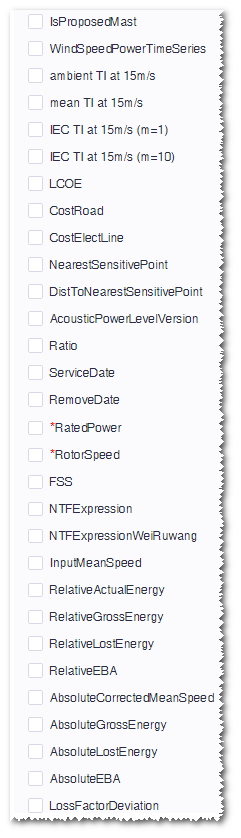
Select interested parameters in the Column Settings list to add them in the table. Export one year-data file of all turbines or time series file of some turbines. Refer to the section Configuring Turbine Property for more details.
Click the PBOM tab to check the PBOM details of each turbine.
Add materials in the material tree.
a.Select the material group No. and material No..
b.Input the engineering quantity.
c.Input the price.
d.Click the + icon to add a material item.
e.Click Save at the left top of this page to save the settings.
Edit the quantity and price.
a.Double-click the cells under the Quantity and Price column to edit their values.
b.Click Save at the left top of this page to save the settings.
Delete the material.
a.Click the delete icon
 at the right end of an item to delete the respective material.
b.Click Save at the left top of this page to save the settings.
Analyzing Turbine Load
If the selected mast is in the timsigma format, the available types are Turbulence or WindSpeed and Turbulence. After calculation, you can verify turbine turbulence and shear on the Load Analysis page.
To analyze turbine load, ensure the following tasks have been completed:
- In the configuration of AEP calculation in the real frequency mode, select a mast in the timsigma format and define the mast type as Turbulence or WindSpeed and Turbulence.
- The AEP calculation is completed.
For details of AEP calculation in the real frequency mode, refer to the section Calculating AEP - Real Frequency .
Double-click the WTG group object in the project pane. The WTG group overview page opens.
Click the Load Analysis tab.
Select a analysis mode.
- Mean TI: The turbulence intensity at the turbine location equals to the mean turbulence value of every wind speed levels. (P50)
- Representative TI: The turbulence intensity at the turbine location covers almost 90% of the ambient turbulence scope by considering dispersion of ambient turbulence. (P90)
- Extrapolate: The wind speed at each height of each direction, provided by model simulation, is analyzed by comparing with actual extrapolate.
Select turbine locations in the Layout list.
Select All to select all the turbine locations.
Select Turbulence Class. The selected turbine locations are to be filtered based on the filtration of their turbulence.
Turbulence Class Description A+ This is a turbulence class from the IEC standard covering turbulence intensity larger than 0.16 at the wind speed of 15m/s. A This is a turbulence class from the IEC standard covering turbulence intensity between 0.14 and 0.16 at the wind speed of 15m/s. B This is a turbulence class from the IEC standard covering turbulence intensity between 0.12 and 0.14 at the wind speed of 15m/s. C This is a turbulence class from the IEC standard covering turbulence intensity smaller than 0.12 at the wind speed of 15m/s. Select a number in the Sector drop-down menu.
Click the Create button to generate turbulence curve at the turbine locations.
Click the Export Report button to export the turbulence report.
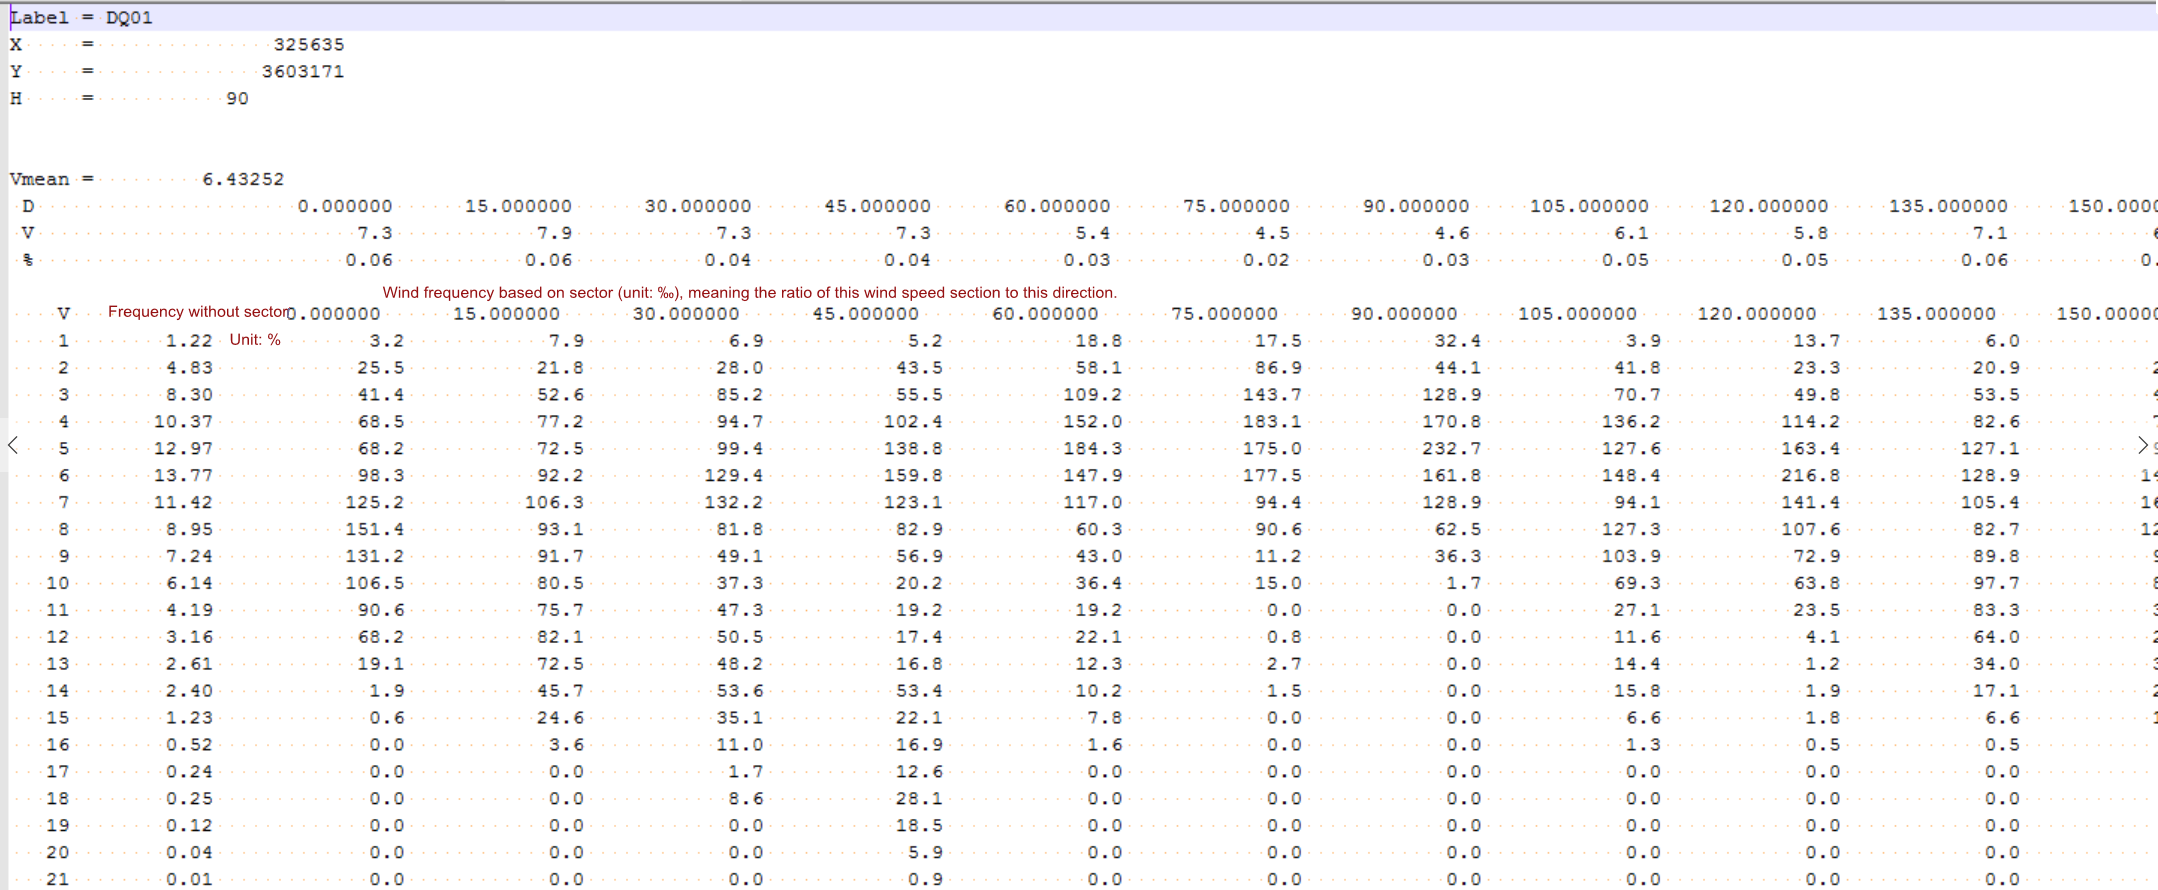
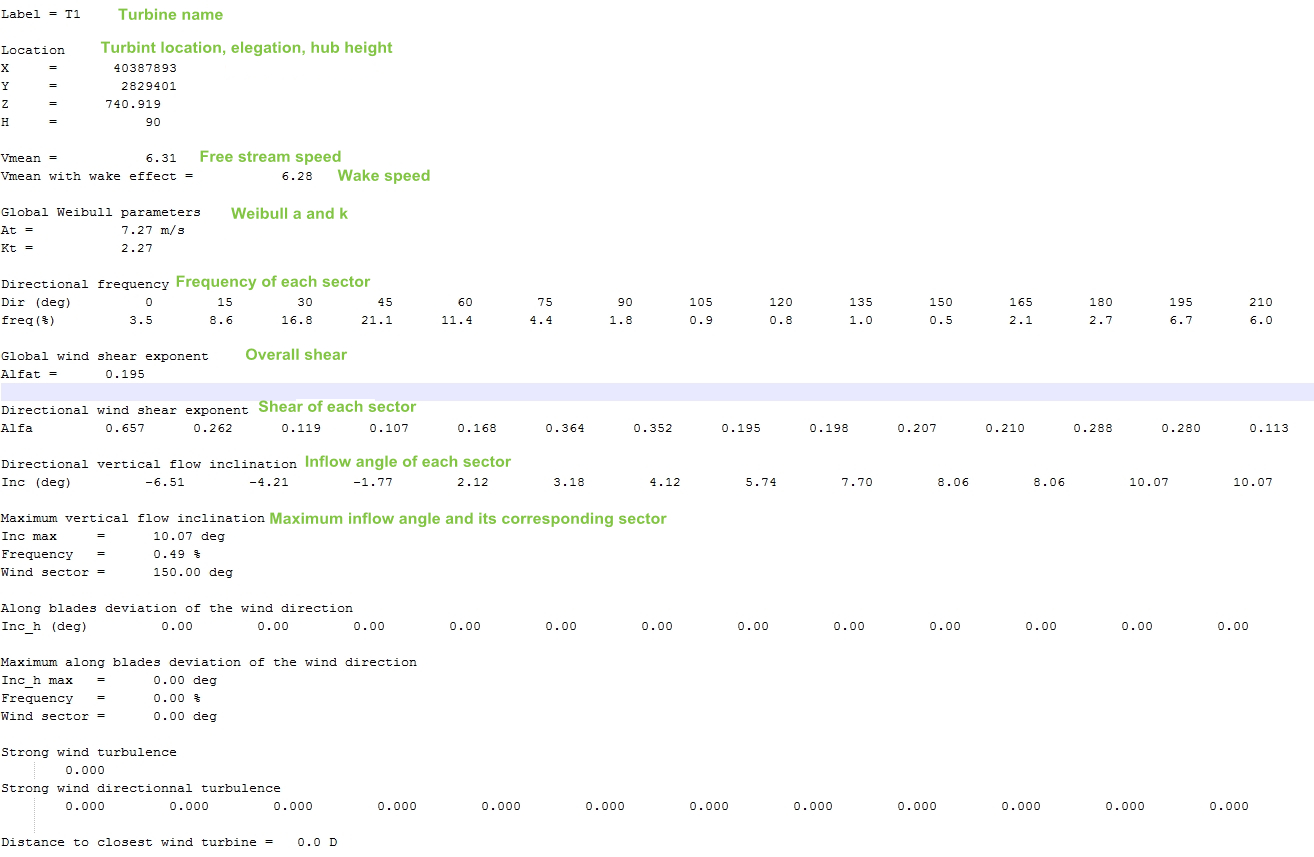
Click the Export Turbulence Metrics button to export a metrics file in the txt format. Its format is shown in the following figure:
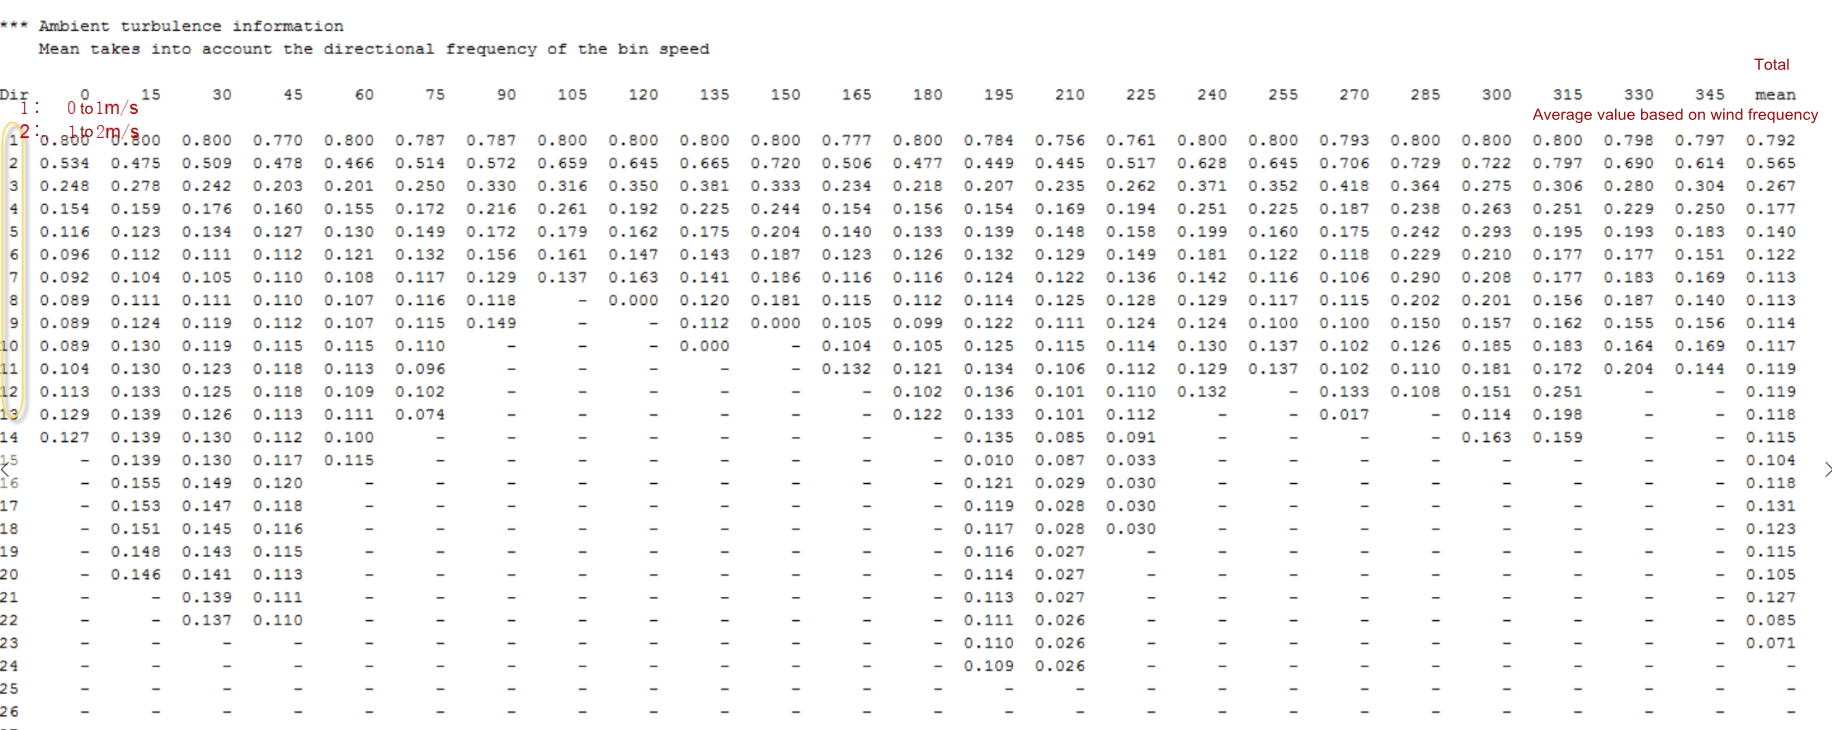
Click the Export Wind Distribution Metrics button to export a metrics file in the txt format. Its format is shown in the following figure: