IoT Hub
In EnOS 2.2 Release, we added new features and functions for models, devices, and firmware OTA, improved alert service functions, and added the Device Integration Service for IoT Hub.
Device Connectivity & Management Service
Model
You can now set a default value for an attribute when creating or updating the model feature definition.
Firmware OTA
The signature algorithm of a firmware now supports SHA256.
You can now view firmware statistics such as the firmware version distribution and percentage for a product.
You can now filter the upgrade failure results not only using the device key, but also using the current firmware version, reason of failure, and time range.
You can now set the maximum number of concurrent OTA upgrade devices to avoid data traffic congestions and failures.
You can now choose whether to retry failed OTA upgrades by configuring retry interval and attempts during OTA task creation.
You can now choose to start OTA upgrade tasks only if the firmware is successfully verified.
You can now set up concurrent multiple instances for both verification and upgrading tasks.
For more information, see Firmware Upgrade OTA.
Device Monitoring
For this release, we added several functions for the dedicated monitoring of devices at the OU level to increase the ability to monitor device connections and behaviors, detecting potential issues and overall improving the operation and maintenance of the devices.
Logs
The logs function enables you to view logs of all devices under a product, categorized by Cloud Logs and Device Logs. For more details, see Viewing Logs.
Message Tracing
The message tracing feature enables you to quickly locate and analyze the cause of a failure if it occurs during device activation, command issuance, and data reporting. For more information, see Message Tracing.
Real-time Monitoring
The real-time monitoring function enables you to monitor events related to device behavior and connections such as device event reporting failures, number of messages sent by and to the platform, etc., where real-time statistics are displayed via line charts or histograms. The feature also provides device-specific topic channels for devices to report their network status. For more information, see Real-time Statistics.
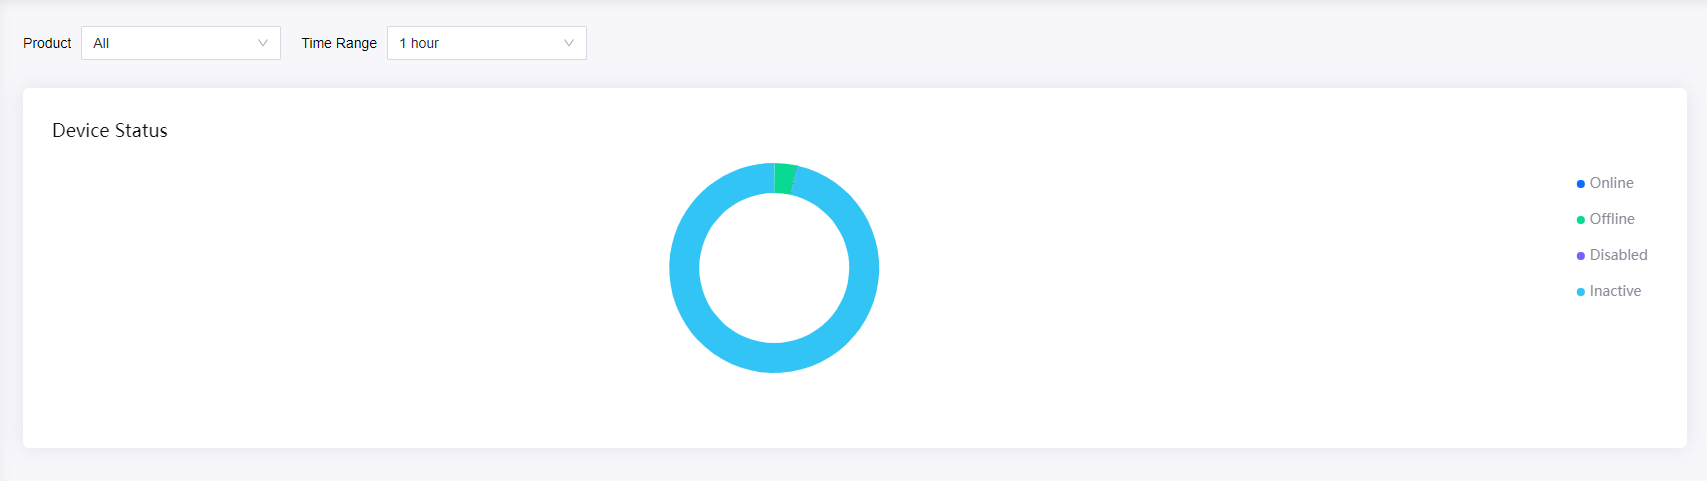
Device Monitoring Dashboard
The device monitoring dashboard provides you with an easy to read summary of the device status, behaviours, and connections. You can view the real-time device status of products as well as customize the dashboard by pinning the graph search results from Real-time Statistics. For more information, see Monitoring Dashboard.
Alert Service
The alert service is improved with the addition of the advanced function for alert rules and alert records.
Alert Rules
The advanced alert rule function is an enhancement of the basic function that gives you more options for comparisons when configuring the condition for the triggering the alert. See the table below for more details.
| Basic Function | Advanced Function |
|---|---|
| Need to create an alert content before creating an alert rule. | Alert content and alert rule are merged: alert content can be directly entered when creating an alert rule. |
| Can select only one measurement point as trigger condition. | Can select two measurement points as triggers for comparison as the trigger condition. |
| Events cannot be selected as triggers. | Events can be selected as triggers. |
| Can select the device status for all devices under the specified model as trigger condition. | Can select the device status for all devices as the trigger for the trigger condition. |
| Can only use the measurement point threshold as alert trigger conditions. | Added timing conditions based on tumbling windows as alert trigger conditions. |
| Does not support discrete alerts. | Supports discrete alerts. |
| Saves an alert as a historical record by default. | Supports the option to not save the alert as a historical record after the alert is cleared. |
For more information on how to set alert rules using the advanced function, see Creating Alert Rules.
Device Integration Service
The Device Integration Service is a new service in IoT Hub that helps you schedule, automate, and orchestrate workflows when you need to integrate device data across enterprises or organizations. The Device Integration Service simplifies how you design and build scalable solutions for device data integration in the cloud. The Device Integration Service has the following functions.
A dashboard that enables you to monitor and view the resource usage and flow operation status for the integration flows created to have a better perspective of the overall flow health status. For more information, see Monitoring Flows.
A flow designer that enables you to create, design, deploy, and manage integration flows, where every flow can consist of multiple nodes. For more information about the nodes that are available in the flow designer, see Nodes Overview.
For more information about the Device Integration Service, see Device Integration Service.