Map
The Map widget is generally used for visualization analysis capabilities based on geographic location, and allows you to use latitude and longitude data to analyze and view data in different regions. In the Map widget, the data that needs to be displayed can be filtered by configuring a global filter.
The configuration items of the Map widget mainly include Basic Settings, Data Items, and Chart Style.
Basic Settings
In the Basic Settings section, provide the following basic information of the Map widget:
Basic Information: Enter the title and description of the Map widget, and configure the title font and whether to hide the title
Other Options: select data refresh frequency
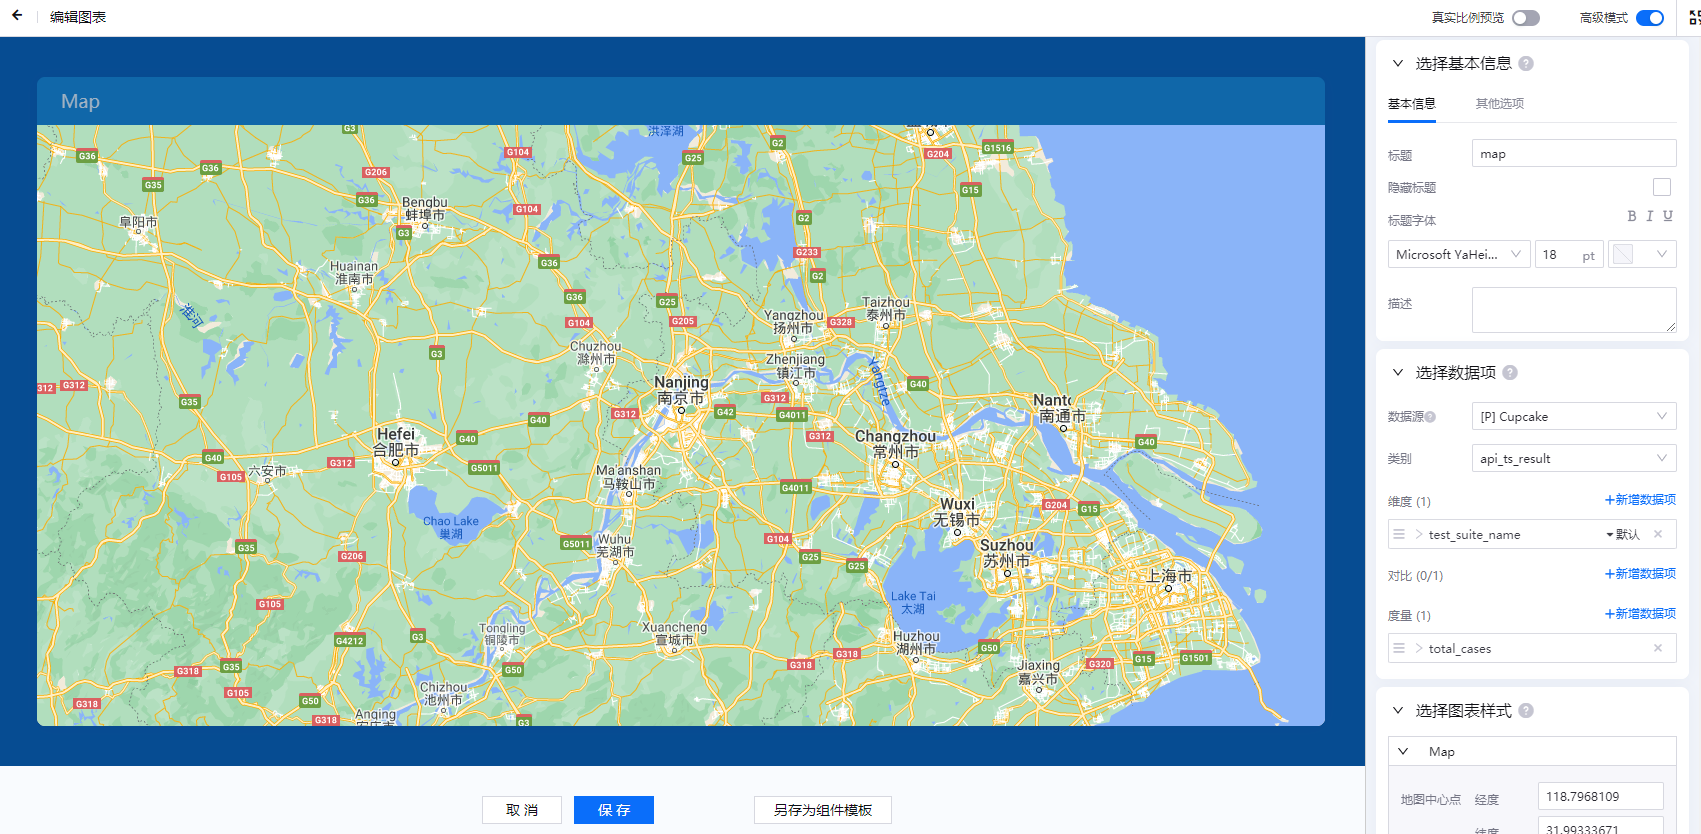
Data Item Configuration
In the Data section, add the data that needs to be displayed in the Map widget:
Data Source: Select the added data source
Category: Select the model of the data item according to the selected data source
Aggregation: Select whether to aggregate the data
Parameters: Configure various parameters according to the selected data source and category
Dimension, Comparison, and Measurement: Select a combination of dimensions, comparisons, and measurements in the data set. The chart will dynamically display the acquired data according to the selected combination.
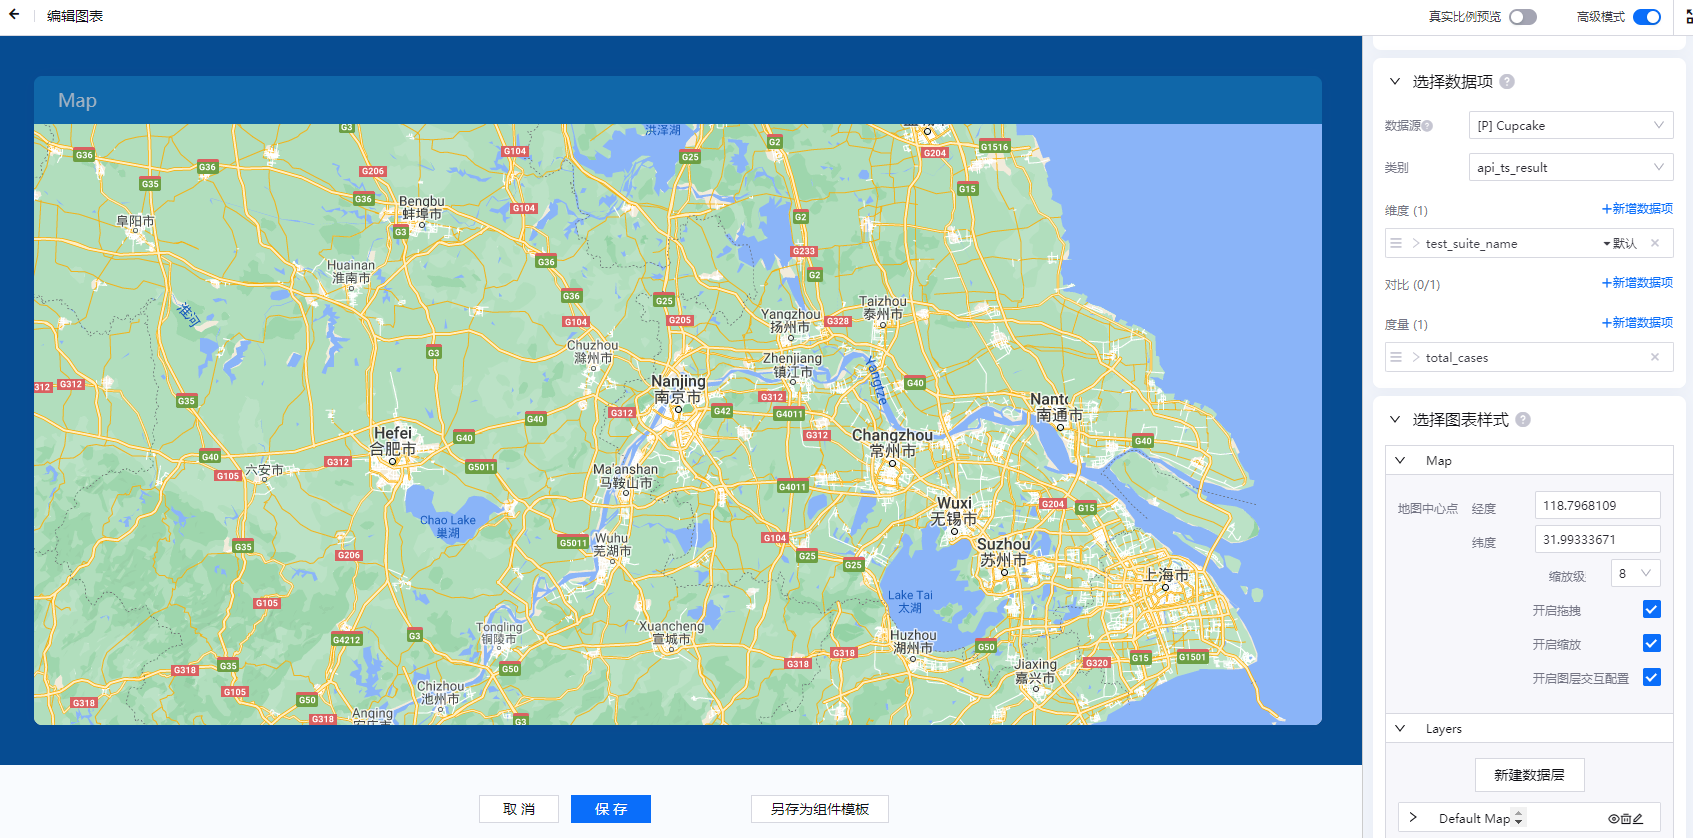
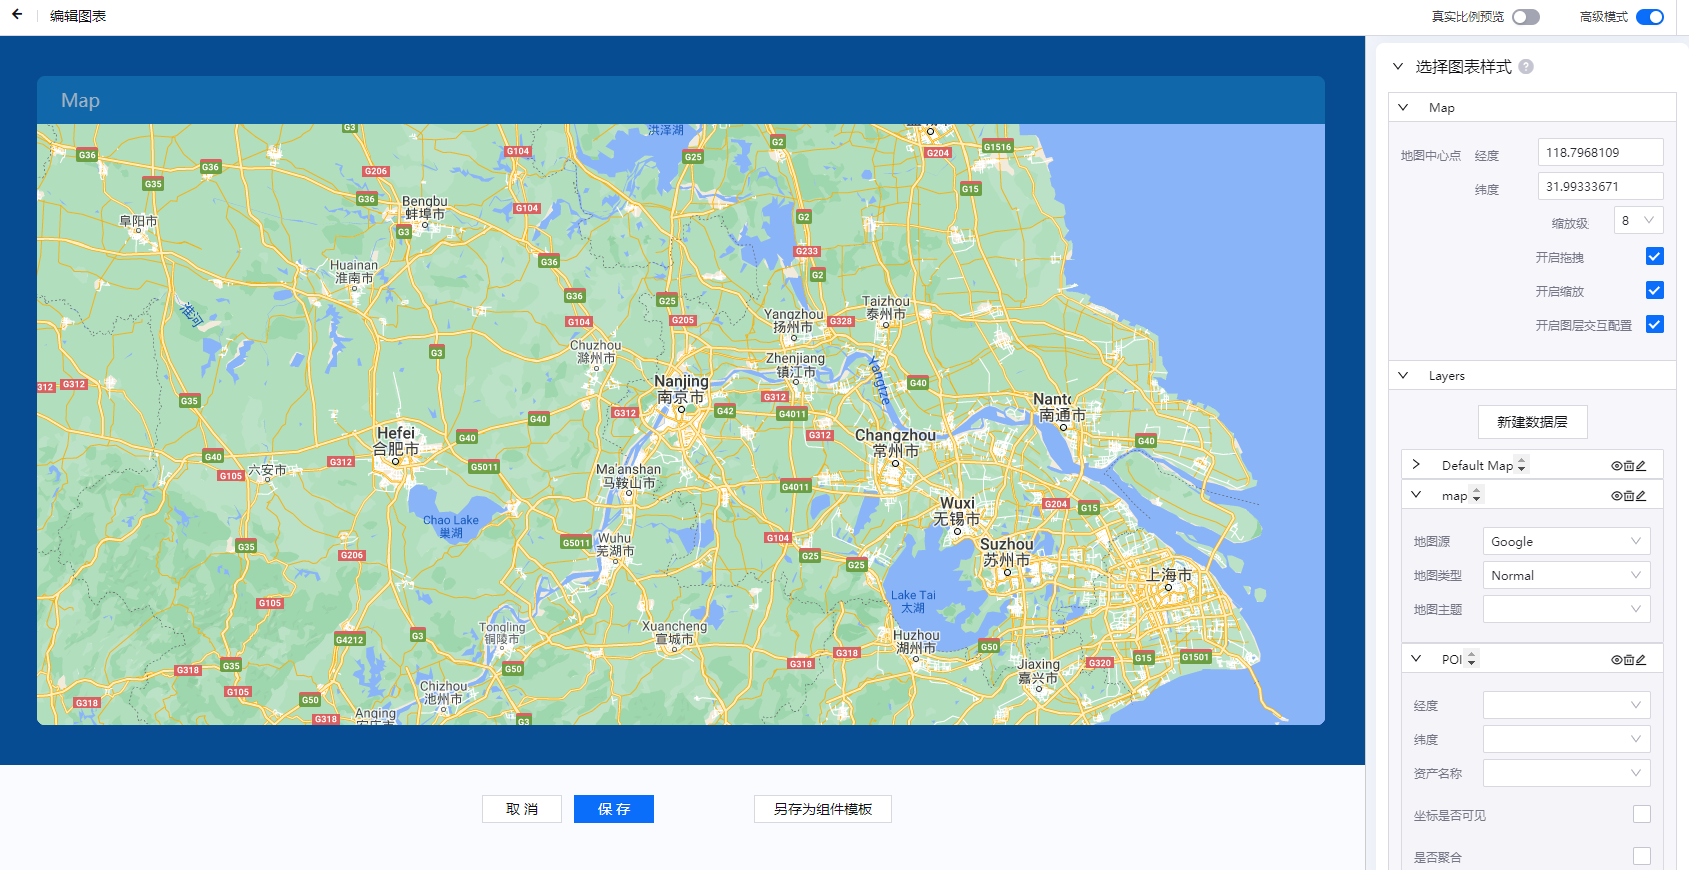
Chart Style Configuration
In the Chart Style section, configure the map format and data layer format of the Map widget.
Map: Configure the latitude and longitude of the map center point, the zooming and dragging settings, the layer interaction, and other settings
Layers: Configure the data layer name and type, and the sorting between the data layers. The types of data layers include base layer, bubble layer, POI, and Geojson. The detailed configurations are given as follows:
Base Layer
Map Type: select the map display mode, for which electronic maps and satellite maps are supported
Automatic Refresh: refresh the tile POI information, which may not be required
Mask Color: (non-current feature)
Mask Configuration: (non-current feature)
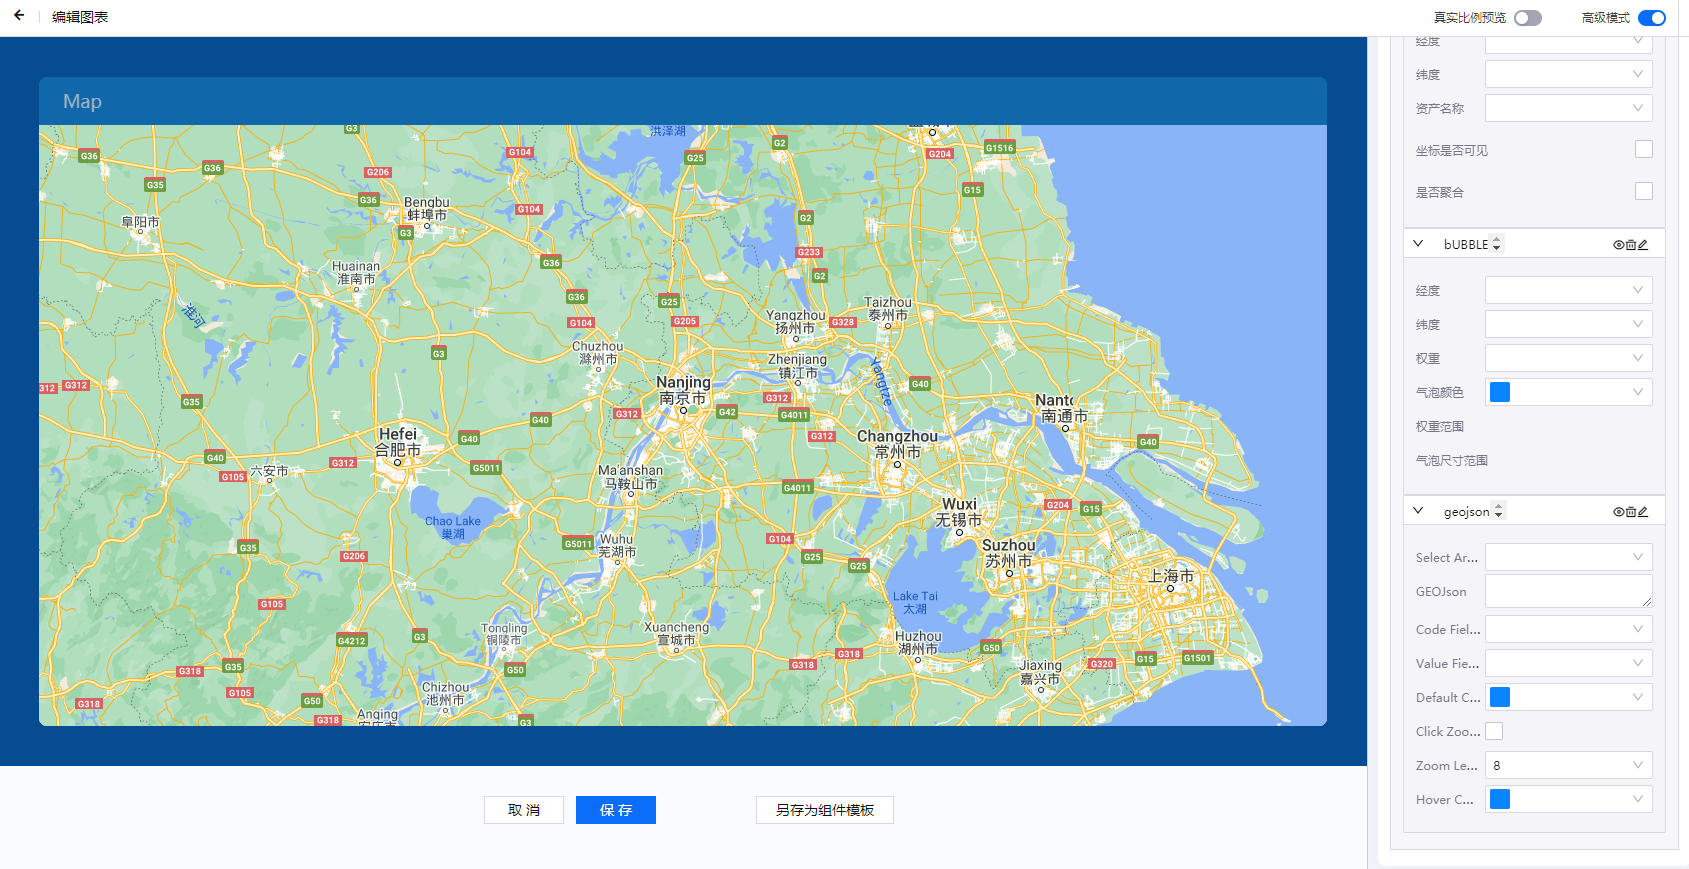
Bubble Layer
Configure latitude and longitude data fields, weight range, bubble color and size range
Longitude Selection: select the value of a field as the longitude
Weight Selection: select the value of a field as the weight
Weight range: the weight values corresponding to the maximum radius and the minimum radius respectively, converted according to the preceding ratio
Style Configuration:
Bubble Color
Maximum Radius: set the maximum display radius of the bubble on the map
Minimum Radius: set the minimum display radius of the bubble on the map
POI
Configure the data fields of latitude & longitude and asset name, whether the coordinates are visible, and whether the coordinates are aggregated. Asset Name Selection: select the value of a field and display it as the asset name.
Longitude Selection: select the value of a field as the longitude
Latitude Selection: select the value of a field as the latitude
Icon Uploading: upload a user-defined icon (.gif allowed), which will not taken as the default icon
Style Configuration: size
Interactive Configuration:
Clicking Information Selection: You can select the display information after clicking, including asset name, latitude and longitude, picture (not-current feature), and link for details
Link Configuration: select the value of a certain dimension as the condition of linking to trigger the linking of a field of other widgets
Geojson
Configure region, code, code field, value field, value color, whether to zoom, zooming level, and hover guide color
Region Selection: You can select the default region boundary provided by the DTV. Once it is selected, the Geojson input box will show the corresponding boundary information, which cannot be modified. When switching to the Region Data Provision mode, the original default data is retained, and the user can modify accordingly and provide customization data.
Region Code Selection: select the value of a field as the key mapped to the region; see “area_id”.
Weight Selection: selects the value of a field as the value mapped to the region; see “value”.
Condition (to be chosen alternatively with the Filling Configuration): map the Weight to the corresponding color interval through conditional filtering.
Labeling Configuration: the color of the words covered on the region, such as the border lines of provinces and cities, the color of the region border, and the thickness setting.