Mix Chart
The mix chart widget is generally used to display the changes in data over a period of time or the comparative relationship between groups of data. The mix chart supports presenting data in bar chart, target chart, scatter chart, area chart and line chart. The mix chart widget supports the widget link function, and the data that needs to be displayed can be filtered by configuring a global filter.
The configuration items of the mix chart widget mainly include Basic Settings, Data Items, and Chart Style.
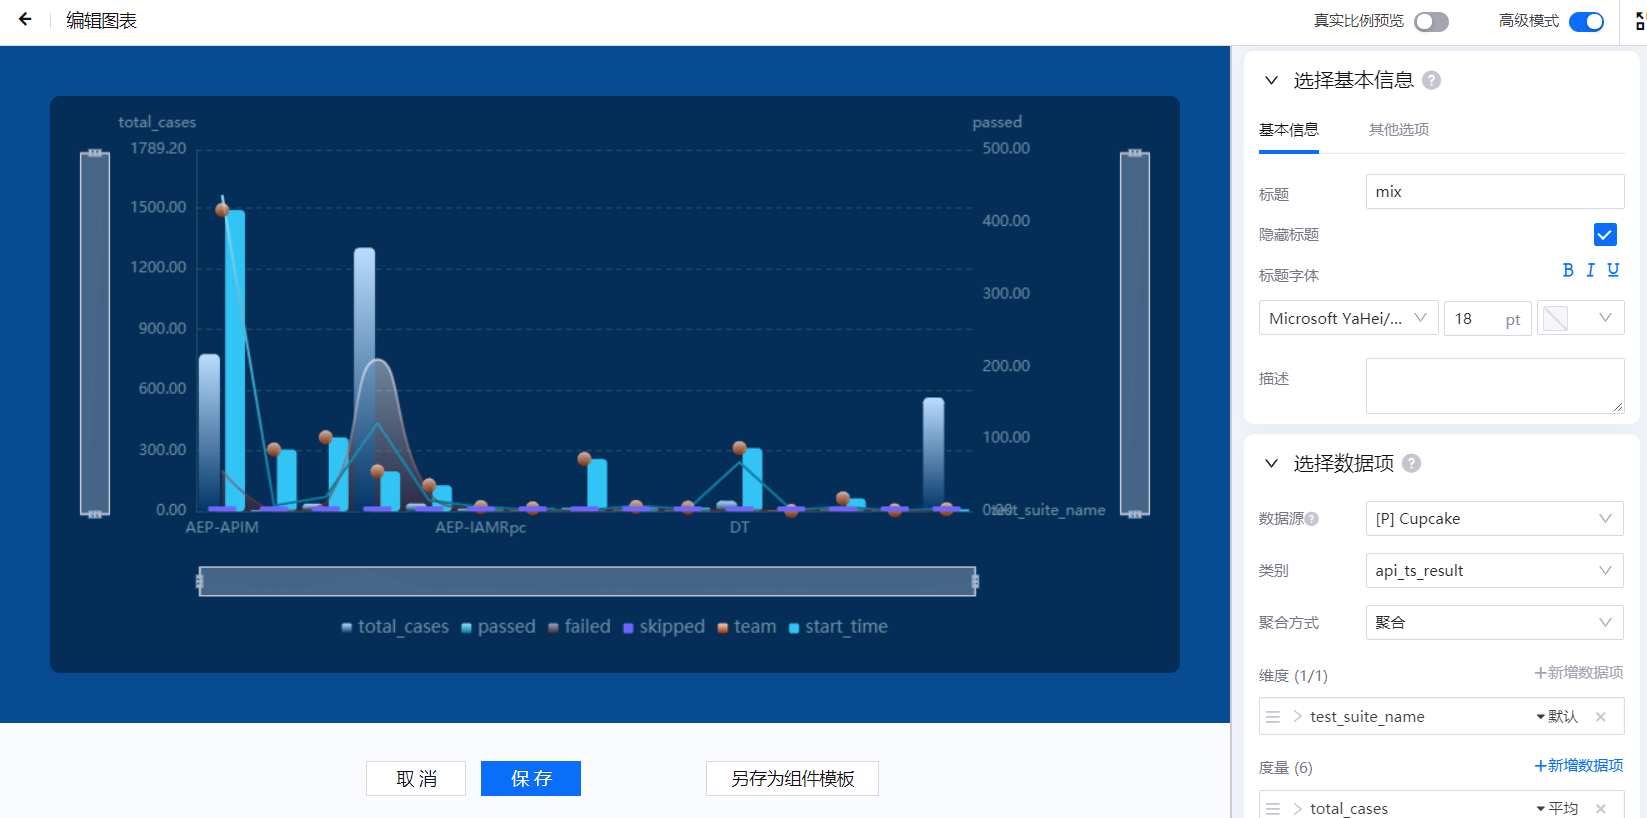
Basic Settings
In the Basic Settings section, provide the following basic information of the mix chart:
Basic Information: Enter the title and description of the mix chart, and configure the title font and whether to hide the title
Other Options: select the data refresh frequency, and configure the grid position and the background color of the mix chart
Data Item Configuration
In the Data section, add the data that needs to be displayed in the mix chart:
Data Source: Select the added data source
Category: Select the model of the data item according to the selected data source
Aggregation: Select whether to aggregate the data
Parameters: Configure various parameters according to the selected data source and category
Dimension and Measurement: Select a combination of dimensions and measurements in the data set. The chart will dynamically display the acquired data according to the selected combination.
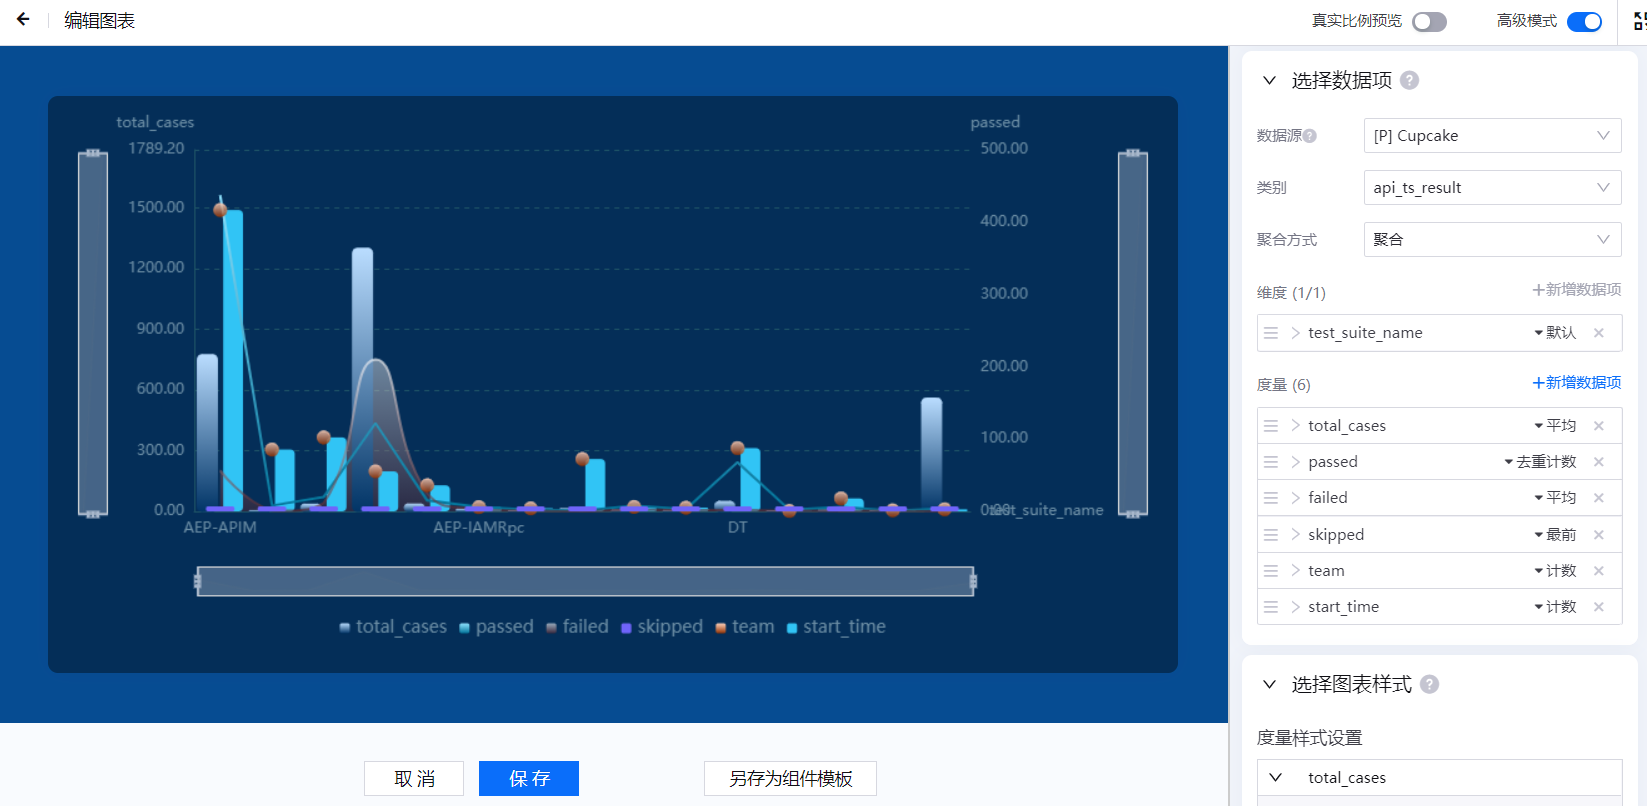
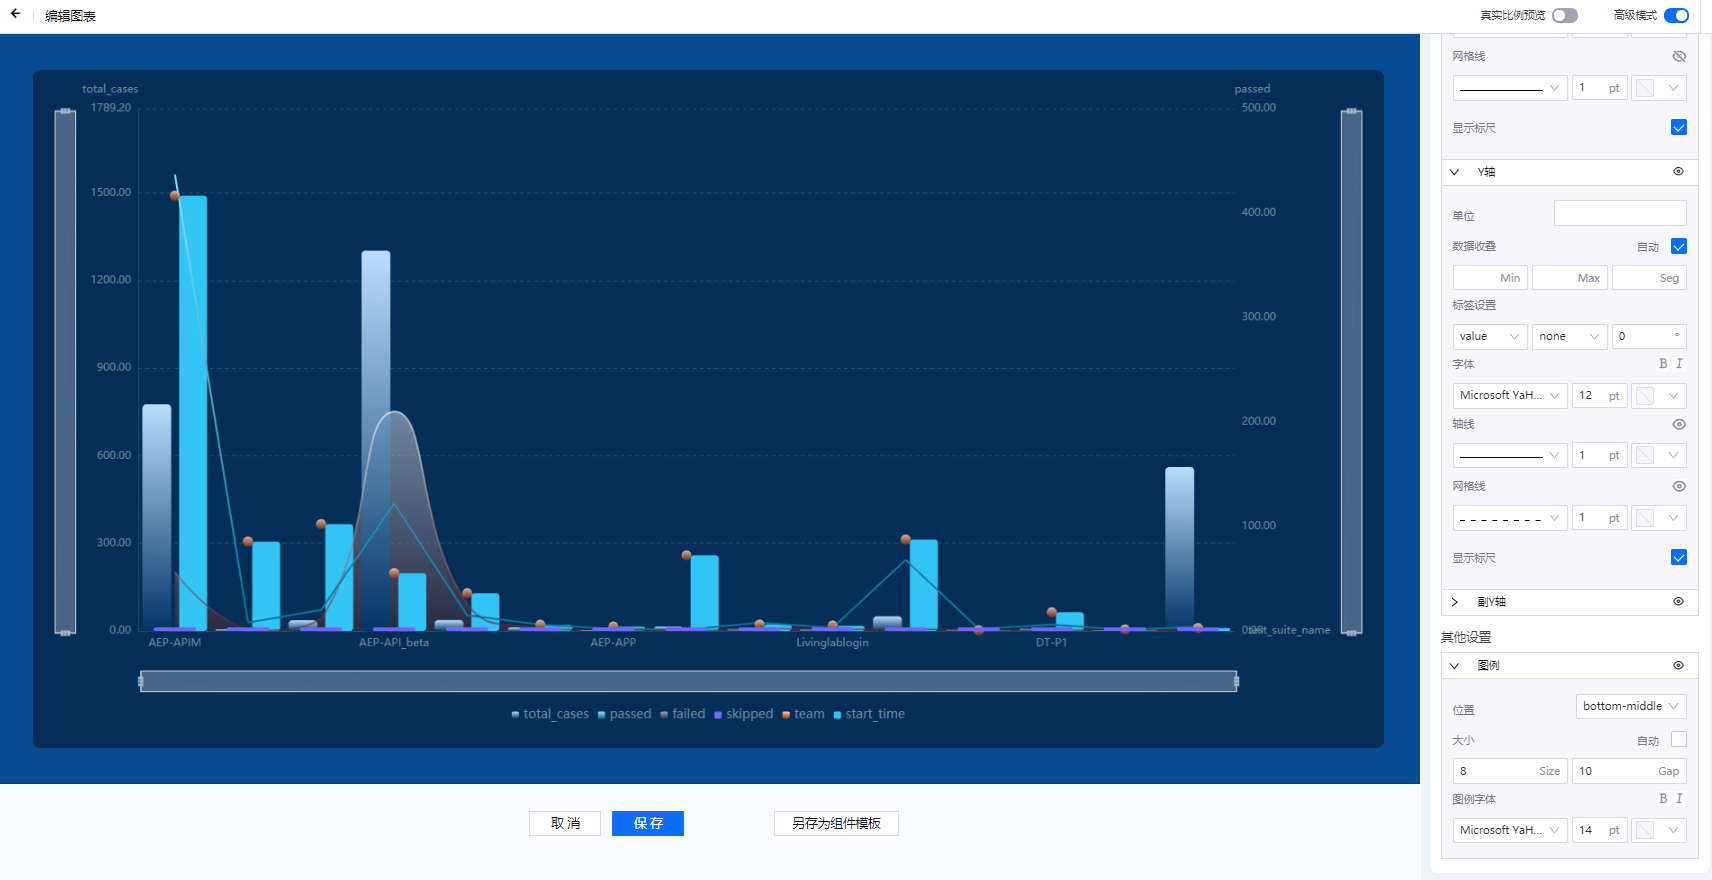
Chart Style Configuration
In the Chart Style section, configure the measurement style, axis style, and other settings of the mix chart.
Set Measurement Style: Configure the measurement, including: whether to match the secondary axis Y, the display modes of charts (including line chart, bar charts, area charts, target charts and scatter charts), and the display color.
Set Axis Style: Configure the properties of primary and secondary axes, including: value unit, data clipping, tag type, font format, axis lines, grid lines, whether to display the scalar bar.
Other Settings: Configure the legend style, including the display position, size, interval and font format of the legend.