Meter
The meter widget is generally used to show the completion rate of the measurements. In practice, it is often used to show ratiometric indicators such as the budget completion rate. In the meter widget, the data that needs to be displayed can be filtered by configuring a global filter.
The configuration items of the meter widget mainly include Basic Settings, Data Items, and Chart Style.
Basic Settings
In the Basic Settings section, provide the following basic information of the meter:
Basic Information: Enter the title and description of the meter, and configure the title font and whether to hide the title
Other Options: Select the data refresh frequency, and configure the grid position and the background color of the meter
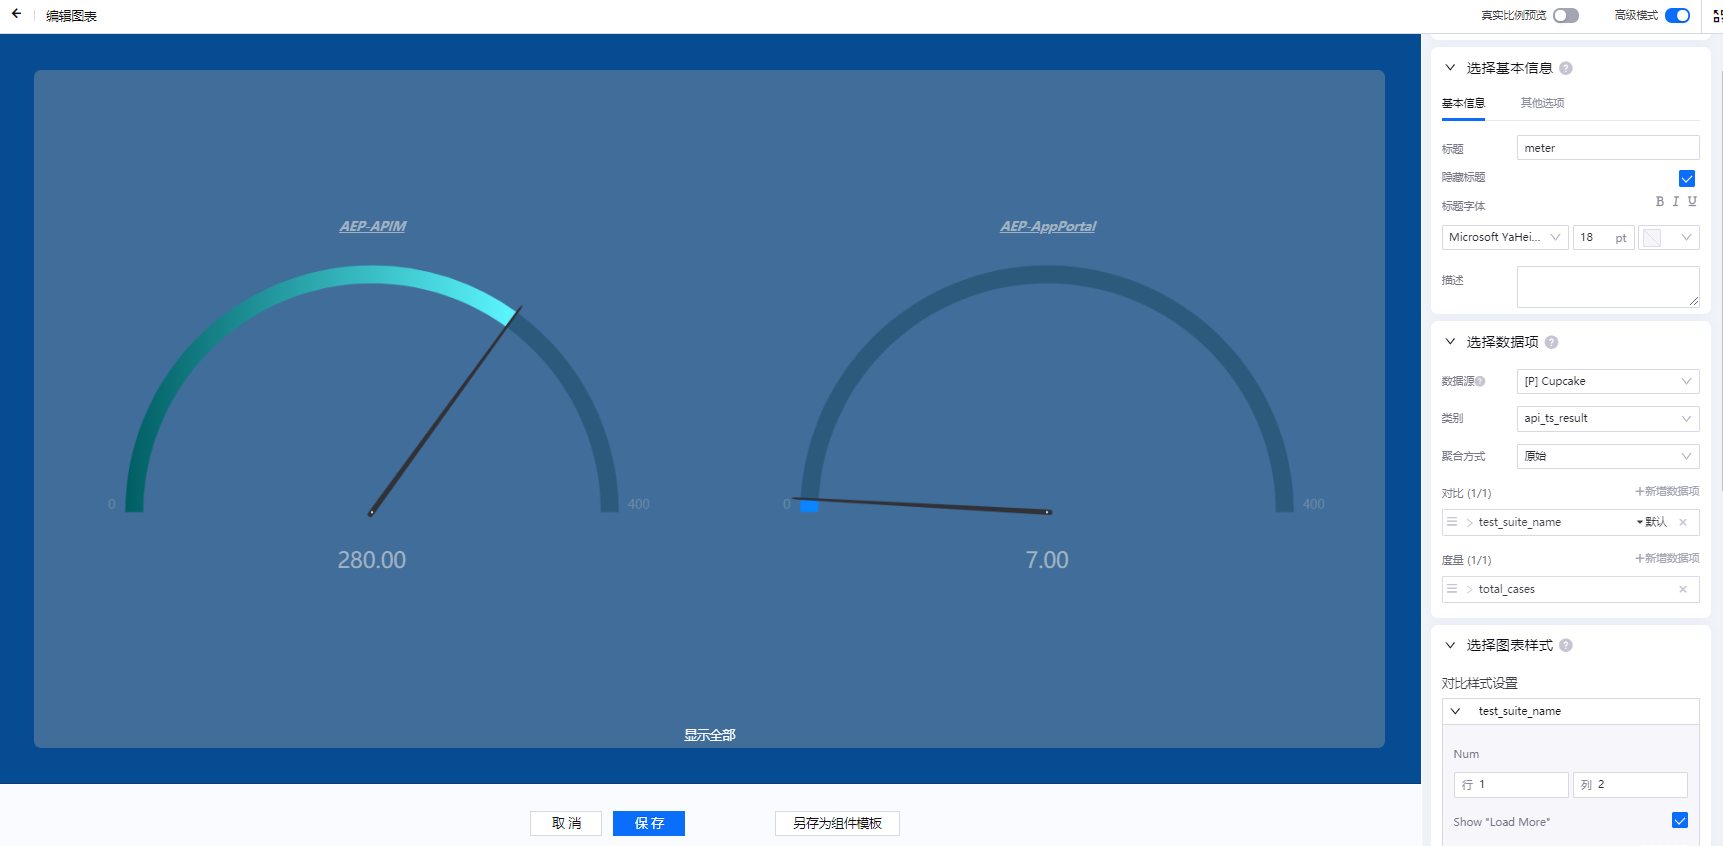
Data Item Configuration
In the Data section, add the data that needs to be displayed in the meter:
Data Source: Select the added data source
Category: Select the model of the data item according to the selected data source
Aggregation: select whether to aggregate the data
Parameters: Configure various parameters according to the selected data source and category
Comparison and Measurement: Select a combination of comparisons and measurements in the data set. The chart will dynamically display the acquired data according to the selected combination.
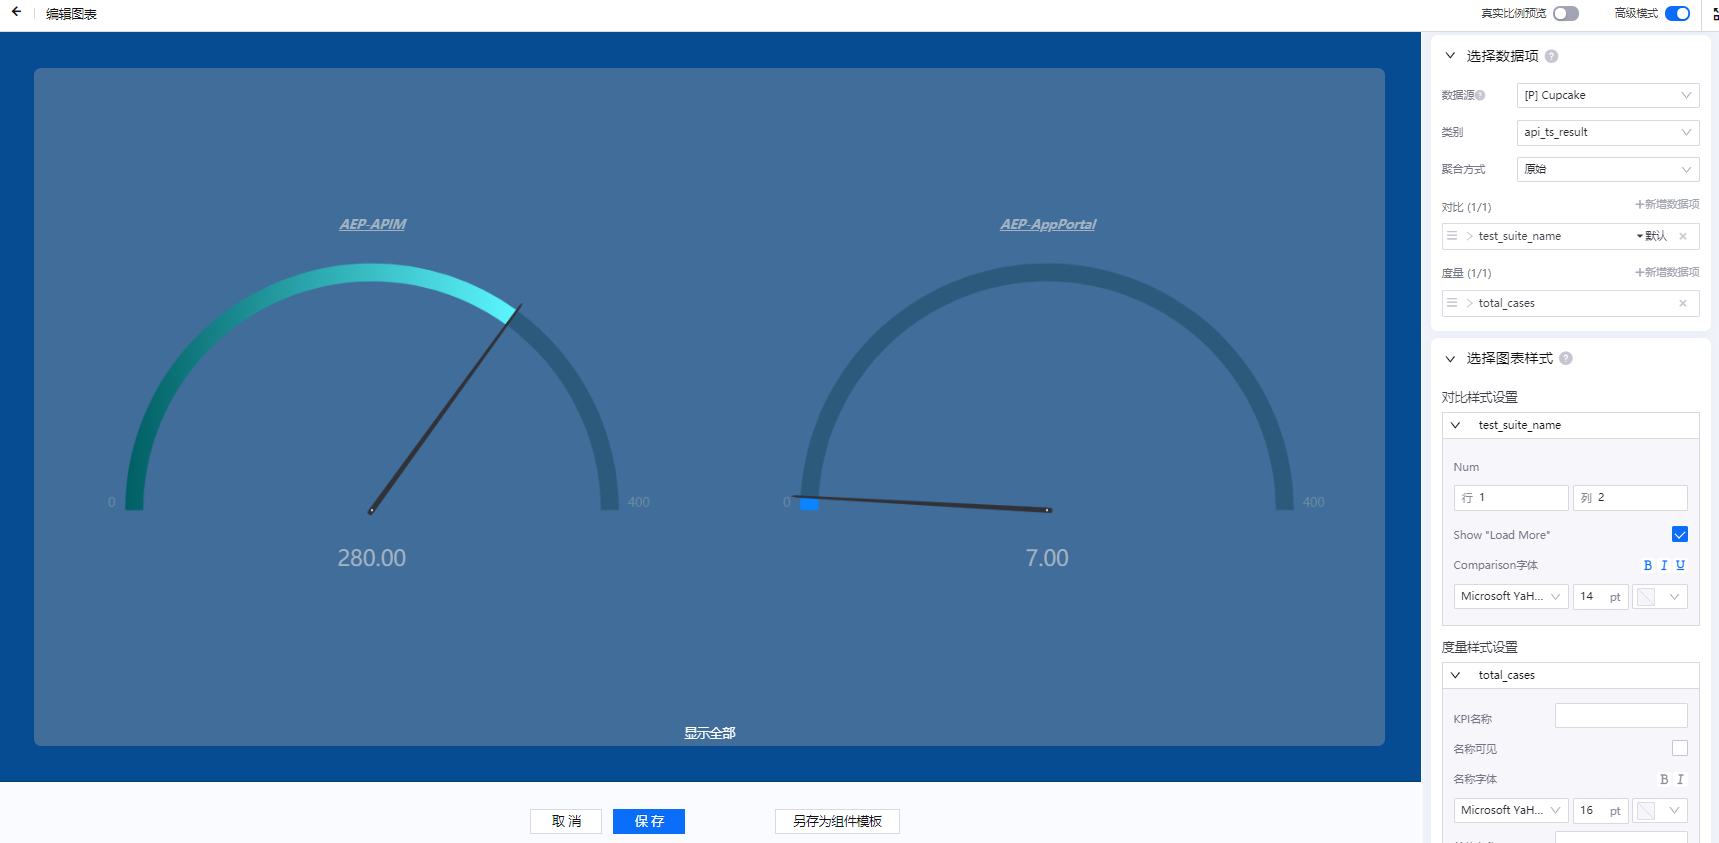
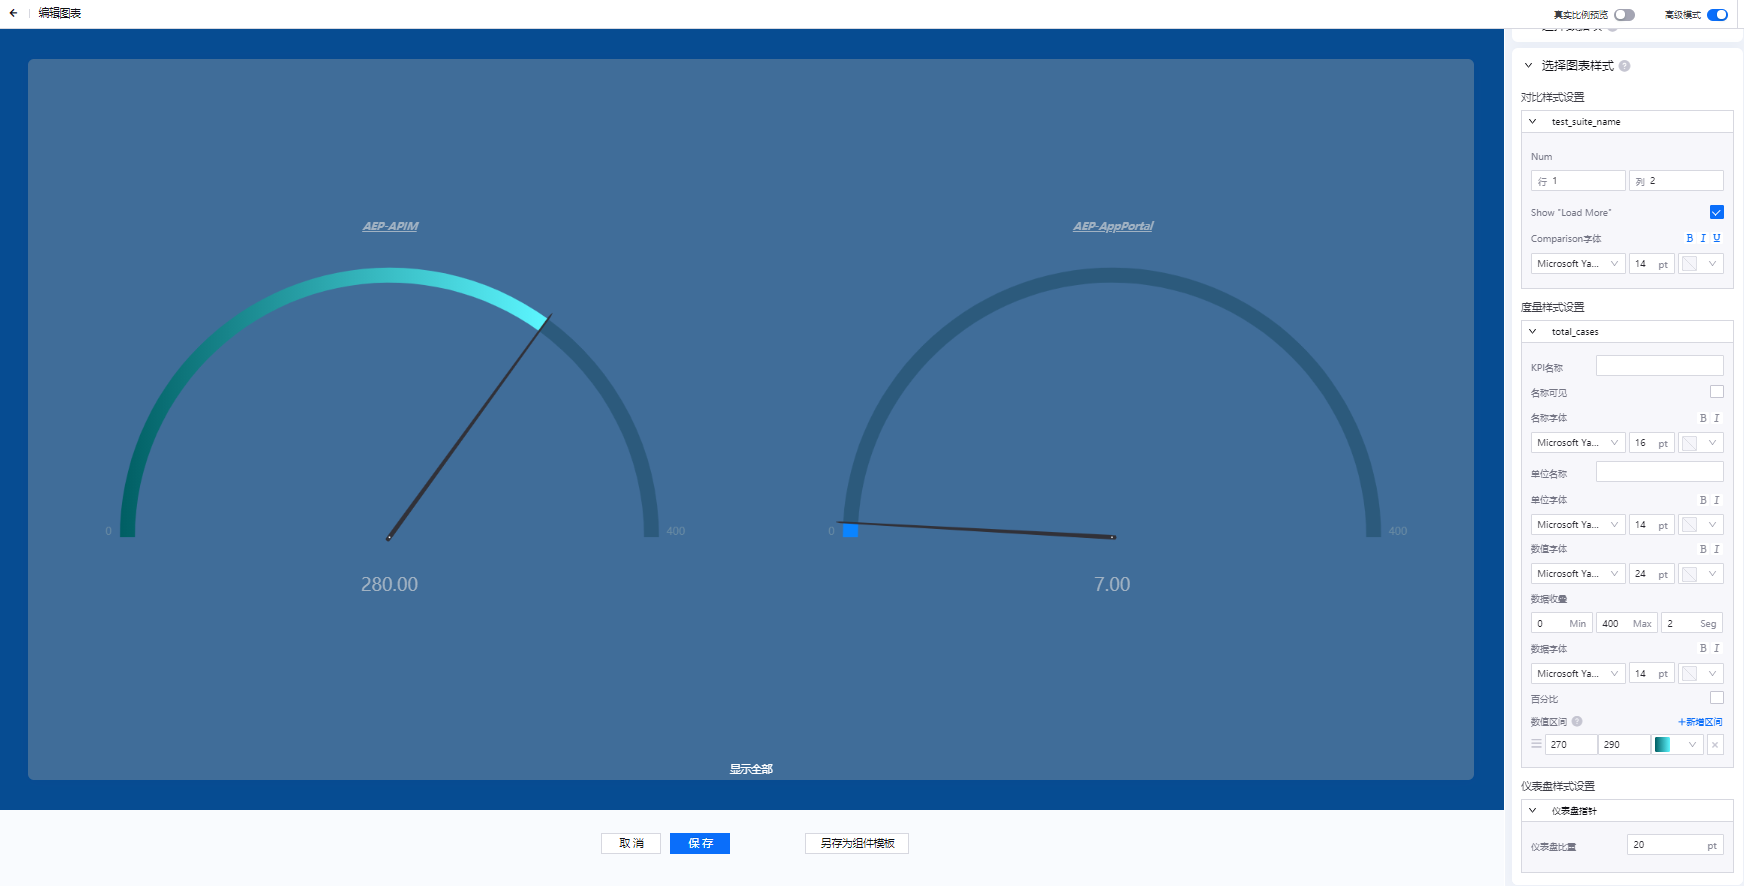
Chart Style Configuration
In the Chart Style section, configure the comparison style, measurement style, and style settings of the meter.
Set Comparison Style: Configure the number of comparison data to be displayed and whether to “Show All”
Set Measurement Style: configure KPI name and format, value unit name and format, value format, data clipping, value range, display color and other properties
Set Gauge Style: Configure the gauge weight.