Filtering Data
If you need to display the filtered data in the edited chart, you can define and use a global filter. The global filter currently supports category filtering and time range filtering.
Configuring Time Range Filter
The following steps shows how to configure a time range filter with a Mix Chart and Table Chart as example:
Open the created and edited page and click Global Filter in the toolbar.
On the global filter editing page, click Add Filter and complete the following configuration:
Filter Name: Type the name of the filter.
Key: Enter the unique identifier of the filter.
Attributes: Select the properties of the filter (whether to be displayed on the page, whether to accept external parameters).
Filter Type: Select the Time Range filter type.
Link Widget: Configure the time range filter parameters for each of the widget to which the global filter applies (configure the startTime and endTime parameters). See the following example:
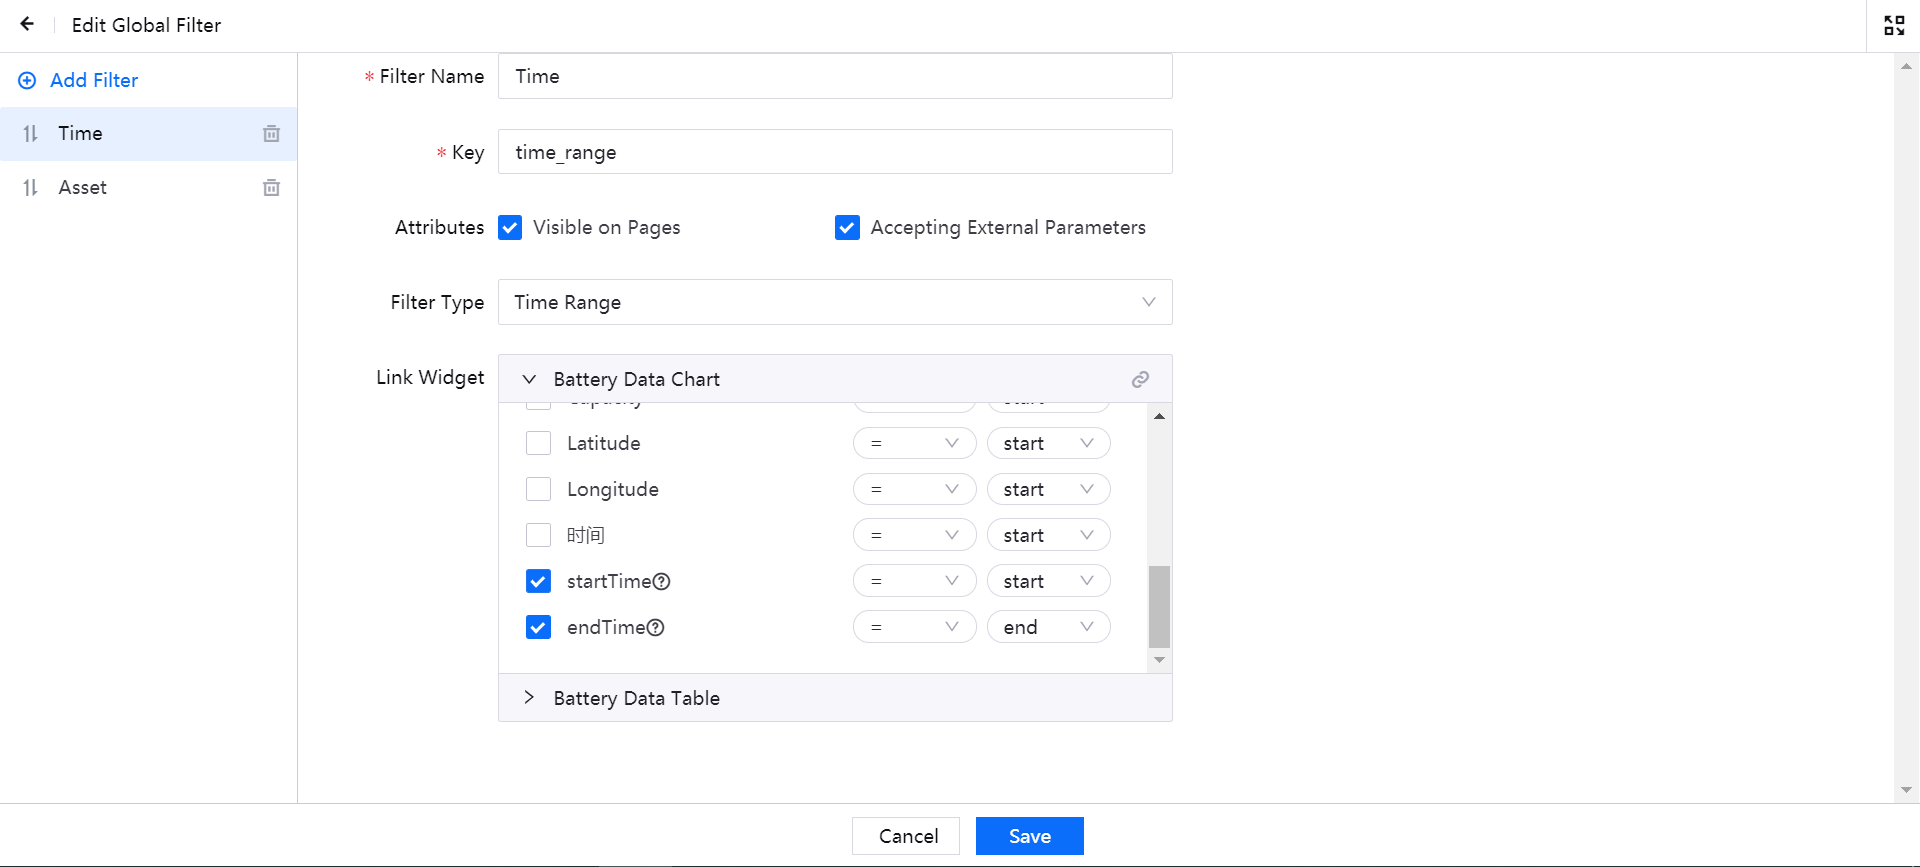
Click Save to complete the global filter configuration.
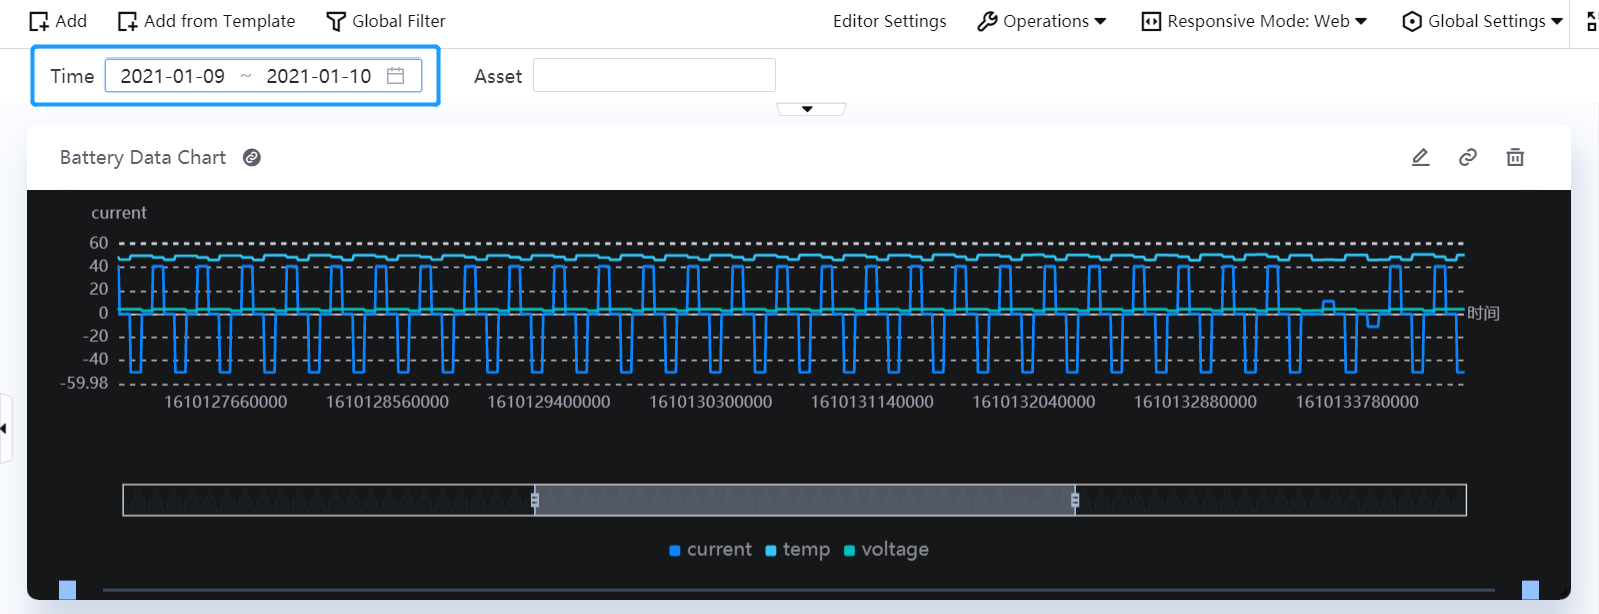
Return to the monitoring page and select the time range in the Time filter. The chart will display the filtered data accordingly.
Configuring Category Filter
The following steps shows how to configure a category filter with a Mix Chart and Table Chart as example:
Open the created and edited page and click Global Filter in the toolbar.
On the global filter editing page, click Add Filter and complete the following configuration:
Filter Name: Type the name of the filter.
Key: Enter the unique identifier of the filter.
Attributes: Select the properties of the filter (whether to be displayed on the page, whether to accept external parameters).
Filter Type: Select the Drop Down filter type.
Link Widget: Configure the filter parameters for each of the widget to which the global filter applies (select the Asset Name parameter for filtering data by the asset name). See the following example:
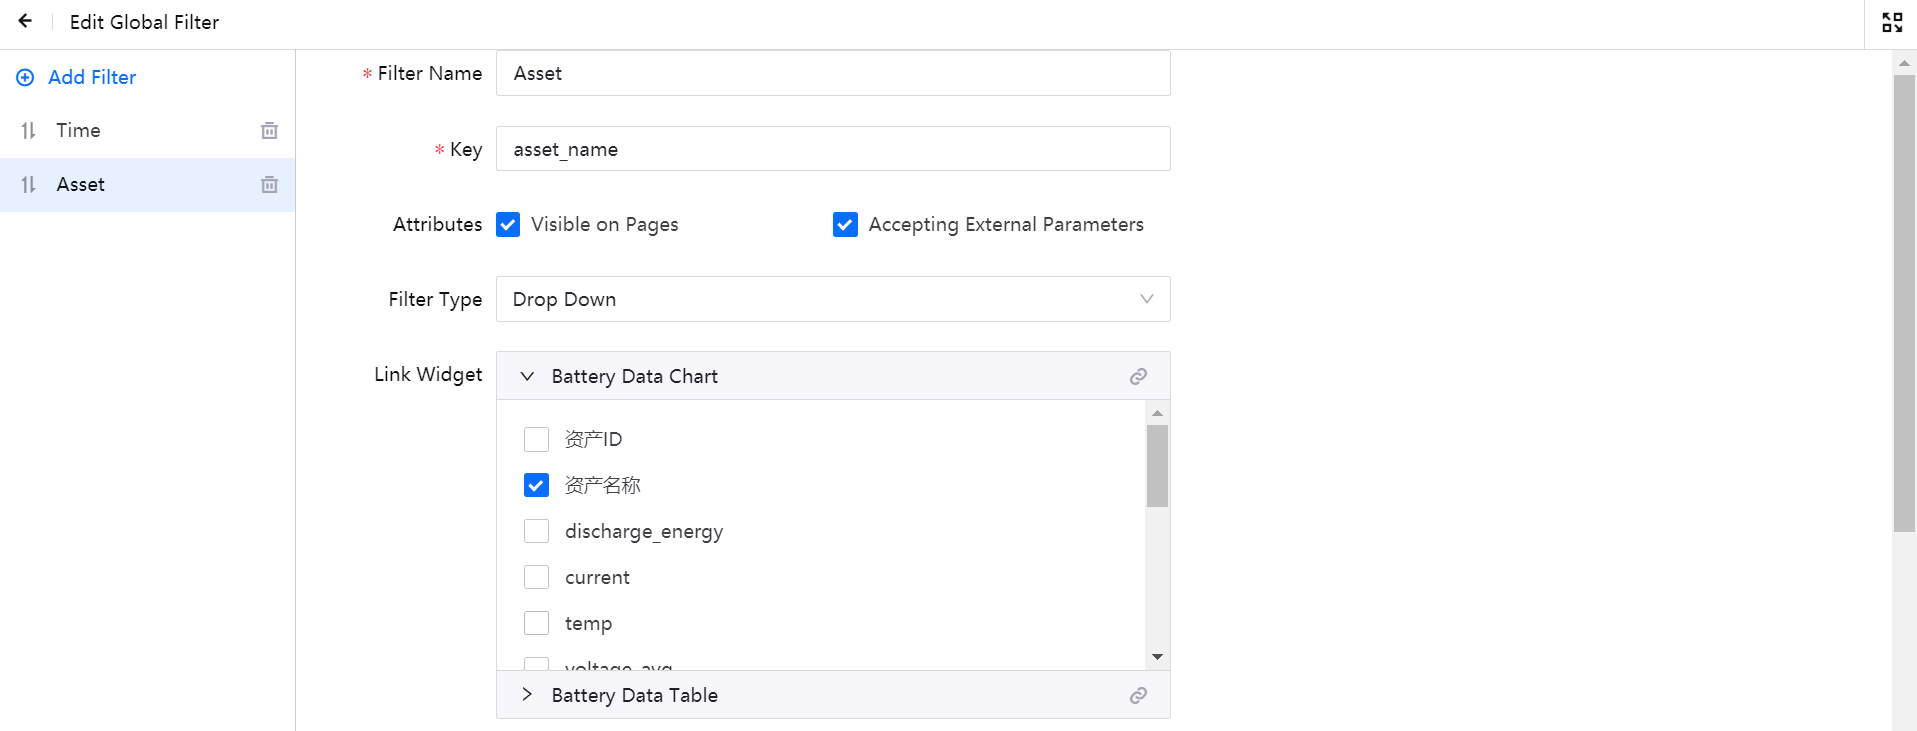
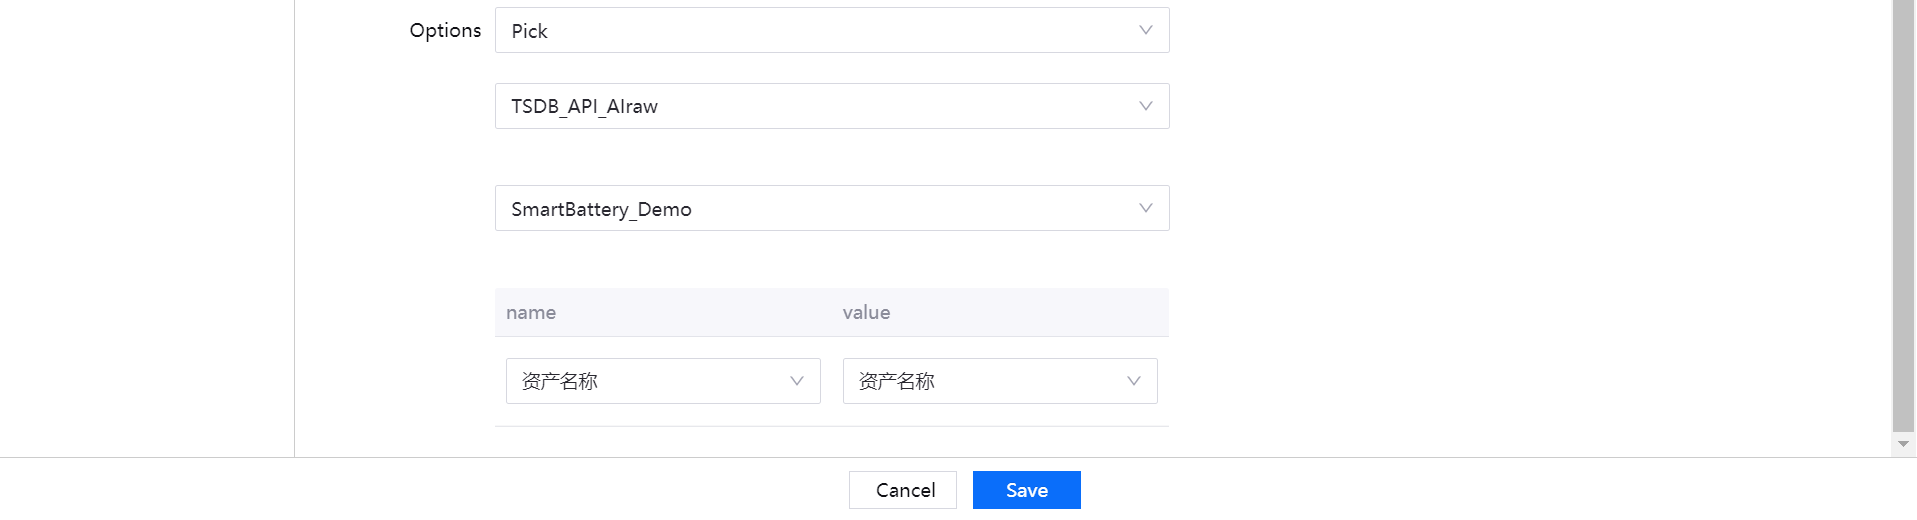
Click Save to complete the global filter configuration.
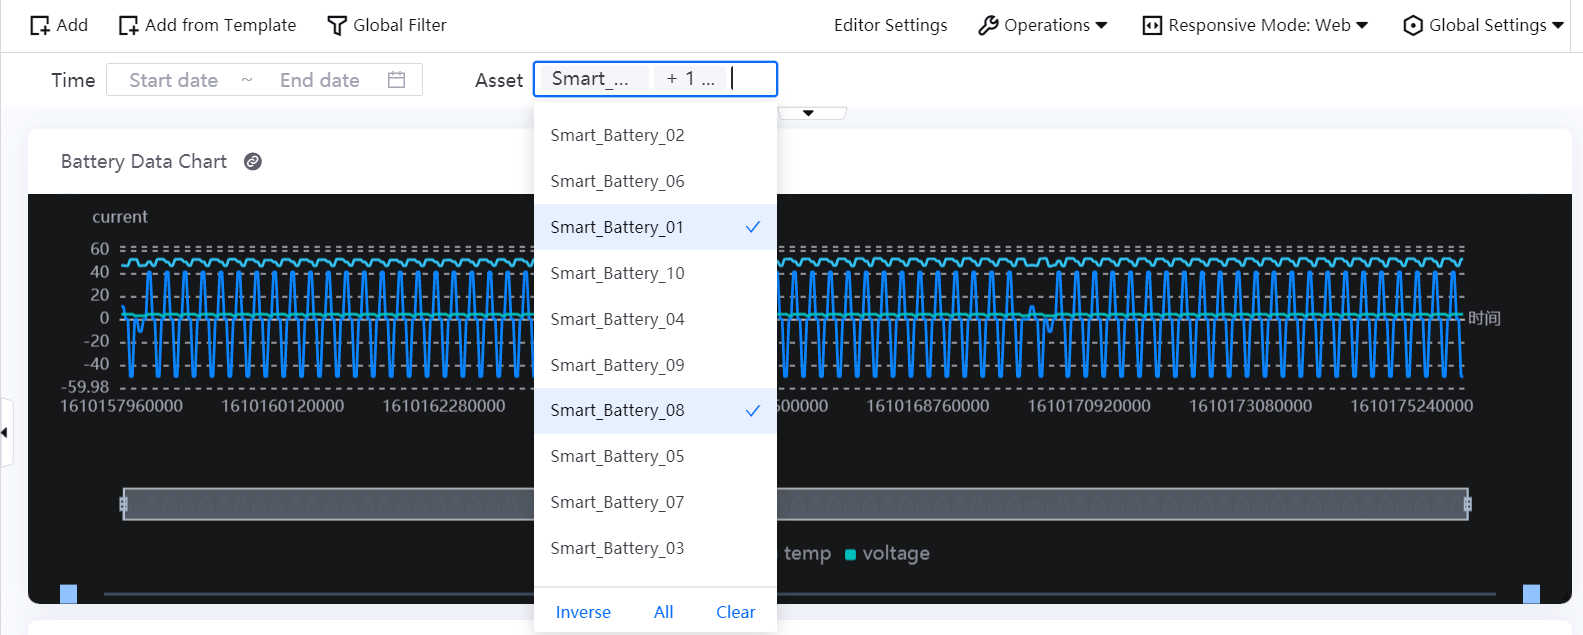
Return to the monitoring page and select asset names from the Asset filter field. The chart will display the filtered asset data accordingly.