Developing Data Visualization Pages
The data visualization page is a data dashboard with certain business logic that is formed by arranging multiple charts in accordance with certain business logic.
The DTV provides a set of rich widgets to help you display and analyze data in the most appropriate way. For more information about various charts, See Widget Reference.
Adding Charts
After creating a page, you can add and edit charts in the page by following these steps:
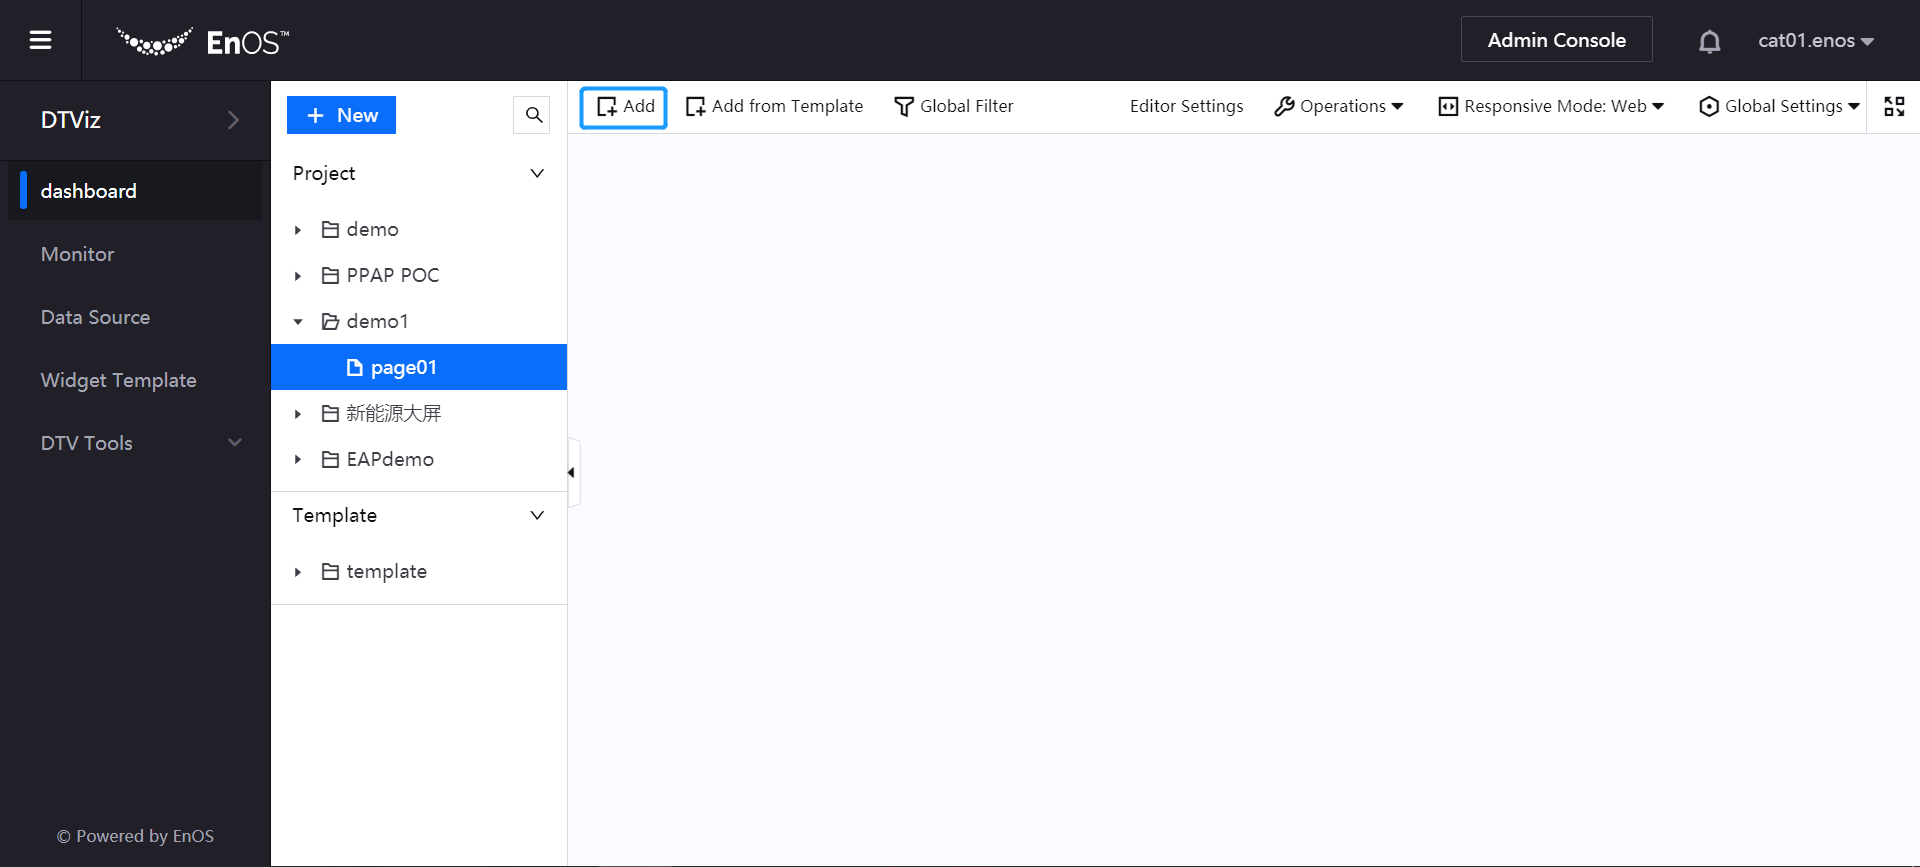
On the Dashboard page, select the created page. Click Add in the toolbar to open the page editor (or click Add from Template, select the editing page for the saved widget templates, the common widget templates, or the cross-organization public widget templates).
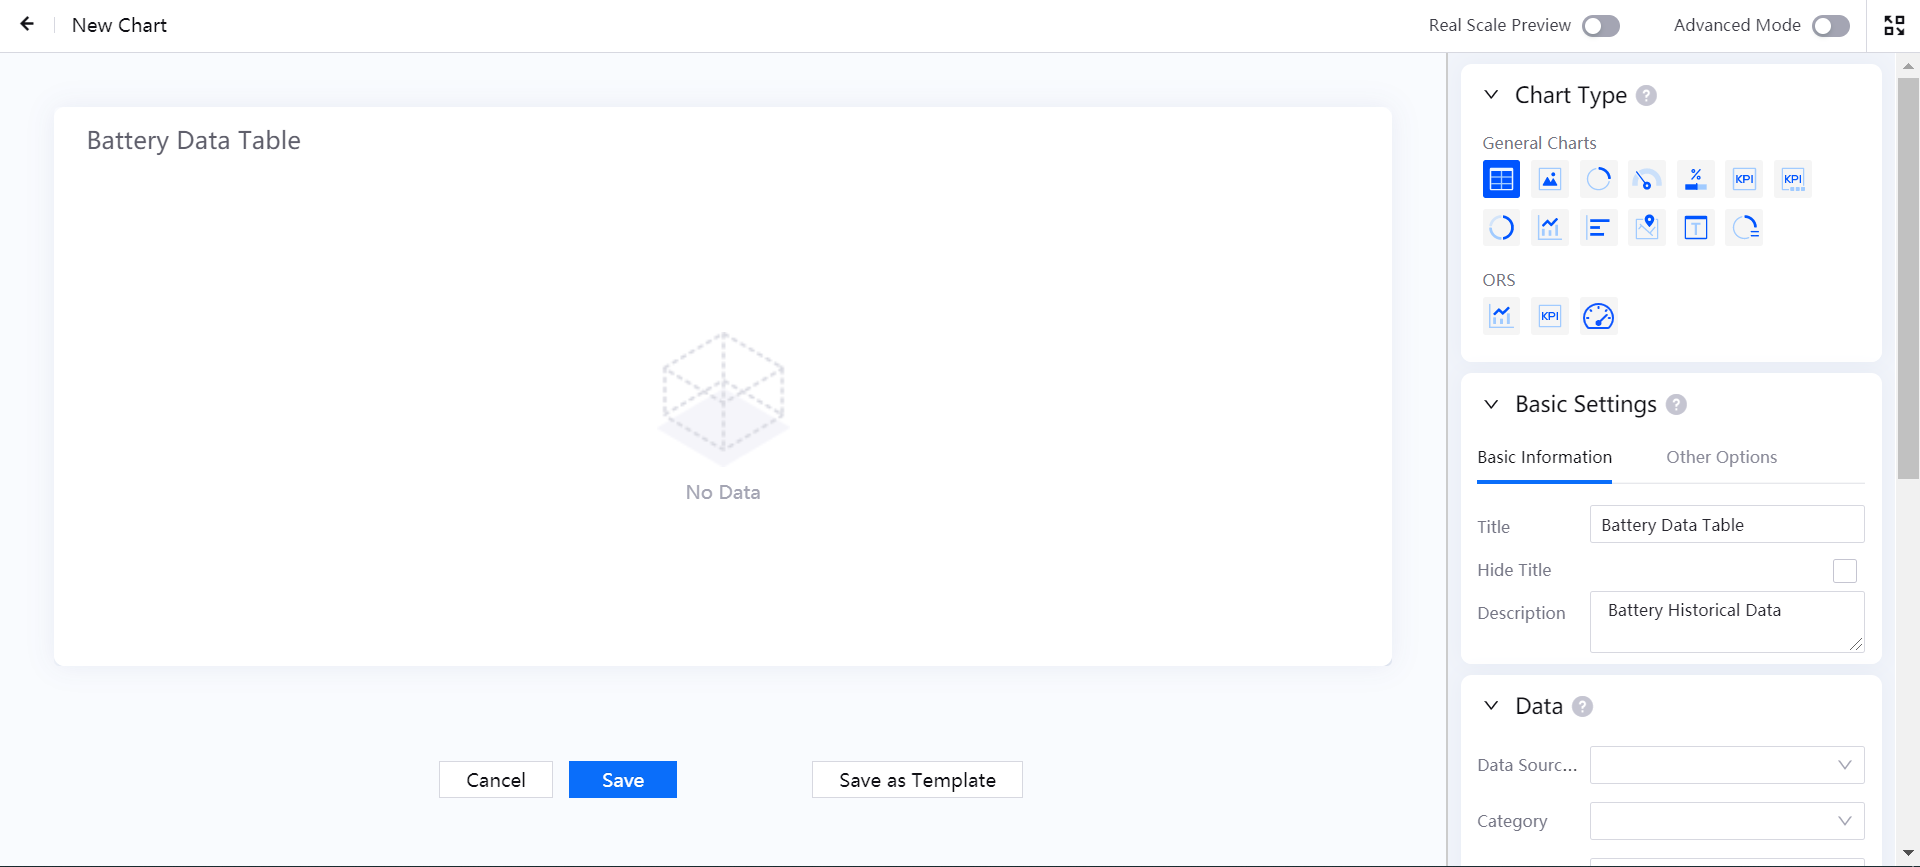
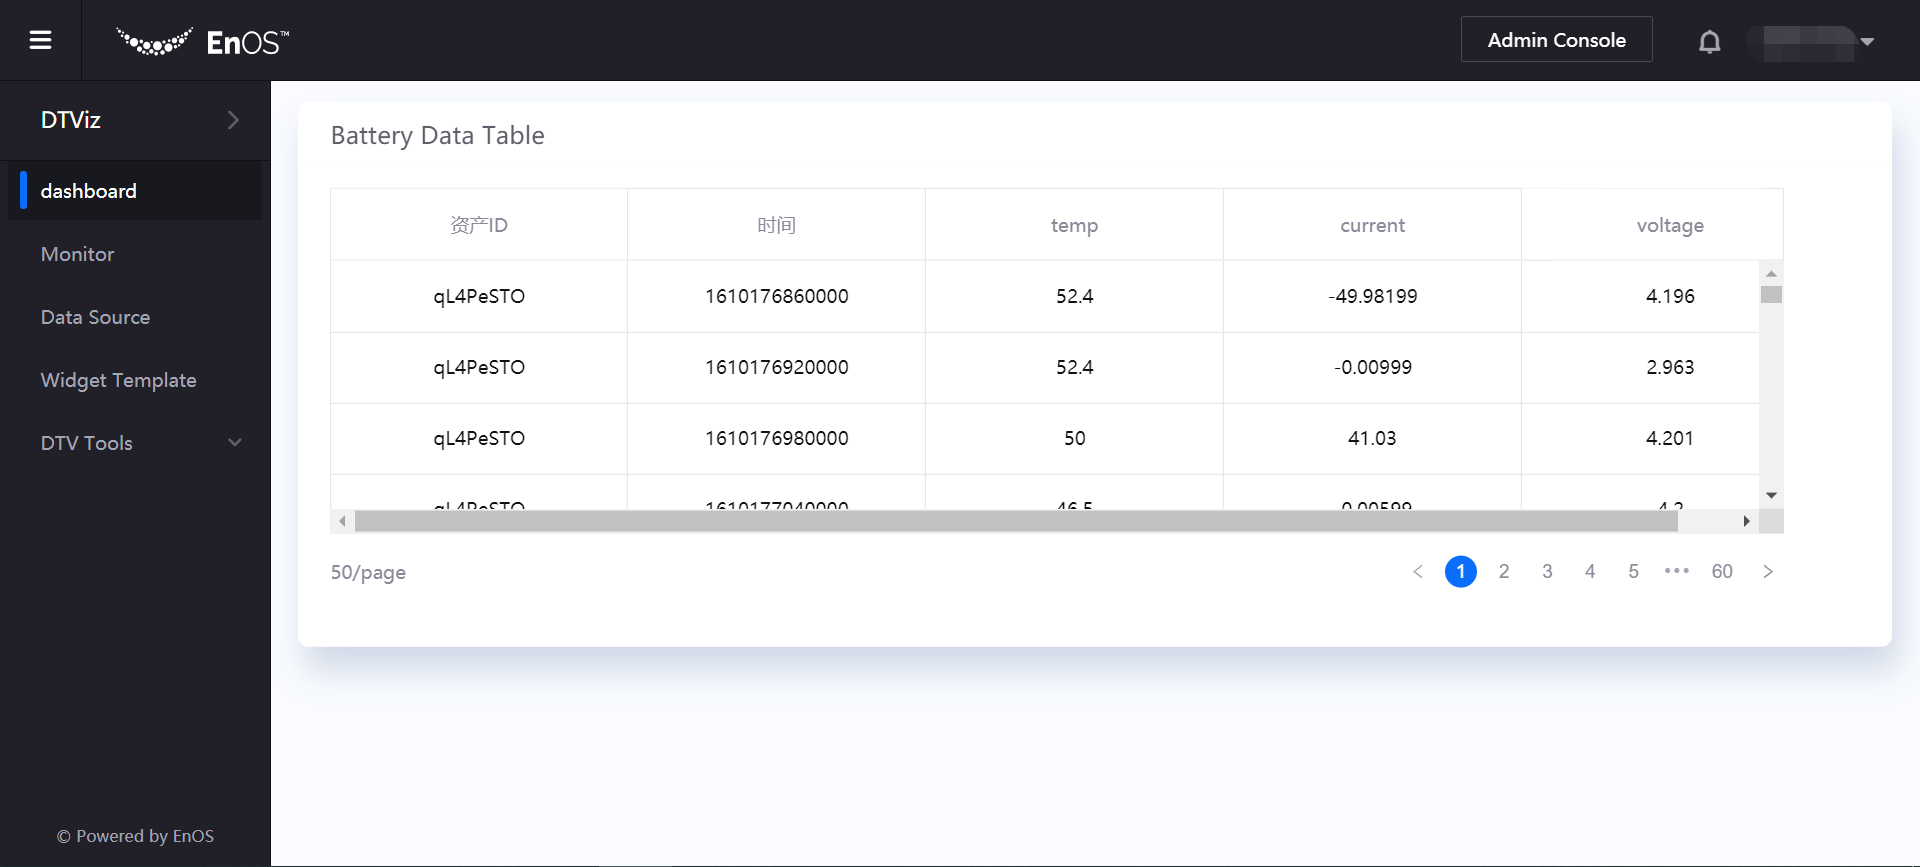
From the Chart Type section, select the chart you want to use (taking the Table chart as an example), and then complete the configuration of chart basic information, data binding, and chart style.
In the Basic Settings section, provide the following basic information of the chart:
Basic Information: Enter the title and description of the chart.
Other Options: Select data data refreshing frequency.
In the Data section, add the data source that needs to be displayed in the chart:
Data Source: Select the added data source.
Category: Select the category of the data item according to the selected data source.
Aggregation: Select whether to aggregate the data.
Parameters: Configure various parameters according to the selected data source and category.
Dimension, Comparison, Measurement: Select a combination of dimensions, comparisons, and measurements in the data set. The chart will dynamically display the acquired data according to the selected combination.
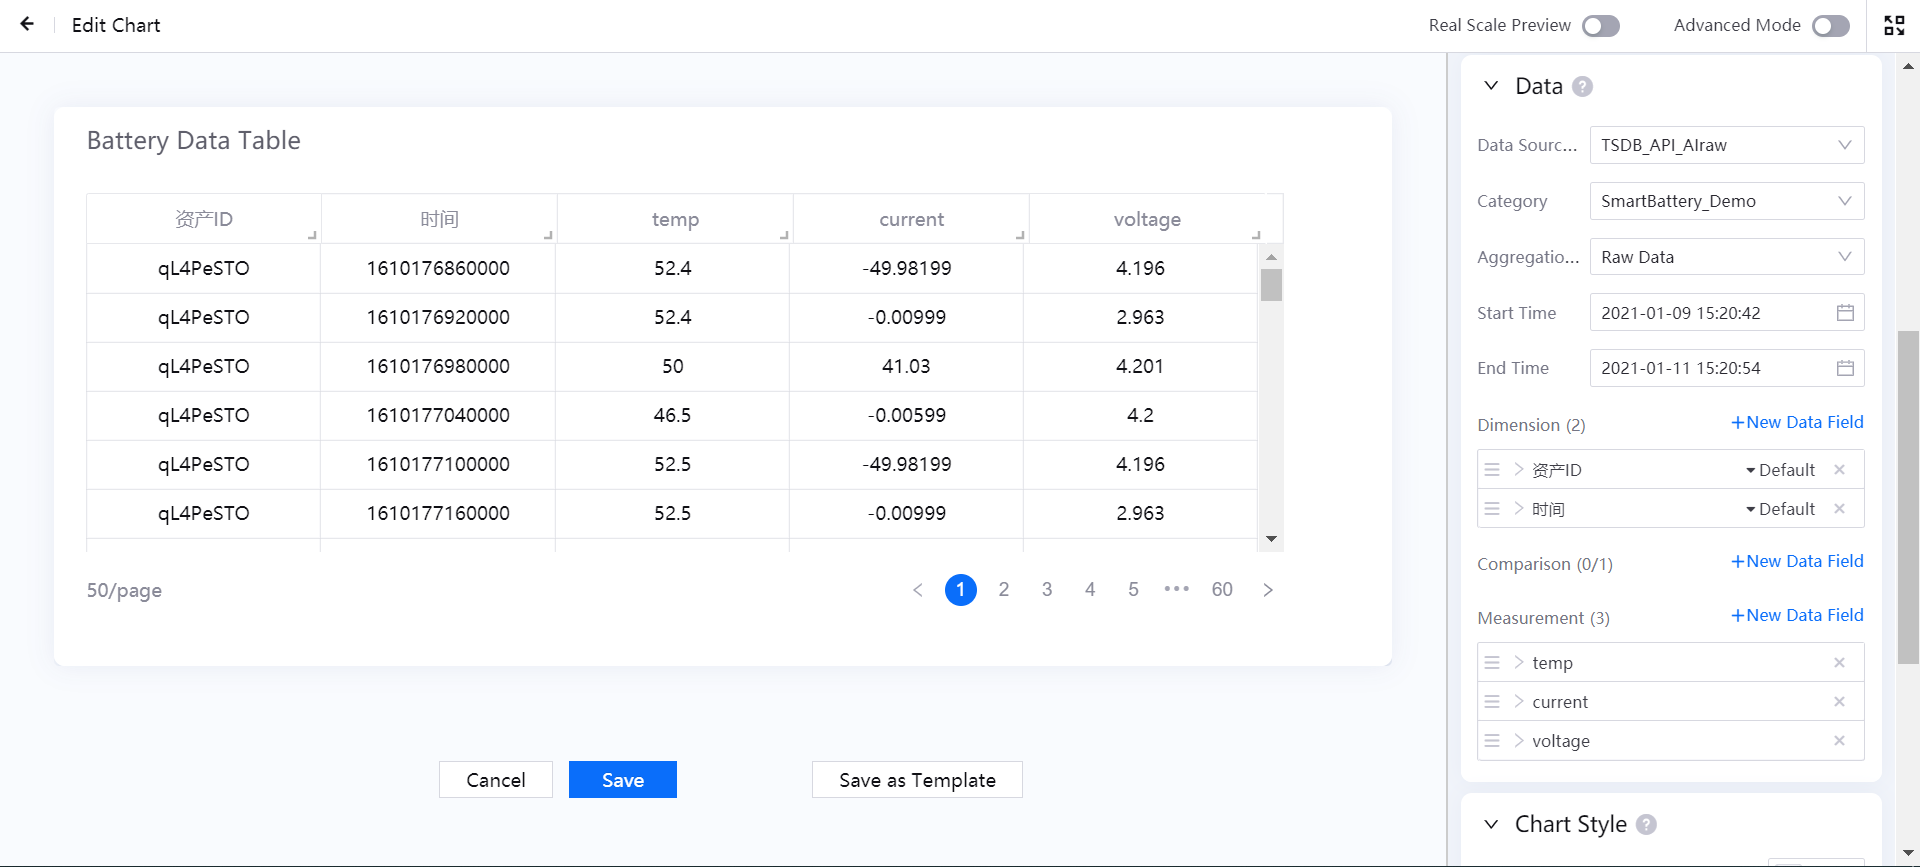
In the Chart Style column, configure the font, sorting and other properties of the chart.
Click Save to save the chart configuration (you can also click Save as Template to save the edited chart as a widget template for reuse.
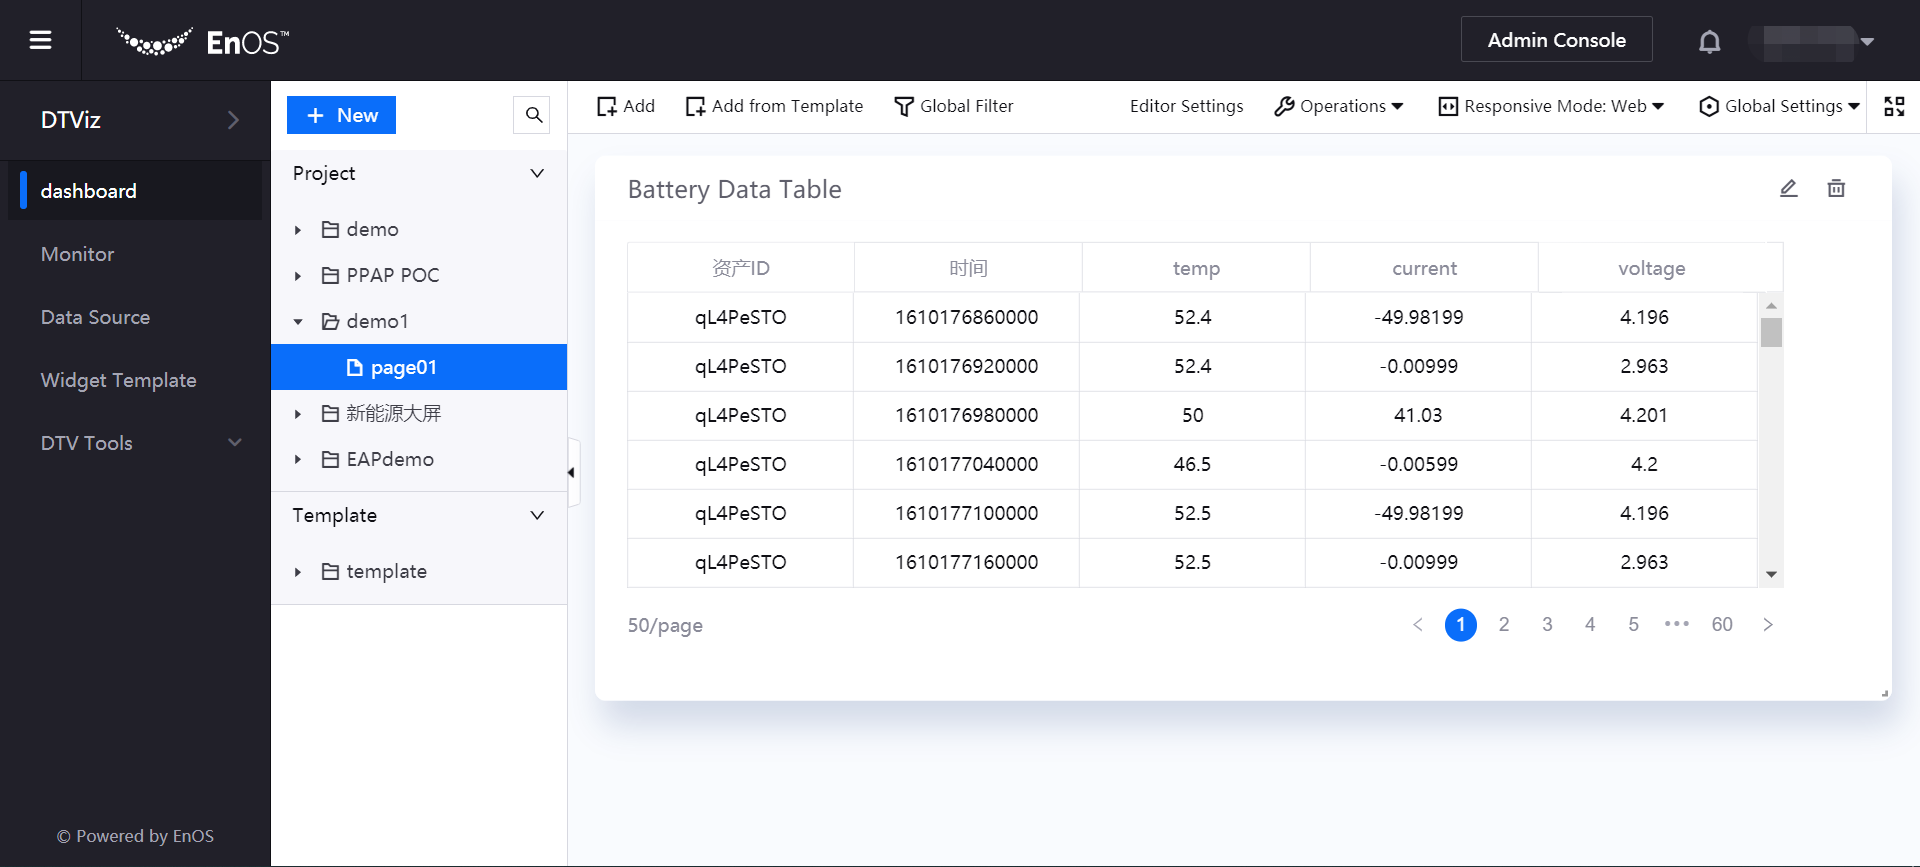
Return to the Dashboard page to view the chart display effect. Drag and drop the widget to adjust the page layout. When completed, select Operations > Save Layout in the toolbar to save the page layout.
Repeat the above steps to add more charts to the page.
Publishing the Page
After editing the monitoring page and previewing its display effect, you can publish the page online.
Open the edited page and click Operations > Preview in the toolbar to preview the display effect of the page.
If you need to edit the chart again, click the Edit icon in the upper right corner of the chart to edit the chart after returning to the page.
If the page is ready for publish, click Operations > Publish in the toolbar to publish the page online.
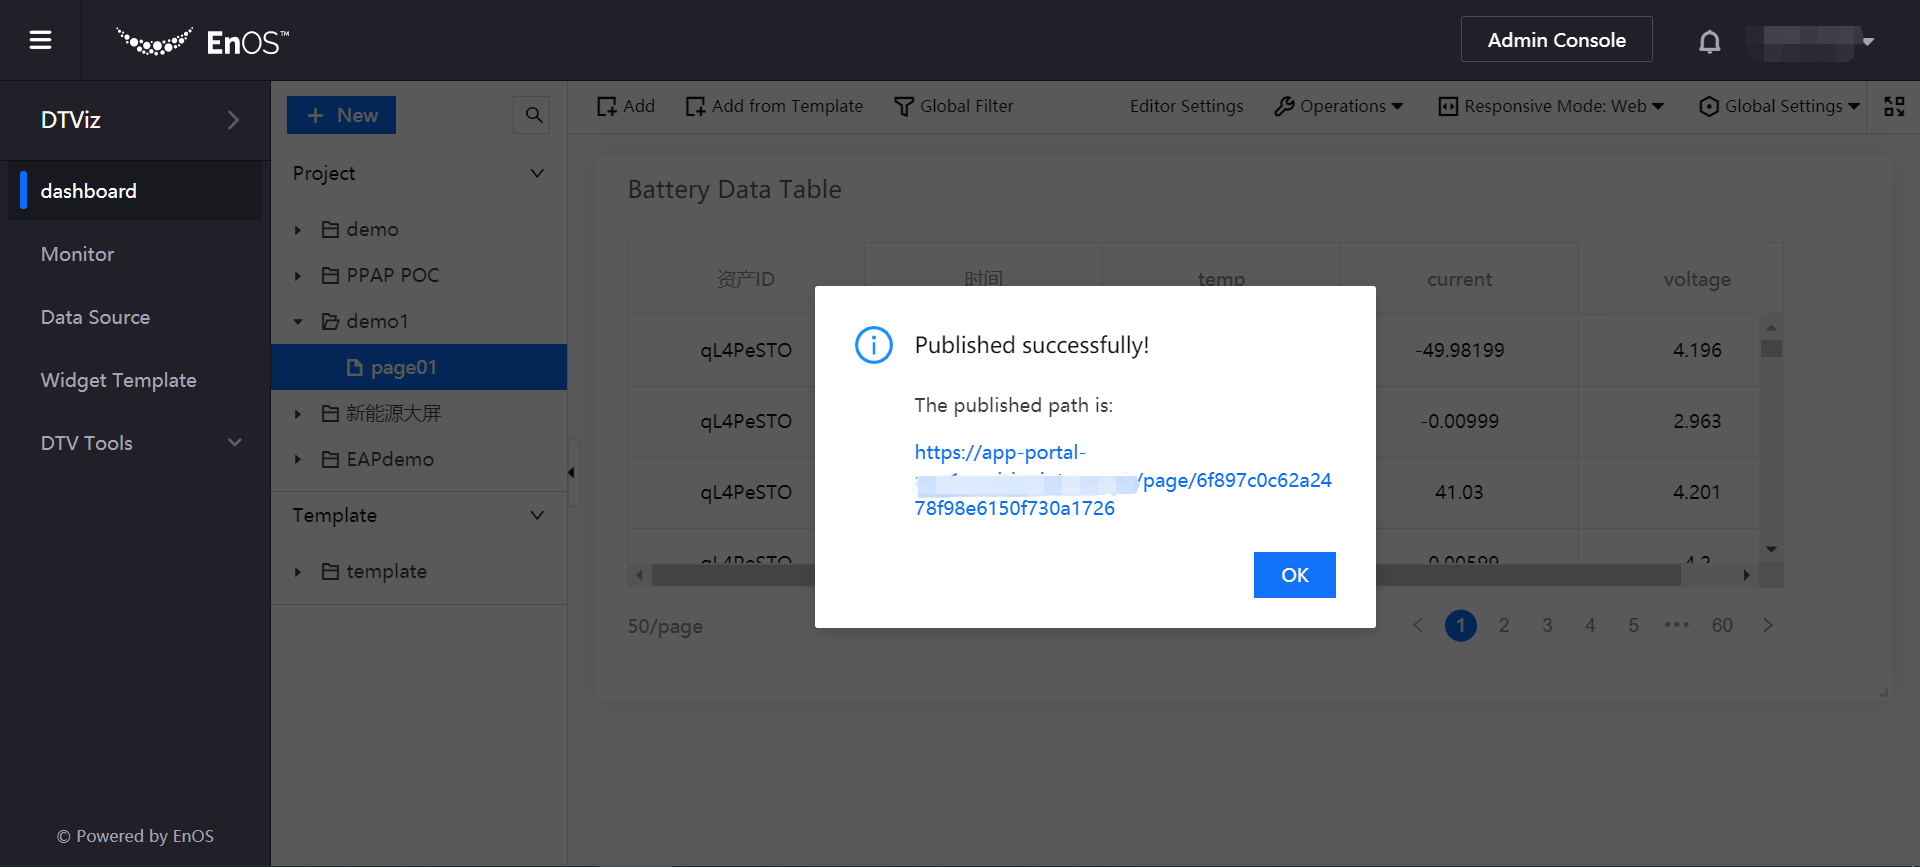
Copy the URL of the published page for use when integrating the page into applications.