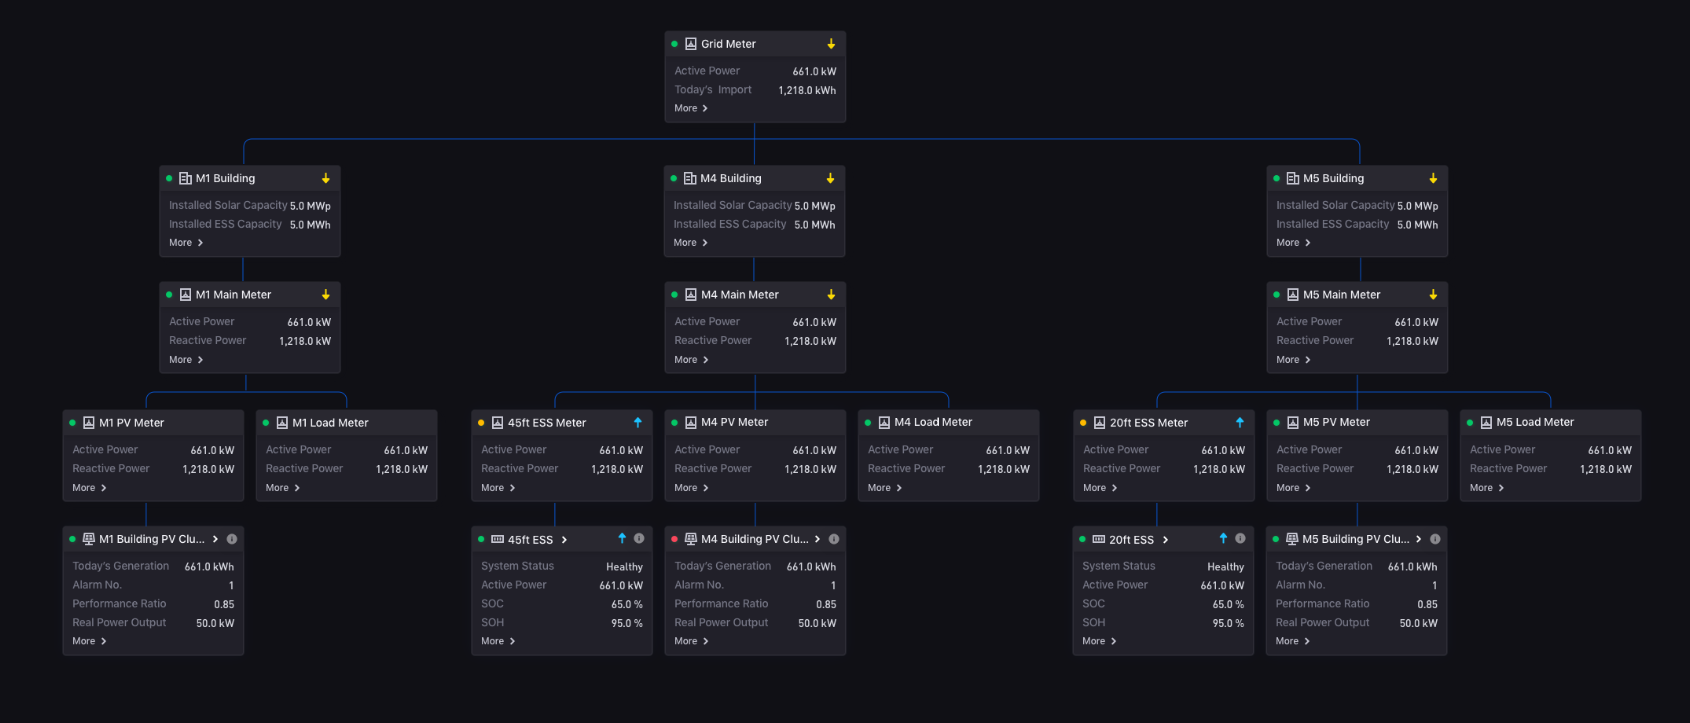
Topology
The Topology widget is used to display information in a hierarchical structure. It is generally used to monitor connected assets of a site.
Node
The most basic unit of Topology is called a node, which is displayed as a card.
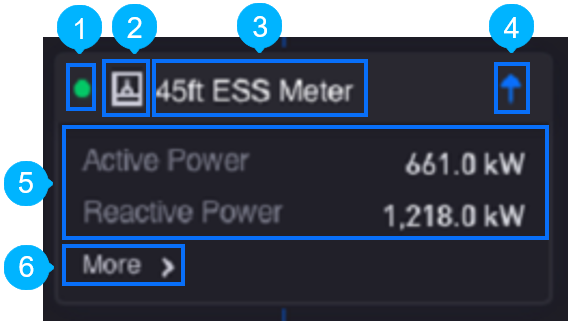
A node card can represent an asset and display the following elements for the asset.
No. |
Element |
Description |
|---|---|---|
|
Status |
Indicates the connection status of the asset. It shows a green dot if there is incoming data within 20 minutes. Otherwise, a grey dot is shown. |
|
Icon |
Represents the type of component |
|
Title |
Shows the name of the component |
|
Current Flow |
Indicates the direction of electrical current. An up arrow indicates current flowing into the asset, while a down arrow indicates current flowing out of the asset. |
|
Content |
Shows a list of measurement point values |
|
More Information |
Displays additional data values in a separate dialog box. |


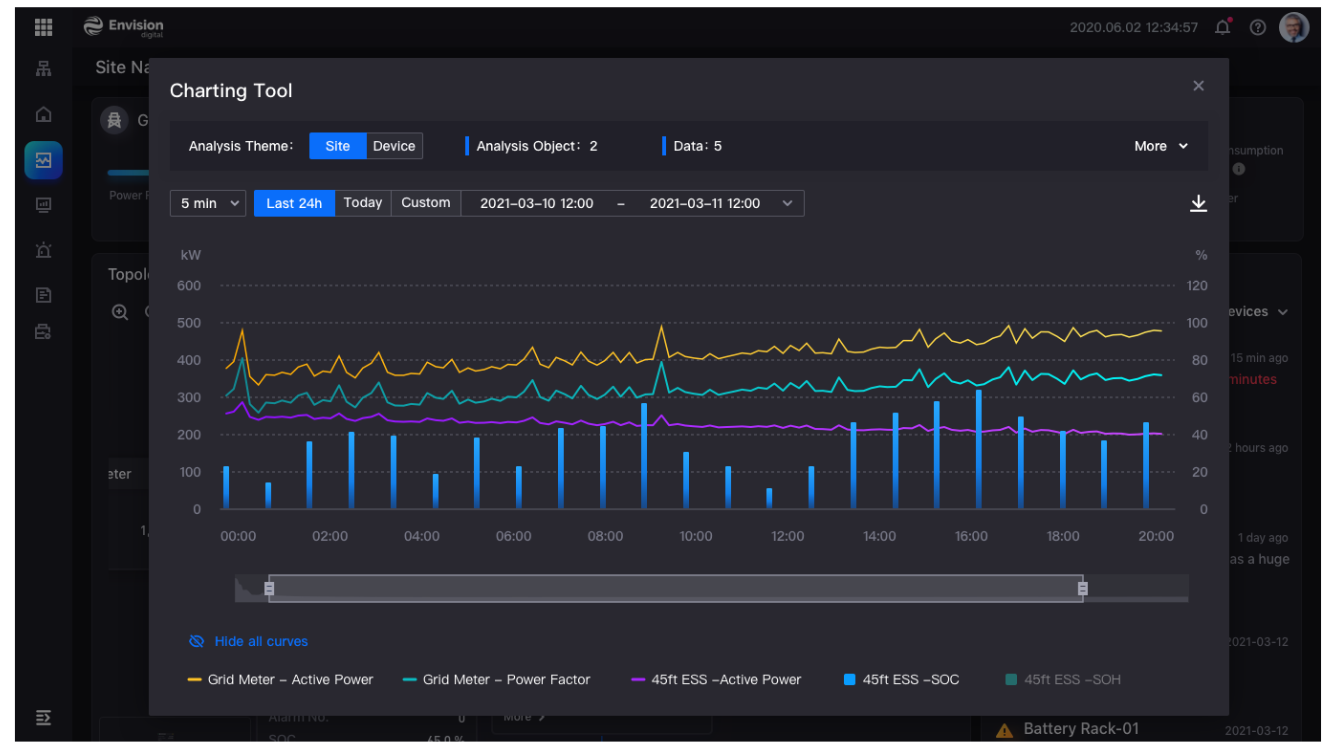
Trend Analysis
For each node, you can add its data field for trend analysis. This is generally used to analyze the overall performance of the component over a period of time.
You can add a data field for trend analysis by following these steps:
Click on the data field that you want to add.
Click on Trend Analysis at the top right corner of the widget. Here, you can check the list of added data fields, remove some by clicking the x button beside their names, or remove all of them by clicking
 .
.
The Trend Analysis window is displayed.
Data Fields
The data fields required are:
Field |
Quantity |
|---|---|
Dimension |
0 - 2 |
Measurement |
Unlimited |
Chart Style
Node Style
Format the node appearance.
Topology Source
Field |
Description |
|---|---|
URL |
Specify the URL that defines the topology tree structure |
Header
Field |
Description |
|---|---|
Title |
Specify the data field that holds the header title |
Font [1] |
Style the title label |
Icon |
Specify the data field that holds the icon |
Status |
Specify the data field that holds the status of each node |
Current Flow |
Specify the data field that holds the direction of current flow |
Content
Field |
Description |
|---|---|
Name Font [2] |
Style the name labels |
Value Font [2] |
Style the value labels |
Decimal Places |
Round up the displayed chart data to the specified decimal places |
Convert Unit |
Select this to enable unit conversion based on magnitude of data value |
Unit Font [2] |
Style the unit labels |
Other Settings
Trend Analysis Hyperlink
Field |
Description |
|---|---|
URL |
Specify the URL to open when users click Start Analysis |