Device Status Chart
The device status chart presents the data of a large number of devices at once as a matrix. Each cell represents one device, and its color is taken from a gradient scale according to the value, which makes anomalies easy to spot. It is recommended for device health inspection, comparing the status of several sites, and monitoring many devices at the same time.
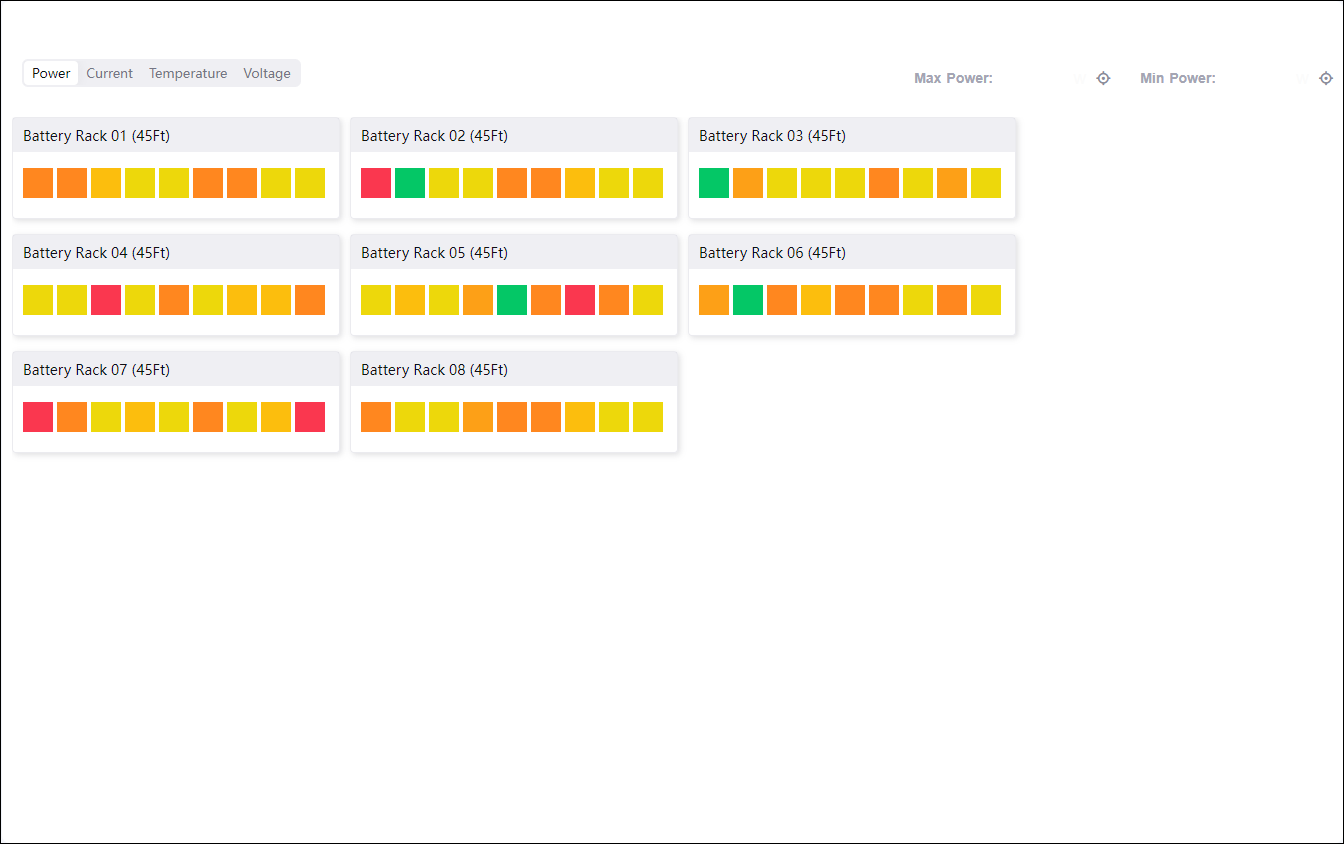
For common configuration such as the title, background, padding, and refresh frequency, see Common Configurations for Charts.
Data of Device Status Chart
The device status chart takes device names from Dimension and cell values from Measurement. It accepts 1 dimension and any number of measurements.
For general information about data sources and data fields, see Common Configurations for Charts > Configuring Data.
Note
Only Common Data Service (CDS) data sources are supported.
Parent Metrics
The hierarchy of the matrix comes from the models selected in the Category of the data source: the first model becomes the parent and the second the child. A parent appears as a title row, and the child devices below it each occupy one cell. When only one model is selected in the category, each device appears directly as a cell. When 3 or more models are selected, only the first 2 take part in building the hierarchy and the devices of the remaining models are not shown.
Measurements are sorted automatically into either Parent Metrics Style or Child Metrics Style according to the model they belong to, with no manual assignment needed:
With only 1 model selected in the category, all measurements go into Child Metrics Style and the Parent Metrics Style section is hidden.
With 2 models selected, measurements belonging to the first model go into Parent Metrics Style and those belonging to the second into Child Metrics Style. A measurement belonging to both models produces a configuration card in each group.
Note
The grouping is calculated only when a measurement is added or replaced; changing the number of models in the category does not regroup. So if you select 2 models, configure the measurements, and then change the category back to 1 model, the measurements originally placed in Parent Metrics Style stay in that group and the section remains visible, but their configuration has no effect in a single-model matrix. Delete those measurements and add them again to regroup them according to the current number of models.
Style of Device Status Chart
Dimension Style
This section is shown only once a dimension field has been added.
Name Font: Sets the font, font size, color, bold, italic, and underline style of the device names.
Parent Metrics Style
This section is shown only when parent metrics exist, and produces one configuration card per parent metric.
Show Name: Selected by default, showing the name of the metric in the parent title row.
Name Font: Sets the font, font size, color, and style of the metric name.
Unit Name: Enter the unit text shown after the value. Empty by default.
Dynamic Unit: When selected, the unit is chosen automatically from the magnitude of the data (for example 1000 becomes 1 k). Cleared by default.
Unit Font: Sets the font, font size, color, and style of the unit text.
Value Font: Sets the font, font size, color, and style of the metric value.
Decimal Places: Rounds the value to the specified number of places, with a default of 2.
Child Metrics Style
This section is shown only when child metrics exist, and produces one configuration card per child metric.
Unit Name: Enter the unit text shown after the value. Empty by default.
Dynamic Unit: When selected, the unit is chosen automatically from the magnitude of the data. Cleared by default.
Decimal Places: Rounds the value to the specified number of places, with a default of 2.
Gradient
Gradient determines the range over which cell values map to colors.
Auto: Selected by default, taking the actual minimum and maximum of that metric among the devices currently shown as the two ends of the scale.
Min / Max: Once Auto is cleared, specify the values at the two ends of the scale manually. Values outside that range take the color of the nearer end.
Reverse: When selected, the color direction is reversed, so high values take the color that low values would otherwise take.
Color Pattern
Select one of the preset scales: Blue Green (default), Blue Yellow, Tricolor, or Multicolor.
Note
The device status chart takes colors continuously from a scale according to the value and provides no state enum for mapping a particular state value to a particular color. To color by discrete state, use the Heat Map, which supports segment matching. When no value can be retrieved, the cell is shown in the neutral gray of the current theme.
Other Settings
Cell Settings
Width: The side length of each square cell, in pt, with a default of 40. This value directly affects the visual density of the matrix.
Spacing: The distance between adjacent cells, in pt, with a default of 4. Increasing it makes the cells easier to tell apart.
Min/Max Label
The min/max label appears in the upper right corner of the widget and marks the devices with the highest and lowest values of the current metric.
Name Font: Sets the font style of the device name in the label.
Value Font: Sets the font style of the value in the label.
Unit Font: Sets the font style of the unit text in the label.
Interactions at Runtime
The widget provides the following behaviors at runtime, with no configuration needed:
Switching metrics: The top of the widget generates one tab per child metric, and switching tabs switches the metric that drives the cell colors. The min/max label is recalculated accordingly.
Locating extremes: Selecting the target button
 in the upper right corner of the widget marks the cells holding the extreme values in the matrix. When several devices share an extreme value, all of them are marked.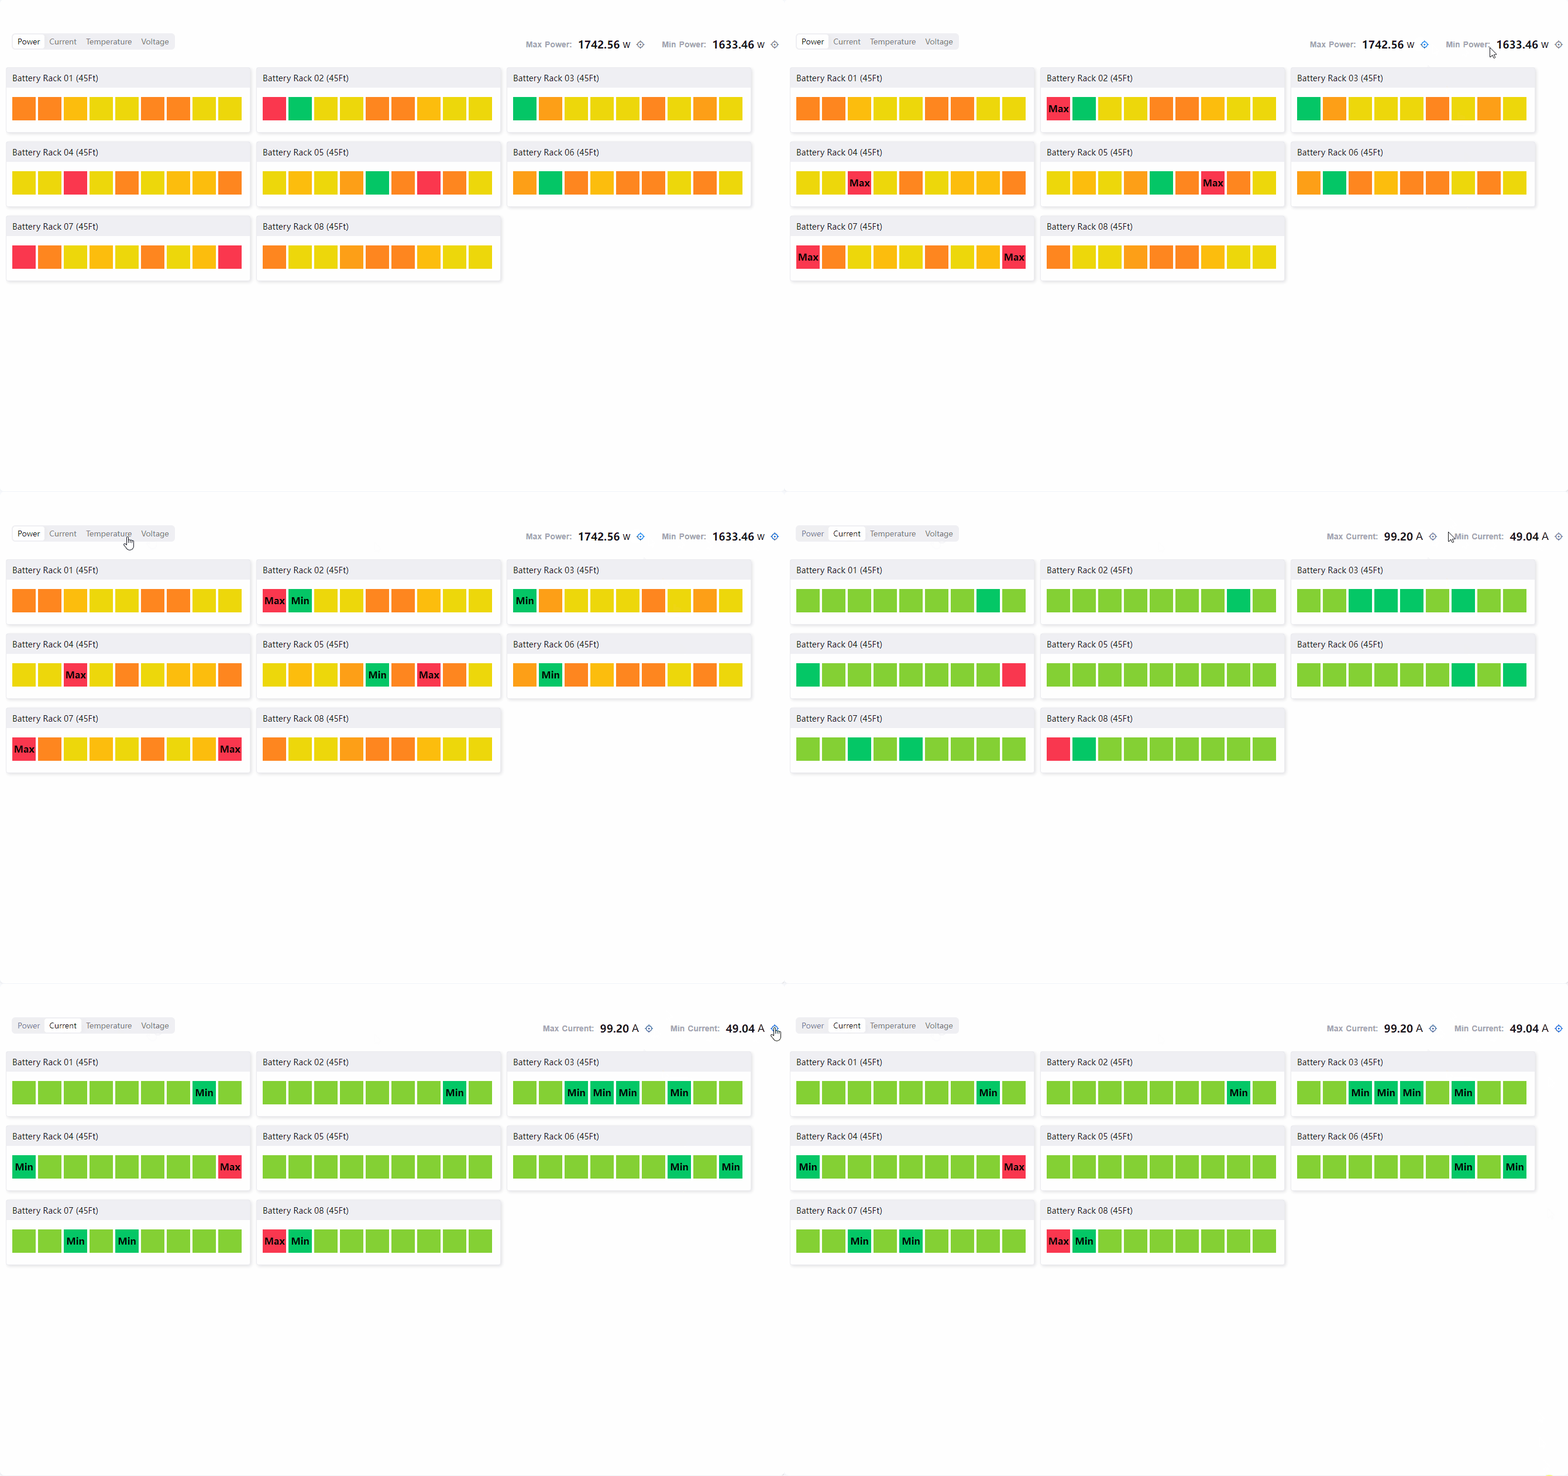
Hover tooltip: Hovering the mouse over a cell shows the device name, the current metric name, the value, and the unit.
Collapsing parent metrics: When the parent title row is too narrow, its metrics collapse into an ellipsis button, which opens an overlay showing all parent metrics.
Sorting: Once a sort order is set for the dimension field, both parents and children are sorted by device name.
Empty state: When the query returns no data, the widget shows an empty-state prompt; when a parent has no child devices, that row shows No Data.